Nat. Hazards Earth Syst. Sci., 16, 1821–1839, 2016 www.nat-hazards-earth-syst-sci.net/16/1821/2016/ doi:10.5194/nhess-16-1821-2016
© Author(s) 2016. CC Attribution 3.0 License.
Ensemble flood simulation for a small dam catchment in Japan
using 10 and 2 km resolution nonhydrostatic model rainfalls
Kenichiro Kobayashi1, Shigenori Otsuka2, Apip3, and Kazuo Saito4
1Research Center for Urban Safety and Security, Kobe University, 1-1 Rokkodai-machi, Nada-ku, Kobe, 657-8501, Japan 2RIKEN Advanced Institute for Computational Science, Kobe, Japan
3Research Centre for Limnology, Indonesian Institute of Sciences (LIPI), Bogor, Indonesia 4Meteorological Research Institute, Tsukuba, Japan
Correspondence to:Kenichiro Kobayashi (kkobayashi@phoenix.kobe-u.ac.jp)
Received: 1 October 2015 – Published in Nat. Hazards Earth Syst. Sci. Discuss.: 18 December 2015 Revised: 20 May 2016 – Accepted: 11 July 2016 – Published: 9 August 2016
Abstract.This paper presents a study on short-term ensem-ble flood forecasting specifically for small dam catchments in Japan. Numerical ensemble simulations of rainfall from the Japan Meteorological Agency nonhydrostatic model (JMA-NHM) are used as the input data to a rainfall–runoff model for predicting river discharge into a dam. The ensemble weather simulations use a conventional 10 km and a high-resolution 2 km spatial high-resolutions. A distributed rainfall– runoff model is constructed for the Kasahori dam catch-ment (approx. 70 km2)and applied with the ensemble rain-falls. The results show that the hourly maximum and cumula-tive catchment-average rainfalls of the 2 km resolution JMA-NHM ensemble simulation are more appropriate than the 10 km resolution rainfalls. All the simulated inflows based on the 2 and 10 km rainfalls become larger than the flood discharge of 140 m3s−1, a threshold value for flood con-trol. The inflows with the 10 km resolution ensemble rain-fall are all considerably smaller than the observations, while at least one simulated discharge out of 11 ensemble mem-bers with the 2 km resolution rainfalls reproduces the first peak of the inflow at the Kasahori dam with similar ampli-tude to observations, although there are spatiotemporal lags between simulation and observation. To take positional lags into account of the ensemble discharge simulation, the rain-fall distribution in each ensemble member is shifted so that the catchment-averaged cumulative rainfall of the Kasahori dam maximizes. The runoff simulation with the position-shifted rainfalls shows much better results than the original ensemble discharge simulations.
1 Introduction
Currently, short-term ensemble flood forecasting based on ensemble numerical weather predictions (NWPs) is gaining more attention in Japan, as evidenced by the commencement of a project for ensemble weather/flood forecasting using the new K computer in Kobe, Japan (Saito, 2013b). Here, short-term flood forecasting means flood forecasts with lead times of half to 1 day. Cloke and Pappenberger (2009) pre-sented a comprehensive review of medium range (2–15 days ahead) ensemble flood forecasts; however, the review fo-cused mainly on European weather/flood forecasting exam-ples using global ensemble predictions.
the areas of concern for most river/dam administrators are too small for global NWP models.
In the aforementioned project (Saito, 2013b), the Mete-orological Research Institute tested ensemble NWPs with 2 km resolution, finer than used previously for mesoscale en-semble forecasts (e.g., Saito et al., 2010, 2011). With such a resolution, complex topographies and mesoscale convec-tive systems can be better represented. In addition, the atmo-spheric model does not apply cumulus convective parame-terizations, which enables us to reproduce rainfall with more realistic intensities. Therefore, such high-resolution cloud-resolving ensemble weather simulations can produce prob-abilistic information of intense rainfall systems better than mesoscale models with lower resolutions (Duc et al., 2013). Using ensemble rainfall forecasts produced by the JMA non-hydrostatic model (JMA-NHM), the authors have performed a study on the ensemble flood forecasting for a real extreme flood event in Niigata, Japan, using a rainfall–runoff model, the results of which are presented in this paper.
Flood disasters occurred on 27–30 July 2011 in Niigata and Fukushima prefectures, Japan, following a severe rain-storm, characterized by two rainfall peaks. According to a report by the Niigata Prefecture (Niigata, 2011), the cumu-lative rainfall from the onset of the rainfall until 13:00 JST (04:00 UTC) on 30 July 2011 reached 985 mm at the Kasa-hori Dam Observatory. The cumulative rainfall at 68 rain-fall observatories managed by MLIT, JMA, and Niigata Prefecture exceeded 250 mm. During this time, JMA an-nounced “record-setting short-term heavy rainfall informa-tion” on 30 occasions. The hourly rainfall recorded from 20:00 to 21:00 JST on 29 July at the Tokamachi-Shinko Ob-servatory reached 120 mm, which is an example of extreme record-setting rainfall within the region. Among the many lo-cal record-setting rainfall amounts, this paper focuses on the Kasahori dam catchment, which is a small sub-catchment of the Shinano river catchment.
The report by the Japan Weather Association (hereinafter JWA, 2011) indicates that the discharge forecasting system, operated at the Kasahori dam using short-term and very-short-term rainfall prediction by a weather model, was ef-fective for deciding the quantity of water release from the Kasahori dam. According to the report, at 03:00 JST on 29 July 2011 the discharge forecasting system predicted dam inflow of 846 m3s−1 at 13:00 JST on 29 July, in considera-tion of the observed inflow of 843 m3s−1. This information, together with a telephone consultation between the JWA and dam administrator, supported the decision for the preliminary dam release. Although this clearly demonstrates the useful-ness of precipitation forecasts in dam control, it is not easy to produce an accurate deterministic forecast of precipita-tion for a small-scale dam catchment. Therefore, this paper studies the effectiveness of ensemble flood forecasting on the Kasahori dam catchment.
The structure of this paper is as follows. Section 2 describes additional details regarding the 2011 Niigata–
Fukushima heavy rainfall. Section 3 briefly describes the Kasahori dam catchment and the Kasahori dam. Section 4 addresses the rainfall analysis using rain gauge and radar-derived rainfalls. Section 5 introduces the rainfall–runoff model. Section 6 presents the results of the rainfall–runoff simulations using both observed rainfall and ensemble pdictions of rainfall. Section 7 presents the concluding re-marks and aspects of future work.
2 The 2011 Niigata–Fukushima heavy rainfall
A local heavy rainfall event occurred in July 2011 over Ni-igata and Fukushima prefectures in northern central Japan. Record-breaking torrential rainfall of more than 600 mm was observed during 3 days from 27 to 30 July, which caused se-vere damages in the prefectures of Niigata and Fukushima. Six people were killed and more than 13 000 houses dam-aged by dike breaks, river flooding, and landslides.
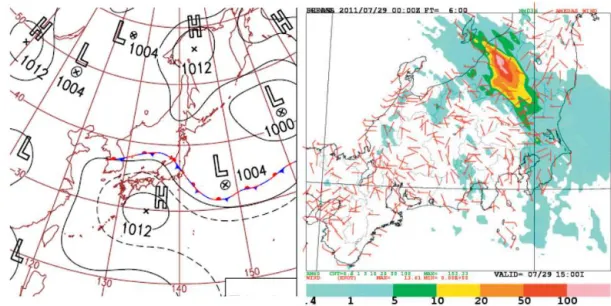
Figure 1 (left) indicates a surface weather map at 09:00 JST (00:00 UTC), 29 July 2011. A distinct synoptic-scale stationary front runs from the northwest to the south-east over northern central Japan. The right panel of Fig. 1 shows the 3 h accumulated rainfall from 12:00 to 15:00 JST (03:00 to 06:00 UTC) (radar–rain-gauge precipitation analy-sis of the Japan Meteorological Agency). Torrential rain ex-ceeding 100 mm per 3 h occurred over the small area along the stationary front. A detailed description of this rainfall event has been published by JMA as a special issue of the JMA Technical Report (JMA, 2013a).
3 Kasahori dam catchment
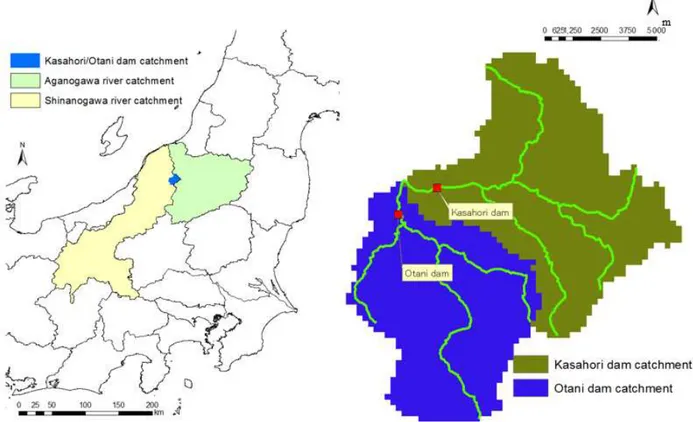
Figure 2 (left) shows the Shinano and Agano river catch-ments, Japan, and Fig. 2 (right) shows an enlarged view of the Kasahori and Otani dam catchments. These catchment data were obtained from the Digital National Land Informa-tion (hereinafter DNLI) of MLIT (MLIT, 2012b). The Kasa-hori dam catchment area is calculated as 72.7 km2from the DNLI; thus, the catchment is very small. The land use of the Kasahori dam catchment is shown in Fig. 3 (left), which re-veals that most of the area is occupied by forest. Therefore, the model area is treated as entirely forested in the following modeling. The basic operation of the Kasahori dam is sum-marized as follows.
1. In the rainy season, the reservoir water level is de-creased to the normal water level for the rainy season (elevation level (EL) 194.5 m).
K. Kobayashi et al.: Ensemble flood simulation for a small dam catchment in Japan 1823
Figure 1.Surface weather map for 09:00 JST, 29 July (left). Three-hour accumulated observed rainfall from 12:00 to 15:00 JST (right).
3. When the inflow exceeds 140 m3s−1, the gate opening is fixed so that the outflow amount is determined only by the water pressure. This is, in a broad sense, natural regulation. The gate opening is not adjusted until the water level reaches EL 206.6 m.
4. When the reservoir water level reaches EL 206.6 m,
Tadashigaki(emergency) operation is taken: the outflow is set equal to the inflow.
Note that, after the flood event in July 2011, the dam has been under renovation to increase its flood control capacity.
4 Analysis of rainfall over the Kasahori dam catchment
The analysis of the rainfall over the Kasahori dam catchment is performed in this section. The rain gauge (RG) rainfall, JMA radar-composite (RC), and JMA radar–rain-gauge (RR) analyzed data are used for the investigation. The descriptions of the RC and RR data are as follows.
(a) The 1 km resolution RC data: the echo intensity, which can be converted to rainfall intensity, is observed by 20 meteorological radar stations of JMA and is available with 10 min temporal resolution.
(a) The 1 km resolution RR analyzed precipitation data: the rainfall intensity observed by the radar is corrected us-ing rain gauge data (ground observation data) and they are available with 30 min temporal resolution.
See Nagata (2011) for the further details of the analysis data. Several previous studies have been published (e.g., Kamiguchi et al., 2010; Sasaki et al., 2008) using these precipitation analysis data.
(a) RG rainfall data: the time-series data of hourly rainfall of the Otani dam, Otani, Koumyozan, Kasahori dam, Kasahori, and Dounokubo rainfall observatories, shown in Fig. 3 (right), are used as the ground observation data. A Thiessen polygon is drawn based on the lo-cations of the observatories, by which each observa-tory is assigned a representative area. Then, the hourly rainfall data are given to each representative area in the calculation. The cumulative and maximum hourly rainfalls for the period 01:00 JST 28 July to 24:00 JST 30 July were 955 mm and 83 mm h−1 at the Kasahori dam, 722 mm and 71 mm h−1at Kasahori, 786 mm and 74 mm h−1at Koumyozan, and 723 mm and 78 mm h−1 at Dounokubo, respectively.
Figure 2.Shinano and Agano river catchments (left). Kasahori dam and Otani dam catchments (right).
K. Kobayashi et al.: Ensemble flood simulation for a small dam catchment in Japan 1825
Figure 4.Catchment-averaged rainfalls of the Kasahori dam catchment.
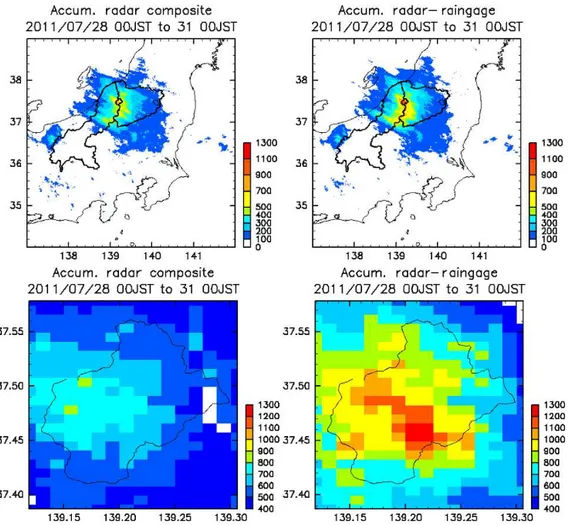
Figure 6.Spatial patterns of cumulative rainfalls around the Shinano and Agano catchments using radar composite (upper left) and radar–rain gauge (upper right) and around the Kasahori dam catchment using radar composite (lower left) and radar–rain gauge (lower right) for the 2004 rainfall event.
greater than that caused by the 2011 rainfall, although the total amount of rainfall in 2011 was larger. Figure 6 shows that the RC rainfall is larger than RR rainfall for the 2004 rainfall. The RR rainfall is obtained by correcting the RC using RG rainfall. Thus, the magnitude of the relation be-tween the RC and RR rainfalls depends on the magnitude of the RG rainfall compared with the RC. The precipitation by RC is occasionally larger than the RR rainfall when the RG rainfall is smaller than RC and sometimes vice versa. As the RC can be obtained at 10 min interval with greater spatial coverage, it is considered more reasonable for use in future real-time purposes, though the authors do not carry out the operation. Thus, the calibration of the rainfall–runoff model is performed using RC rainfall.
5 Methods
5.1 Distributed rainfall–runoff (DRR) model
A DRR model was applied to the Kasahori dam catchment. The DRR model applied is that originally developed by Ko-jima and Takara (2003) called CDRMV3. The details of this DRR model can be seen in the work by Apip et al. (2011). In the DRR model, the surface and river flows are simulated using a 1-D kinematic wave model. The subsurface flow is simulated using aq–hrelationship developed by Tachikawa et al. (2004). The schematic of theq–hrelationship is shown in Fig. 7, whereqis the discharge per unit width andhis the water depth, as shown in Fig. 7a. The mathematical expres-sion is as follows:
q (h)=
vmdm
h dm
β
, (0≤h≤dm)
vmdm+va(h−dm), (dm< h≤da)
vmdm+va(h−dm)+α(h−da)m, m=5
K. Kobayashi et al.: Ensemble flood simulation for a small dam catchment in Japan 1827
Figure 7. (a)Schematic of the surface–subsurface flow on a hillslope (upper);(b)relationship between unit width dischargeqand water depthhin each grid (lower).
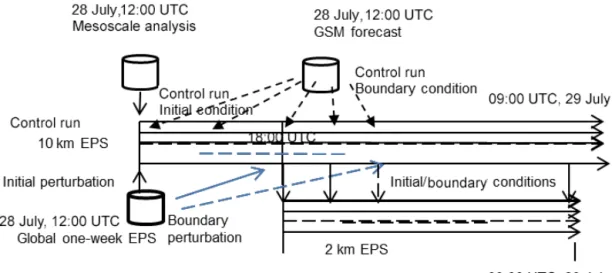
Figure 8.Schematic of the 10 and 2 km EPSs.
where vm=kmi, va=kai, α=pi/Nslope, and D is the thickness of the layer, shown in Fig. 7a;da−dmis the area of the saturated flow;dmis the area of unsaturated flow;vmis the unsaturated flow velocity;kmis the hydraulic conductiv-ity indm;irepresents the slope gradient;vais the saturated flow velocity;kais the hydraulic conductivity inda−dm; and Nsloperepresents the equivalent roughness coefficient of the slope. βkm=kaneeds to be satisfied to establish the conti-nuity of theq–hrelationship. The initial dischargeQi is set
at the catchment outlet of the river. NormallyQi is the
ob-served discharge in the beginning of the simulation. Then,
theQi is converted to the water depthhin each grid of the
entire catchment depending on the ratio of the flow accumu-lation value for the particular grid and the flow accumuaccumu-lation value at the outlet. Thus, before the simulation, all the grids already have the initial water depthhidepending onQi. This
Table 1.Equivalent roughness coefficient of the forest, Manning’s coefficient of the river, and soil-related parameters identified by the radar composite.
Forest River D ks
(m−1/3s) (m−1/3s) (m) (m s−1)
0.15093 0.004 0.320 0.0005
5.2 Mesoscale ensemble prediction system
Two 11-member ensemble forecasts with different horizon-tal resolutions (10 and 2 km) were conducted for the 2011 Niigata–Fukushima heavy rainfall event using JMA-NHM (Saito et al., 2006; Saito, 2012) as the forecast model. The 10 km ensemble prediction system (EPS) uses the JMA’s operational mesoscale 4D-Var analysis of 12:00 UTC (21:00 JST) on 28 July and the JMA’s global spectral model (GSM) forecast from the same time as the initial and bound-ary conditions of the control run, respectively. As for the ini-tial and lateral boundary conditions, perturbations from the JMA’s 1-week global ensemble prediction from 12:00 UTC (21:00 JST) on 28 July were employed, whose detailed pro-cedures are given in Saito et al. (2010, 2011). The 2 km EPS is a downscaling of the 10 km EPS with a 6 h time lag, using the forecasts of the 10 km EPS as the initial and boundary conditions (Fig. 8).
The bulk method that predicts the mixing ratios of six wa-ter species (wawa-ter vapor, cloud wawa-ter, rainwawa-ter, cloud ice, snow, and graupel) and the number density of cloud ice was adopted as the cloud microphysical process. The 10 km EPS applied the modified Kain–Fritsch convective parameteriza-tion scheme, while the 2 km EPS did not use convective pa-rameterization. Other physical processes of the two systems were almost the same to those of the operational mesoscale model and the local forecast model of JMA (JMA, 2013b). The verification of the statistical performance of similar double-nested EPSs has been given by Duc et al. (2013).
Figure 9 (upper left) shows the 3 h accumulated rainfall from 12:00 to 15:00 JST (21:00 to 24:00 JST) by the control run of the 10 km EPS. Although the maximum value of the predicted rainfall (74 mm) is somewhat weaker than the ob-servation (right panel of Fig. 1), the region of intense rainfall is simulated well. The upper right panel of Fig. 9 indicates the forecast by each member of the 10 km EPS. Seemingly, the result of each ensemble member resembles the others, and the basic characteristic features of the observed rainfall are simulated well. The maximum rainfall was obtained by member p02 (89 mm). A common feature seen in these fig-ures is that weak fake rainfall appears over the coastal re-gion facing the Sea of Japan, which is likely produced by the Kain–Fritsch convective parameterization.
Figure 9 lower panels shows the corresponding results by the 2 km EPS. The concentration of intense precipitation
is produced more clearly, the maximum rainfall of which reaches 237 mm. The areas of weak rainfall over the western coastal region, appearing in Fig. 9 upper panels, no longer develop because of the removal of the convective parameteri-zation. A detailed analysis of the two EPSs (ensemble spread and fraction skill scores) and the result of a sensitivity ex-periment to the orography have been presented by Saito et al. (2013a).
6 Results
First, the DRR model is verified by performing experiments with the observed rainfall data. Next, the ensemble rainfall forecast data are used to perform an ensemble flood forecast. Finally, additional experiments are performed to consider po-sition errors of rainfall.
6.1 Rainfall–runoff simulations with radar and rain gauge rainfalls
The inflow to the Kasahori dam is simulated using the DRR model. The RG, RC, and RR data are used as the inputs to the runoff simulations. The three hydrographs with the parame-ters identified by the RC are shown in Fig. 10. The simulated hydrograph with the RC rainfall is in relatively good agree-ment with the observations, which is to be expected because the model parameters are calibrated against the RC rainfall. Using a straight line method for the base flow separation, the total discharge with RC in mm becomes 556.3 mm while the total rainfall is 568.5 mm.
The simulated hydrographs for the other two rainfalls are larger than the observations. We do not address the magni-tude of the relationship in this paper because it is not possible to determine more accurate rainfall data. The RG, RC, and RR measurements all have strengths and weaknesses; how-ever, we focus on the consideration of RC for use because of the frequency of the data, i.e., 10 min interval.
6.2 Ensemble rainfall–runoff simulations with raw output of JMA-NHM
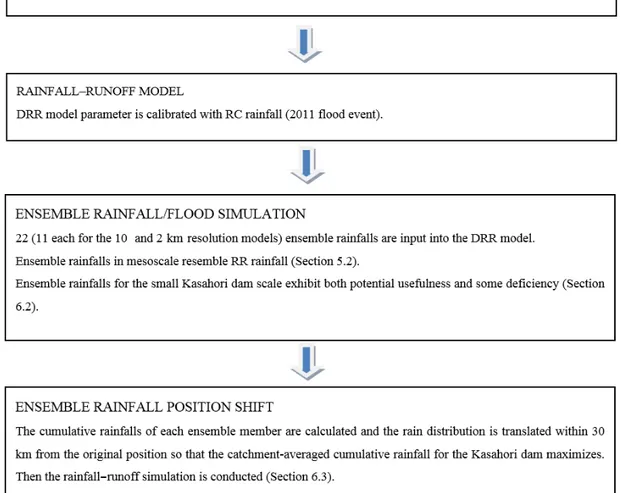
Using the ensemble rainfalls from JMA-NHM, explained in Sect. 5.2, the ensemble flood simulation focusing on the Kasahori dam catchment was performed. A flowchart is shown in Fig. 11 to explain briefly again the overall proce-dure of the methodology for the ensemble simulations used in the paper.
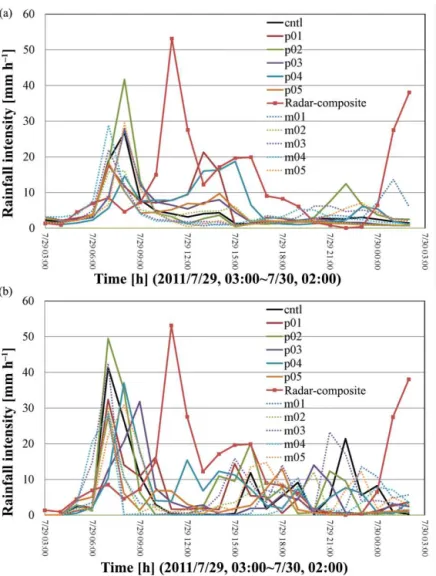
The catchment-averaged ensemble rainfalls obtained from the 10 and 2 km resolution NHM are shown in Fig. 12. Fig-ure 12 (upper) shows the control run and five negatively per-turbed members, m01–m05 (m indicates minus), and five positively perturbed members, p01–p05 (p indicates posi-tive), for the 10 km resolution.
K. Kobayashi et al.: Ensemble flood simulation for a small dam catchment in Japan 1829
Figure 9.Three-hour accumulated rainfall from 12:00 to 15:00 JST (03:00 to 06:00 UTC) on 29 July by the control run of the 10 km EPS (upper left). Same as in the left figure, but the forecast by each member of the 10 km EPS (upper right). The figures on the lower left and right are the same as in the upper figures but for the forecasts by the 2 km EPS.
Figure 11.Flowchart of the overall procedure for the ensemble weather/flood simulation.
RC rainfall. Thus, the dam inflows, obtained from the RC parameters in Table 1 with the 10 km resolution ensemble rainfall, lead to lower magnitude discharge compared with the ground observations (shown later in the paper).
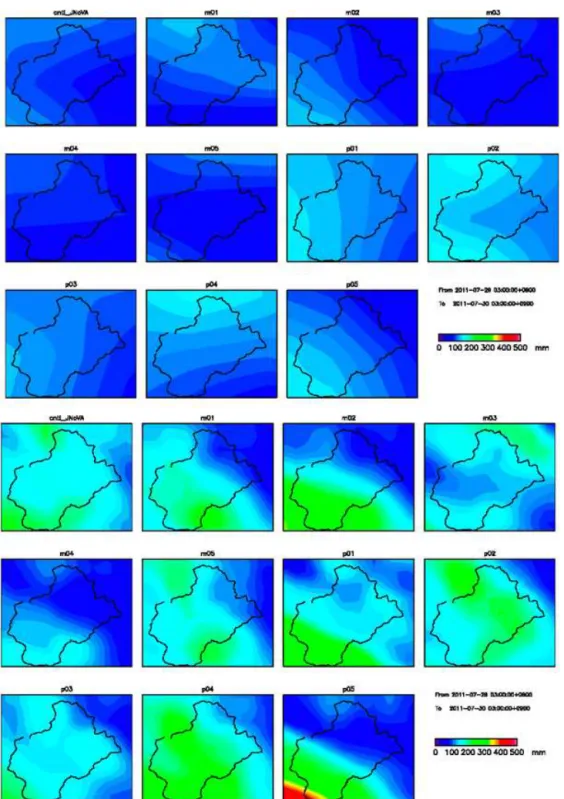
Figure 12 shows the control run, m01–m05, and p01–p05 for the 2 km resolution NHM. The figures reveal that the first peak in the 2 and 10 km resolution ensemble simulations ap-pears 2–4 h earlier than that in the observation. The magni-tudes of some 2 km resolution ensemble rainfalls are equiv-alent to that of the RC rainfall. Thus, dam inflows using the RC parameters in Table 1 with the 2 km resolution ensem-ble rainfall can indicate discharge with equivalent magnitude (shown later in the paper). Figure 13 shows the spatial pat-terns of the cumulative ensemble rainfalls from 03:00 JST on
K. Kobayashi et al.: Ensemble flood simulation for a small dam catchment in Japan 1831
Figure 12.Catchment-averaged rainfalls with JMA-NHM 10 km resolution ensemble simulation (upper) and with JMA-NHM 2 km resolu-tion ensemble simularesolu-tion (lower).
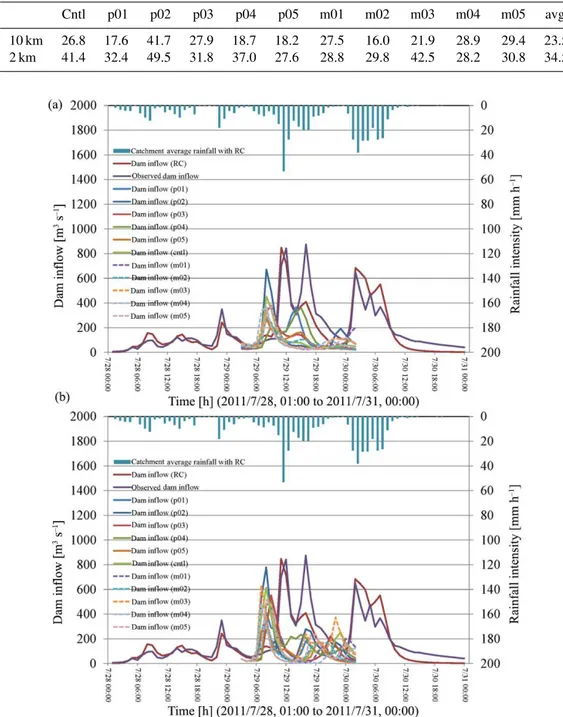
rainfall in Table 3, p02 shows the highest values in both the 10 and 2 km resolution NHMs. The maximum hourly rain-fall in the 2 km resolution NHM is also greater than that in the 10 km resolution NHM. This tendency is also true in the average maximum hourly rainfall shown in Table 3.
Figure 14 (upper) shows the simulated inflow to the Kasa-hori dam with the control run and positively/negatively per-turbed rainfalls of the 10 km resolution NHM. Figure 14 (upper) shows that all the inflows to the Kasahori dam are lower than the observations; however, these inflows exceed the flood discharge of 140 m3s−1, which is the threshold for the flood control operation (see Sect. 3 for the details of the operation).
Figure 14 (lower) shows the simulated discharge with the 2 km resolution ensemble rainfalls. Figure 14 (lower) shows that at least the first peak of the dam inflow in p02 shows a comparable value with that of the observed inflow; the peak discharge of the observation is 843 m3s−1, whereas it is 779 m3s−1with the p02 of the 2 km resolution NHM.
How-ever, the occurrence of the first peak in the simulation is 4 h earlier than indicated by the observations. The fact that one of the ensemble flood discharges with the 2 km resolution NHM shows approximately equivalent magnitude of discharge with the observed first peak discharge, despite the forward shift in occurrence time, implies that the ensemble flood prediction with the 2 km resolution NHM could potentially be used as a reference in dam operations, although the discharge repro-duction is still not fully satisfactory both in quality and quan-tity. The ensemble flood simulations with the 10 km resolu-tion NHM could not reproduce the peak at all. Moreover, the first peak of the simulated inflow with the control run of the 2 km resolution NHM attains only 614 m3s−1. A single value from a deterministic (i.e., control run only) NWP (i.e., pre-vailing prediction) might fail to capture a realistic discharge, whereas ensemble simulations produce additional prediction ranges that cover the higher observed discharge values.
Figure 13.Spatial distributions of cumulative ensemble rainfalls (upper: 10 km resolution; lower: 2 km resolution).
Table 2.Cumulative rainfall of 2 and 10 km resolution ensemble rainfall simulations.
Cntl p01 p02 p03 p04 p05 m01 m02 m03 m04 m05 avg.
K. Kobayashi et al.: Ensemble flood simulation for a small dam catchment in Japan 1833
Table 3.Maximum hourly rainfall of 2 and 10 km resolution ensemble rainfall simulations.
Cntl p01 p02 p03 p04 p05 m01 m02 m03 m04 m05 avg.
10 km 26.8 17.6 41.7 27.9 18.7 18.2 27.5 16.0 21.9 28.9 29.4 23.5 2 km 41.4 32.4 49.5 31.8 37.0 27.6 28.8 29.8 42.5 28.2 30.8 34.5
Figure 14.Results of ensemble flood simulations with 10 km resolution rainfall (upper) and with 2 km resolution rainfall (lower).
dam inflows from the control run and the other 10 ensem-ble rainfall predictions of both the 2 and 10 km resolution NHMs all predict that the dam inflow is above the flood dis-charge threshold (i.e., 140 m3s−1). The single weather simu-lation produces solely a deterministic value, which does not reflect the uncertainty of the initial conditions, whereas en-semble simulations enhance confidence in the prediction by incorporating the uncertainty. The exceedance probability of 11/11 by the ensemble simulations is numerically the same as the probability of 1/1 by a single simulation. However,
the physical implications of these two values are different in terms of confidence and significance.
All the dam inflow simulations, however, show that the second and third peaks of the inflow are much smaller than indicated by the observations. In the actual flood event, the so-calledTadashigakioperation was implemented at around the time of the second and third peaks. In theTadashigaki
Figure 15.Inflow volume into the reservoir based on observation and 2 km ensemble simulations.
Figure 16.Examples of the position shifts of the ensemble rainfalls.
a critical situation this time because the second and third discharge peaks are not properly reproduced. This is a defi-ciency of the ensemble forecast method at this time. The ac-cumulated inflow volume to the dam of both the observation and 2 km ensemble simulation from 03:00 JST, 29 July 2011, to 03:00 JST, 30 July 2011, is shown in Fig. 15. It can be seen
K. Kobayashi et al.: Ensemble flood simulation for a small dam catchment in Japan 1835
Figure 17.Spatial distributions of cumulative ensemble rainfalls with position shift (2 km resolution).
6.3 Ensemble rainfall–runoff simulations with position-shifted rainfall
Numerical weather prediction have inevitable forecast er-rors. The current case has a large amount of accumulated rainfall within a limited area and is sensitive to the po-sition error. Although ensemble simulation represents the uncertainty to some extent, the ensemble spread tends to be under-dispersive because of imperfect model/initial con-dition representations and limited ensemble sizes. Duc et al. (2013) verified the spatial–temporal fractions skill score of 10 km/2 km ensemble forecasts for heavy rainfall events occurring over central Japan from 3 July 2010 to 2 Au-gust 2010. They showed that a spatial scale of 60 km (po-sitional lag of 30 km) should be considered to obtain a rea-sonable reliability from a high-resolution ensemble forecast. Thus, it is important to take into account the position error within a reasonable distance before input to the runoff model. To improve the ensemble rainfalls in quantity and timing, the cumulative rainfalls of each ensemble member are calcu-lated and the rain distribution is transcalcu-lated within 30 km from the original position so that the catchment-averaged cumula-tive rainfall for the Kasahori dam maximizes. The analysis is carried out using the 2 km resolution, 30 h rainfall after the
Figure 18.Results of ensemble flood simulations with rainfall position shift (upper: control run and negatively perturbed members; lower: control and positively perturbed members).
performance although testing with more cases is desirable to confirm that.
As indicated in Sect. 5.2, it is known that ensemble weather simulations can be useful in adding value to weather forecasts. In the current operational weather forecasting, it is not necessarily expected that the weather will be pre-dicted accurately for any specific location. However, accu-rate prediction over dam catchments is the main concern of river dam administrators. In this regard, this paper shows clearly that although the original 2 km prediction forecast provides much better results than that with the 10 km reso-lution prediction, greater accuracy is still desirable. For ex-ample, in dam/reservoir operations, the reliable prediction of the peak timing, flood duration, and runoff volume is ex-tremely important parameters necessary to avoid erroneous operation. The results with original ensemble rainfalls here
do not match the current requirements; however, the position-shifted 2 km resolution ensemble rainfall could be a useful tool for supporting operational decisions after statistical val-idation with various rainfall events, which would not be pos-sible based on previous simulations with coarser resolutions.
7 Concluding remarks and future aspects
rain-K. Kobayashi et al.: Ensemble flood simulation for a small dam catchment in Japan 1837
Figure 19.Inflow volume into the reservoir based on observation and ensemble simulations with rainfall position shift.
fall over the small catchments and associated flood processes are too rapid to be captured well by coarse-resolution NWP models. Thus, JMA-NHM with the 2 km resolution was used to simulate the rainfall over the catchment. As the result, all 11×2 ensemble simulations (i.e., 10 and 2 km resolu-tions) predicted that the dam inflow would exceed the flood discharge of 140 m3s−1, which is the threshold quantity for flood control. However, only one out of 11×2 (2 and 10 km resolutions) ensemble predicted discharges, based on the en-semble rainfalls, reproduced in a broad sense the first peak of the observed discharge of the historically rare flood that occurred on 28–30 July 2011 with a 4 h lag in the occurrence time. Nevertheless, this is considered insufficient for the dam operations. In contrast, the position-shifted ensemble flood simulations (Sect. 6.3) show much better results and become comparable to the observation, indicating the importance of appropriate treatment of forecast uncertainties.
One of the strengths of the current study is the use of resolving ensemble NWPs. However, the cloud-resolving ensemble forecast is still too expensive for oper-ational NWPs. Although this limits the number of experi-ments and their experimental periods in the current study, some previous studies also reported experimental use of sim-ilar NWP-based quantitative precipitation forecasts (QPFs) in the flood forecasting. For example, Yu et al. (2015) showed an improvement of rainfall and flood forecasting by blend-ing NWP-based and radar-based QPFs. Their target was ty-phoon Talas of 2011 over the two catchments, Futatsuno (356.1 km2)and Nanairo (182.1 km2), of Shingu river basin (2360 km2), Japan. In contrast, the target site (72.7 km2)of the current study is much smaller and the target weather
sys-tem is more confined in space, implying that the current case can be more challenging than the cases in Yu et al. (2015).
As far as we recognized, this study is the first trial of applying NWP-based ensemble QPF to such a small dam catchment of less than 100 km2, showing potential benefits and difficulties at this spatiotemporal scale. Particularly, we demonstrated that the position error correction of ensem-ble QPF plays an important role for reliaensem-ble flood forecast-ing. As a matter of course, bias correction and blending radar-based and NWP-based QPFs will also improve QPF up to lead times of several hours (e.g., Sun et al., 2014) and would bring further improvements in flood forecasting. For instance, Bowler et al. (2006) showed a good example of short-term blending ensemble rainfall prediction. Further research for the generalization of the proposed method and validation with more cases are needed. Likewise, the study of the optimization for the dam operational rule remains as the future work.
In any case, overall results are considered on some level helpful for decision-making related to flood control, espe-cially as a supporting tool in addition to discharge observa-tions and forecasting with radars. Likewise, improving the accuracy of original rainfall forecasted by high-resolution state-of-the-art numerical models, dense observation net-works, and advanced data assimilation techniques is still es-sential.
8 Data availability
DRR model is available under collaborative framework be-tween Kobe, Kyoto Universities and related institute or uni-versity. The JMA’s operational analyses and forecasts, radar rain gauge analyses, and radar composite analyses can be purchased at http://www.jmbsc.or.jp/. The rain gauge data were provided by MLIT, Niigata Prefecture and JMA.
Acknowledgements. The first author performed the field survey of the region as a member of the investigation group of the Japan Society of Civil Engineers, led by Nobuyuki Tamai, Emeritus at the University of Tokyo. Through these activities, we received much useful information and data from the Niigata Prefecture. The authors would like to thank Tamai and the many other people who offered their help. This study is supported by the MEXT Global COE programme, “Sustainability/Survivability Science for a Resilient Society Adaptable to Extreme Weather Conditions” (GCOE-ARS; programme leader: Kaoru Takara, DPRI, Kyoto University). The authors appreciate the help provided by Takara. The ensemble forecast using JMA-NHM was conducted at the Meteorological Research Institute (MRI) as a part of the Grant-in-Aid for Scientific Research (21244074) and the HPCI Strategic Programs for Innovative Research (SPIRE, hp150214) of MEXT, We thank Seiji Origuchi and Hiromu Seko of MRI for their help in performing the ensemble forecasts.
Edited by: M.-C. Llasat
Reviewed by: two anonymous referees
References
Apip, Sayama, T., Tachikawa, Y., and Takara, K.: Spatial lumping of a distributed rainfall-sediment-runoff model and its effective lumping scale, Hydrol. Proc., 26, 855–871, 2011.
Bowler, N. E., Pierce, C. E., and Seed, A. W.: STEPS: A probabilis-tic precipitation forecasting scheme which merges an extrapola-tion nowcast with downscaled NWP, Quart. J. Roy. Meteor. Soc., 132, 2127–2155, 2006.
Cloke, H. L. and Pappenberger, F.: Ensemble flood forecasting: A review, J. Hydrol., 375, 613–626, 2009.
Duc, L., Saito, K., and Seko, H.: Spatial-temporal fractions verifi-cation for high resolution ensemble forecasts, Tellus, 65, 18171, doi:10.3402/tellusa.v65i0.18171, 2013.
Japan Meteorological Agency: Report on “the 2011 Niigata-Fukushima heavy rainfall event”, typhoon Talas (1112) and ty-phoon Roke (1115), Tech. Rep. JMA, 134, http://www.jma.go. jp/jma/kishou/books/gizyutu/134/ALL.pdf (last access: 22 July 2015), 253 pp., 2013a (in Japanese).
Japan Meteorological Agency: Outline of the operational nu-merical weather prediction at the Japan Meteorological Agency, http://www.jma.go.jp/jma/jma-eng/jma-center/nwp/ outline2013-nwp/index.html (last access: 22 July 2015) 2013b. Japan Weather Association: Overview of the
Kasa-hori dam rainfall-runoff prediction system, http: //www.jwa.or.jp/var/plain_site/storage/original/application/ 08b6516f714560696bcbed8422ad99b6.pdf (last access: 22 July 2015), 2011 (in Japanese).
Kamiguchi, K., Arakawa, O., Kitoh, A., Yatagai, A., Hamada, A., and Yasutomi, N.: Development of APHRO_JP, the first Japanese high-resolution daily precipitation product for more than 100 years, Hydrol. Res. Lett., 4, 60–64, 2010.
Kojima, T. and Takara, K.: A grid-cell-based distributed flood runoff model and its performance, Weather Radar Information and Dis-tributed Hydrological Modelling IAHS Publ. No. 282, 234–240, 2003.
Makihara, Y.: Algorithm for precipitation nowcasting focused on detailed analysis using radar and rain gauge data. Technical Re-port, MRI, 39, 63–111, 2000.
MLIT: X band MP radar rainfall information, http://www.river.go. jp/xbandradar (last access: 22 July 2015), 2012a (in Japanese). MLIT: Digital National Land Information download service, http:
//nlftp.mlit.go.jp/ksj/ (last access: 22 July 2015), 2012b (in Japanese).
Nagata, K.: Quantitative Precipitation Estimation and Quan-titative Precipitation Forecasting by the Japan Meteoro-logical Agency, RSMC Tokyo – Typhoon Center Techni-cal Review 13, http://www.jma.go.jp/jma/jma-eng/jma-center/ rsmc-hp-pub-eg/techrev/text13-2.pdf (last access: 22 July 2015), 37–50, 2011 (in Japanese).
Niigata Prefecture: Niigata/Fukushima extreme rainfall disaster sur-vey documentation (as of 22 August 2011), http://www.pref. niigata.lg.jp/kasenkanri/1317679266491.html, (last access: 22 July 2015), 2011 (in Japanese).
Saito, K.: The Japan Meteorological Agency nonhydrostatic model and its application to operation and research, Atmospheric Model Applications, InTech, , 85–110, doi:10.5772/35368, 2012. Saito, K., Fujita, T., Yamada, Y., Ishida, J., Kumagai, Y., Aranami,
K., Ohmori, S., Nagasawa, R., Kumagai, S., Muroi, C., Kato, T., Eito, H., and Yamazaki, Y.: The operational JMA Nonhydrostatic Mesoscale Model, Mon. Wea. Rev., 134, 1266–1298, 2006. Saito, K., Kuroda, T., Kunii, M., and Kohno, N.: Numerical
Sim-ulations of Myanmar Cyclone Nargis and the Associated Storm Surge, Part 2: Ensemble prediction, J. Meteorol. Soc. Japan, 88, 547–570, 2010.
Saito, K., Hara, M., Kunii, M., Seko, H., and Yamaguchi, M.: Com-parison of initial perturbation methods for the mesoscale ensem-ble prediction system of the Meteorological Research Institute for the WWRP Beijing 2008 Olympics Research and Develop-ment Project (B08RDP), Tellus A, 63, 445–467, 2011.
Saito, K., Origuchi, S., Duc, L., and Kobayashi, K.: Mesoscale ensemble forecast experiment of the 2011 Niigata-Fukushima heavy rainfall, Techical Report of the Japan Meteorological Agency, 134, 170–184, http://www.jma.go.jp/jma/kishou/books/ gizyutu/134/ALL.pdf, (last access: 22 July 2015), 2013a (in Japanese).
Saito, K., Tsuyuki, T., Seko, H., Kimura, F., Tokioka, T., Kuroda, T., Duc, L., Ito, K., Oizumi, T., Chen, G., Ito, J., and SPIRE Field 3 Mesoscale NWP group: Super high-resolution mesoscale weather prediction, J. Phys. Conf. Ser., 454, 012073, doi:10.1088/1742-6596/454/1/012073, 2013b.
Sasaki, H. and Kurihara, K.: Relationship between Precipitation and Elevation in the Present Climate Reproduced by the Non-hydrostatic Regional Climate Model, SOLA, 4, 109–112, 2008. Sun, J., Xue, M., Wilson, J. W., Zawadzki, I., Ballard, S. P.,
pre-K. Kobayashi et al.: Ensemble flood simulation for a small dam catchment in Japan 1839
cipitation: Recent progress and challenges, Bull. Amer. Meteor. Soc., 95, 409–426, 2014.
Tachikawa, Y., Nagatani, G., and Takara, K.: Development of stage-discharge relationship equation incorporating satu-rated/unsaturated flow mechanism. Annual Journal of Hydraulic Engineering, JSCE, 48, 7–12, 2004 (in Japanese).
