www.hydrol-earth-syst-sci.net/20/4707/2016/ doi:10.5194/hess-20-4707-2016
© Author(s) 2016. CC Attribution 3.0 License.
Coupled hydro-meteorological modelling on a HPC platform
for high-resolution extreme weather impact study
Dehua Zhu1,a, Shirley Echendu1, Yunqing Xuan1, Mike Webster1, and Ian Cluckie1
1College of Engineering, Swansea University Bay Campus, Swansea, SA1 8EN, UK
anow at: School of Hydrometeorology, Nanjing University of Information Science and Technology. Nanjing, 210044, China
Correspondence to:Dehua Zhu ([email protected])
Received: 21 March 2016 – Published in Hydrol. Earth Syst. Sci. Discuss.: 24 June 2016 Revised: 9 November 2016 – Accepted: 10 November 2016 – Published: 29 November 2016
Abstract.Impact-focused studies of extreme weather require coupling of accurate simulations of weather and climate systems and impact-measuring hydrological models which themselves demand larger computer resources. In this pa-per, we present a preliminary analysis of a high-performance computing (HPC)-based hydrological modelling approach, which is aimed at utilizing and maximizing HPC power resources, to support the study on extreme weather im-pact due to climate change. Here, four case studies are presented through implementation on the HPC Wales plat-form of the UK mesoscale meteorological Unified Model (UM) with high-resolution simulation suite UKV, alongside a Linux-based hydrological model, Hydrological Predictions for the Environment (HYPE). The results of this study sug-gest that the coupled hydro-meteorological model was still able to capture the major flood peaks, compared with the conventional gauge- or radar-driving forecast, but with the added value of much extended forecast lead time. The high-resolution rainfall estimation produced by the UKV performs similarly to that of radar rainfall products in the first 2–3 days of tested flood events, but the uncertainties particularly increased as the forecast horizon goes beyond 3 days. This study takes a step forward to identify how the online mode approach can be used, where both numerical weather predic-tion and the hydrological model are executed, either simulta-neously or on the same hardware infrastructures, so that more effective interaction and communication can be achieved and maintained between the models. But the concluding com-ments are that running the entire system on a reasonably powerful HPC platform does not yet allow for real-time sim-ulations, even without the most complex and demanding data simulation part.
1 Introduction
Extreme precipitation with great intensity and the subse-quent flash flooding events arising from rivers and moun-tainous watersheds often lead to considerable economic dam-age and casualties, because water levels can react extremely quickly within rather limited warning lead time (flash flood-ing). Therefore, the evaluation of potential flooding risks in extreme weather conditions, and the corresponding protec-tion measures required, demands accurate short-term flood forecasting, and more often very short lead-time forecasting – termed “nowcasting” (Cloke and Pappenberger, 2009).
The fast development of HPC (high-performance comput-ing), as well as that of NWP (numerical weather prediction) models, has since given rise to the use of NWP, either directly or indirectly in hydrological simulations, in an effort to push hydrological forecasting beyond the limit of the rainfall-observation time horizon. This link between two different modelling disciplines is often referred to as model coupling. The resulting coupled meteorological–hydrological models appeared from the beginning of the 21st century, being ini-tially focused on flash-flood forecasting, and later extended to handle climatic–hydrological coupling. This has facili-tated many climate-change impact studies on water resources that rely heavily on the use of climate projections or simula-tions. Nevertheless, the linkage between the meteorological and hydrological models is scientifically challenging due to differences in model structures and issues of incompatible units (use of different scales in time and space). This is en-capsulated, in particular, in the task of how best to transform and regionalize global climate scenarios, with spatial resolu-tions of 1000–10 000 km2, to hydrological mesoscale catch-ments of 10–1000 km2.
Simulation with meteorological–hydrological coupling in high spatial and temporal resolution is a comparatively new field of hydrological research, yet some pioneering work has recently appeared. In order to analyse the prediction of selected events characterized by peak flows, Westrick et al. (2002) proposed a hydrometeorological forecasting system for mountainous watersheds by coupling the Penn State–NCAR Mesoscale Meteorological Model (also known as MM5 for brevity; Dudhia, 1993; Grell et al., 1994) in 4×4 km2resolution and the distributed hydrological model
DHVSM (Wigmosta et al., 1994). Jasper et al. (2002) com-pared the hydrological performance of radar and gauge mea-surements with five different high-resolution NWP models and grid-cell sizes between 2 and 14 km. This work cov-ered the prediction of peak flows on the alpine Ticino–Toce watershed, using the distributed hydrological model WaSiM (Schulla and Jasper, 2000). The results suggest that the ac-curacy and consistency of NWP rainfall in hydrological ap-plications heavily depend on their process modelling at all scales of model nesting. Particularly so, as inaccuracies in-troduced by downscaling of precipitation from NWP mod-els can lead to large differences in the predicted hydrolog-ical results, especially during extreme convective storm pe-riods. Kunstmann and Stadler (2005) coupled (in a one-way manner) the mesoscale meteorological model MM5 with the distributed hydrological model WaSiM. The meteorological re-analysis data were dynamically downscaled with MM5 grid-cell sizes from 100 to 2 km using four nests. Find-ings show that the MM5-based interpolation of precipitation yielded 21 % less total yearly precipitation in the catchment area, compared to the station-based interpolation. Yarnal et al. (2000) linked a high-resolution meteorological model (MM5 at 4 km resolution) and a suite of coupled hydro-logical models in the Susquehanna River Basin Experiment
(SRBEX). This work points out that the coupled model has to confront several issues, such as physics and parameter-izations, for a mesoscale atmospheric model to match the timescales of climate coupled to the hydrological, meteo-rological and climatological process models with different scales, and accordingly the immense computational needs. Xuan et al. (2009) also indicated that the inaccuracies and uncertainties in NWP could propagate to the downstream hy-drological models, and they proposed to use an ensemble-based approach, together with effective bias correction, to mitigate this problem.
The majority of the studies cited above have been rely-ing on the use of the so-called downscalrely-ing of large-scale NWP results using regional meteorological model such as MM5. These studies are often conducted in an offline man-ner where hydrological modellers have hardly any control of NWP except the meso-scale one used for downscaling. How-ever, the work presented in this paper not only focuses on the performance of coupled high-resolution meteorological– hydrological simulations for extreme storm events on a HPC platform. It is also aimed at exploring the potential of build-ing and runnbuild-ing fully coupled NWP-hydrological forecasts on a single computer platform, and therefore being able to obtain first-hand knowledge on fully integrated hydro-meteorological modelling. As such, we did not apply the me-teorological model in forecasting mode, but used hindcasting mode instead, to test the model performance and benchmark-ing over several selected historical events.
One of the main challenges faced in coupled NWP-hydrological model simulation, or operational forecasting, is their reliance on computationally implementing NWP. In turn, this necessitates the use of HPC, a procedure which can be performed in two different fashions: firstly, through an offline approach, where the hydrological model receives data that are generated from NWP beforehand (e.g. the data disseminated from various national meteorological centres), and secondly through an online mode, where both NWP and the hydrological model are executed, either simultaneously or on the same hardware infrastructures, so that more ef-fective interaction and communication can be achieved and maintained between the models. Most existing studies have adopted the former approach to ease technical demands on HPC as well as on NWP.
2 Materials and methods
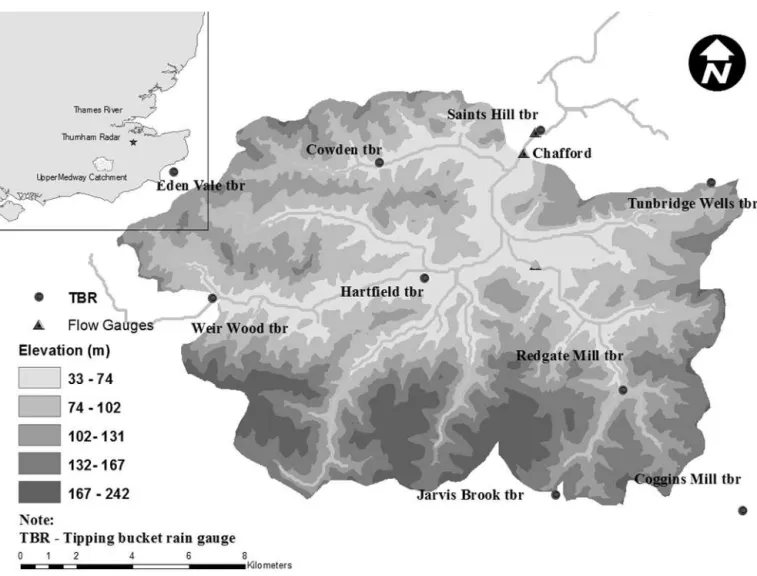
In this study, the principal goal of the experiment has been to simulate the river basin response to extreme storm events, by linking a semi-distributed hydrological HYPE model to the UK Met Office Unified Model (UM) at a much finer spatial scale (1.5 km). The combined high-resolution one-way driven model experiments generate runoff hydrographs for three extreme flood events, which occurred in the Upper Medway catchment (220 km2) located south of London in the UK (see Fig. 1).
The catchment elevation varies between 30 and 220 m above mean sea level and the majority of slopes range from 2 to 8◦, which makes up around 70 % of the whole catch-ment. This suggests that the main topography of the Upper Medway catchment is made up of small hills surrounding the flat, low-relief, low-lying area without much variation of elevation. The land use in the catchment can be simplified and described as permanent grass (over 95 %). The major soil types in the Upper Medway catchment can be categorized as silty loam and clayey silt, according to the National Soil Re-sources Institute (NSRI) data. The geology of the catchment is a mixture of permeable (chalk) and impermeable (clay) and the dominant aquifers consist of the Ashdown Formation and the Tunbridge Wells Formation of the Hastings Group. The saturation-excess mechanism is the major runoff gener-ation process in the catchment.
In such model experiments, two different sets of meteo-rological input data were used: (1) surface observation data from station measurements and from weather radar estima-tion, and (2) forecast rainfall data from high-resolution UM simulation suite, UKV, with grid-cell sizes of 1.5 km. The experiments were designed as follows: (1) selecting repre-sentative storms and hydrographs for simulation, (2) simu-lating these storms using the high-resolution UKV simula-tion model, and (3) modelling the river-basin response to the simulated storm events using the HYPE hydrological model. One notes that Met Office has used the operational high-resolution UK 1.5 km model (UKV) under the New Dynam-ics algorithm specification. This introduces nested opera-tions, through parallel suites PS30 and the time periods of interest. As such, this consists of a global 25 km simulation, followed by a North Atlantic–European 12 km simulation, and finally, a UKV 1.5 km simulation. Each such simulation stage provides the necessary lateral (spatio-temporal) bound-ary conditions for the regionally refined subsequent stage.
Rainfall observations from weather radars were also in-troduced in this study to check the UKV output, since rain gauges are point-based and the radar rainfall can provide well represented rainfall distribution. Moreover, the comparison with UKV input through a hydrological model can be drawn, in terms of streamflow differences.
The rain-gauge measurements are collected from nine real-time, tipping-bucket rain gauges (TBRs) operated by the UK Environment Agency (EA). Figure 1 shows the
loca-tions of the rain gauges (circles) and the flow gauges (tri-angles) on the catchment. And all the flow comparisons in this study were carried out at the Chafford flow gauge close to the catchment outlet.
The radar rainfall estimates used in this study are extracted from the UK NIMROD composite data set. This has been provided and quality-controlled by the UK Met Office us-ing the lowest available scan. It has been adjusted against available rain-gauge measurement and undergone extensive processing to correct for various sources of radar error. Such radar error would include noise, clutter, anomalous propa-gation, attenuation, occultation, and “bright band” and oro-graphic enhancement. Therefore, these high-resolution radar composite rainfall estimates incorporate the latest UK Met Office processing algorithms to account for the different sources of errors in the estimation of precipitation using weather radars (Harrison et al., 2000). This implies that this data set is the best possible estimate of rainfall available at the ground level in the UK (i.e. it is the most error-free).
More details in regards to the properties of this catch-ment and data description used in this study, such as topog-raphy, vegetation, and soil types, as well as the availability of a hydrological data set, have been detailed in Zhu and Cluckie (2012) and Zhu et al. (2014).
2.1 UKV model configuration and implementation The Unified Model is an atmospheric predictive numerical modelling software, offered by the UK Met Office and writ-ten in FORTRAN. Here, its output is coupled with a hydro-logical model for the purpose of accurate flood and extreme storm prediction. The UM was built on Archer hardware, with specification as a Cray XC30 MPP supercomputer and with up to 4920 compute nodes, each having a two 12-core Intel Ivy Bridge series processor, providing a total of 118 080 processing cores. Each node has 64 GB memory, with a sub-set of large memory nodes possessing 128 GB.
Further to the successful build and implementation of the UM, output from the various implementations has been val-idated against results derived from other HPC architectures. The UM features a new dynamics algorithm, which is based on a semi-implicit, semi-Lagrangian formulation, that uses a common finite-difference scheme for the fully compressible, non-hydrostatic Euler equations, discretized on a latitude– longitude grid. The algorithm is designed around a matrix-bound approach that is used to solve the semi-implicit as-pects of the scheme.
lev-Figure 1.Map of rain gauges and flow gauge locations on the Upper Medway catchment (source: Zhu and Cluckie, 2012).
els vertically and a time step of 10 min is used. The re-gional NAE problem suite has a resolution of 12 km, across a 600×360 grid. The NAE suite also has 70 vertical levels
but the time-step choice is 5 min. Finally, the regional UKV is set at 1.5 km resolution over a 622×810 grid with a time
step of 50 s.
UKV model implementation requires a few events for model run. This includes an initialization date and a num-ber of subsequent time-duration periods, i.e. 3, 6, 8, and 12 days. A selection of 8-day start dumps was used in this study, requested from ECMWF or the Met Office. The Met Office holds start dumps to a back-date of up to 5 years only; prior to that, start dumps would need to be obtained from other sources.
The steps of the UKV process in the overall procedure are to run as follows: first, the global reconfiguration and fore-cast; second, the European reconfiguration and forefore-cast; and finally, the UKV reconfiguration and forecast. These inde-pendent simulation steps are all dynamically linked through lateral boundary conditions (LBCs), and regionalization of a
start dump. With the start dump reconfigured for a UM input file format (global region), this is then utilized to initialize the global, European and UKV reconfiguration and to obtain an additional start dump for the forecasting stage. In turn, the global forecast is run to obtain lateral boundary condi-tions for the European stage, whilst the European forecast provides lateral boundary conditions for the UKV.
The UKV model outputs were also on a rotated longitude– latitude grid, whose resolution is not constant, with small de-viations from 1.5 km depending on the locations. The data were further projected onto the National Grid Reference Grid to become comparable with other sources of data, such as the weather radar rainfall observation from the NIMROD sys-tem. A nearest-neighbour interpolation was used to produce the evenly distributed grid data after projecting.
2.2 The configuration and calibration of hydrological model HYPE
HYPE (Hydrological Predictions for the Environment) – has been selected in this study to avoid reliance on commercial modelling packages. HYPE is developed at Swedish Mete-orological and Hydrological Institute (SMHI), with a focus on integrating water and water quality throughout the model compartments and predictions in ungauged catchments with large model set-ups, e.g. across Europe. It is a dynamical model forced with time series of precipitation and air tem-perature, typically on a daily time step. Forcing in the form of nutrient loads is not dynamical. Examples of HYPE appli-cations include atmospheric deposition, fertilizers, and waste water.
The HYPE model is able to predict water and nutrient con-centrations in the landscape at the catchment scale. Its spa-tial division is related to sub-catchments and corresponding characteristics, including land use, vegetation, soil type, and elevation. Within a particular catchment, the model will sim-ulate water content in different compartments, including soil moisture, shallow groundwater, rivers, and lakes.
The default time step in HYPE is daily, but it can be re-duced to hourly, which is normally specified in the input data set, such as precipitation. Since there is no 2-D surface runoff algorithm built in the HYPE model, it is in principle a lumped model. However, spatial variations can be accounted for by portioning the catchment into smaller sub-catchments. In this respect, the simulated precipitation was processed as the catchment average rainfall before being fed to the HYPE model.
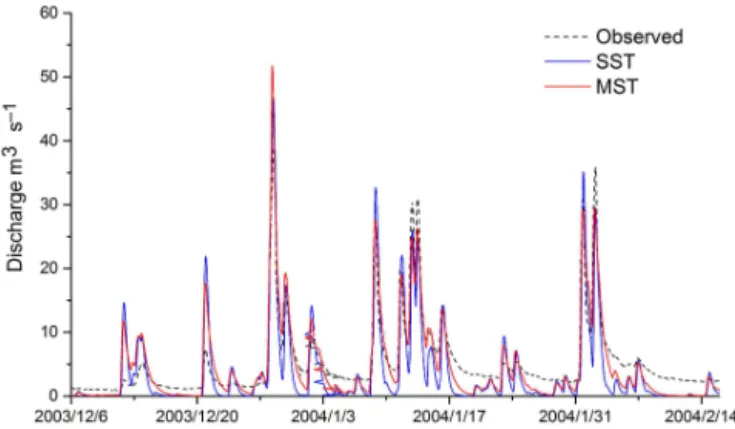
The winter flood event, which took place from 6 December 2003 to 28 February 2004, was used for model calibration, carried out using 1 h time step rain-gauge measurements and parameterized with the streamflow observation at the catch-ment outlet. In order to achieve the best fit between observed and modelled flow, the model parameters were calibrated in simulation mode using a mixture of manual and automatic parameter adjustment, according to their functionalities in the model.
First, all the parameters went through an initial manual sensitivity analysis, to choose those worthy of further auto-matic parameterization. In this study, the maximum amount of percolation (mperc1, mperc2) in soil layers needs to be calibrated for percolation to occur. In addition, the soil-type-related parameters, such as the available storage of water in the soil and the runoff coefficient of the topsoil layer (rrcs1), are sensitive in the model. And the peak velocity of flow in rivers (rivvel) determines the peak flow delay in the model, which also needs to be calibrated. After the sensitive parame-ters are selected, the progressive Monte Carlo simulation was employed to reduce the parameter space in stages and finally determine the calibrated parameters for later rainfall–runoff comparisons.
The soil properties setting is critical in HYPE model. Fig-ure 2 shows the model calibration performance with single soil type (SST) and multiple soil type (MST) settings. The soil types and the corresponding properties for the Upper
Figure 2.The comparison of model calibration with different soil settings.
Table 1.Soil properties for corresponding HOST number.
HOST Water content Field Wilting Infiltration at saturated capacity point rate (m s−1)
condition
9 0.501 0.418 0.244 3.4E-06 18 0.474 0.367 0.162 1.04E-06 16 0.46 0.378 0.219 1.9E-06 33 0.472 0.35 0.144 1.04E-06 3 0.441 0.295 0.117 3.6E-05 25 0.473 0.408 0.255 6.9E-08
Medway catchment are derived from the Hydrology of Soil Types (HOST, see Table 1), provided by the National Soil Resources Institute (NSRI) in the UK.
These data clearly indicate that the recessions period with SST setting was much faster than the observation, possibly due to less resilience from a single-soil-type setting and the shallow depth of soil layer in the model. Consequently, mul-tiple soil types and the increment depth of the soil layer were introduced to the model while the recession of the flood was improved. Additionally, the most critical performance crite-rion for the model, the Nash–Sutcliffe efficiency (NSE), in-creases from 0.68 (SST) to 0.82 (MST).
2.3 The settings of a coupled UKV-HYPE case study The UKV model is set to make 36 h forecasts with a high-resolution inner domain (1.5 km grid boxes) over the area of forecast interest, separated from a coarser grid (4 km) near the boundaries by a variable resolution transition zone. This variable resolution approach allows the boundaries to be moved further away from the region of interest, reducing unwanted boundary effects on the forecasts.
Figure 3.The comparison of accumulative catchment average rain-fall (event December 2006).
boundaries of the model to be pushed further away from the area of interest at lower cost, and also enables reduction of the resolution mismatch with the driving (12 km) model. The UKV rainfall estimation produced by the Unified Model is used as the input for the HYPE model, which provides the cornerstone to the coupled UKV-HYPE model.
3 Results and discussions
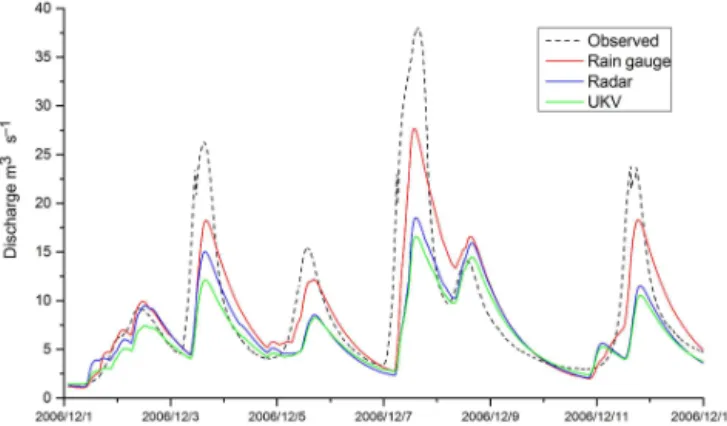
Four flood events were selected to evaluate the perfor-mance of UKV rainfall products through HYPE hydrologi-cal model, by comparing the simulated streamflow driven by rain-gauge measurements, NIMROD radar rainfall estimates, and UKV rainfall data. For the first flood event, there was around 100 mm depth of precipitation over the Upper Med-way catchment during 1 to 13 December 2006, according to the rain-gauge rainfall record.
Figure 3 shows the rainfall comparison on the accumula-tion of catchment average rainfall over the flood period. The UKV rainfall products had quite a good agreement with rain-gauge measurements before the high peak flow occurred on 7 December 2006, in terms of the accumulative catchment av-erage rainfall. However, the hydrological simulations illus-trated in Fig. 4 indicate that the rain-gauge measurements outperform the UKV rainfall product, especially on peak-flow simulations.
Figure 4 shows the comparison of the hydrological model performances driven by three different rainfall products in the entire event. The NIMROD radar rainfall estimates and UKV rainfall products were underpredicted on all the peak flows, especially on the highest peak flow that occurred around 8 December 2006, compared with the rain-gauge measurements. However, the UKV rainfall products have very similar performance with radar rainfall estimates, on the peak-flow volume and the time of the peak, which implies that the high-resolution NWP rainfall products are as good as the radar rainfall estimates in this flood event.
Figure 4.The comparison of flow simulation in HYPE (event De-cember 2006).
Figure 5.The comparison of accumulative catchment average rain-fall (event January 2007).
For the second flood event, the comparison of accumula-tive catchment rainfall is shown in Fig. 5. The trends on the rainfall data are reasonably good across all three data sets. The UKV rainfall data do however pick up some exagger-ated noisy peaks over the period between 9 and 10 January 2007.
Figure 5 also shows that the NIMROD radar data pro-duced more rainfall depth over the catchment than rain-gauge measurements, but less than the UKV rainfall. In addition, it shows similar rising cumulative rainfall for this event be-tween all three data sets, and particularly bebe-tween rain-gauge measurements and radar rainfall estimation up to 10 January. In contrast, one notes that the UKV rainfall underestimates rain-gauge and radar data sets before 10 January, but with a similar rising trend. Departure arises subsequently between all three data sets, with UKV rainfall providing the extreme outcome.
Figure 6.The comparison of flow simulation in HYPE (event Jan-uary 2007).
Figure 7.The comparison of accumulative catchment average rain-fall (event February 2007).
data suffer likewise, over the final two peaks, which are bet-ter captured by the rain-gauge data. The rain-gauge data do however underestimate the observed data output over this pe-riod.
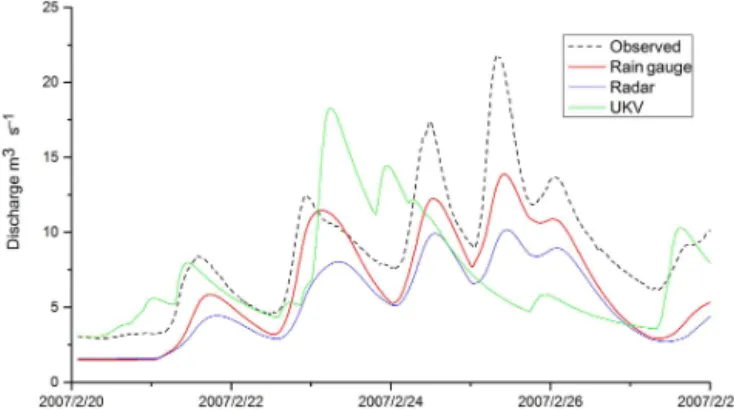
During the third flood event, there was a 50 mm rain-fall depth in total over the catchment, recorded by the rain gauges, which triggered the highest discharge at the catch-ment outlet of about 25 m3s−1 during the flood period. In
terms of the cumulative catchment rainfall, the rain-gauge measurement produced more precipitation than the UKV rainfall, followed by the radar rainfall estimation.
However, Fig. 7 shows that the UKV rainfall product did not capture the trend of accumulative rainfall over the catch-ment, and therefore totally missed the two flow peaks after 24 February 2007 (illustrated in Fig. 8) compared with the gauge measurement and radar rainfall estimates. The rain-gauge data outperform the radar data in this whole event, of which all the peak flows are better captured. However, the rain-gauge data do underestimate the observed data output over this period.
During the final event of July 2007, in terms of the flood magnitude, there was around 80 mm precipitation recorded by the rain gauges over 4 days which caused over 40 m3s−1
Figure 8. The comparison of flow simulation in HYPE (event February 2007).
discharge at the catchment outlet. It can be regarded as a sim-ilar case to the first flood event on December 2006, where the recorded streamflow was also around 40 m3s−1, triggered by around 100 mm of precipitation in the catchment over 12 days. However, there were no other peaks before the high-est flow appeared in this event and the peak only lasted 1 day, which implied that this was a flash flood (sudden high peak flow over a short period). It can also be identified from Fig. 9, which clearly showed that there was a significant in-crease (over 40 mm difference) on 20 July for the accumula-tive catchment precipitation calculated from all rainfall mea-surements and rainfall estimation products, especially dur-ing the period from 20 July at 08:00 LT to 20 July 2007 at 11:00 LT, when over 30 mm of precipitation fell on the catch-ment in 3 h, detected from the rain-gauge network.
Considering the differences between the rain-gauge mea-surements and radar rainfall estimates, the precipitation esti-mated from radar reflectivity could be heavily attenuated. Af-ter being converted to Cartesian format, the details of the sig-nal were further smoothed by the averaging process, which could explain the reason that the radar rainfall estimates un-derestimated a lot more than rain-gauge measurements. Ad-ditionally, because the model rainfall input for HYPE is the catchment average precipitation, the rainfall distribution and heterogeneities are not simulated, so that all the modelled flow was not comparable with the observation in this extreme rainfall flood event.
Figure 9.The comparison of accumulative catchment average rain-fall (event July 2007).
as to why the early disturbance has arisen for UKV output in this case, and provide more data evidence to prove or refute this particular finding. Further case study events would help clarify this issue, as the January 2007 event did not show this.
4 Conclusions
This paper describes a recent effort to integrate both the driver NWP models and the impact analyser–hydrological model on a single HPC platform to support better and more refined studies on extreme weather impacts. What distin-guishes this study from others is it is first time that mod-ellers are able to simulate the entire system, ranging from the global circulation down to a target catchment, for an im-pact study. This study also explores the feasibility of build-ing weather and climate services together with the impact-oriented analysis on a single platform, and what can be done if this is not feasible: for example, how computing resources can be re-arranged to deal with the issues.
The initial idea of this study was in fact to include a whole system model including the UKV, data processing, and hydrological models on an HPC platform. This differs from the usual approach of getting the IC/BC (initial con-dition/boundary condition) from a weather centre and then running a limited area model such as WRF and then some hydrological simulations. Further, it aimed to fully integrate a hydrological model component into the UKV, which is not revealed by this paper yet, but it will form the basis for ex-tension into a two-way coupling system, which will be de-veloped further in the future. Therefore, this study aimed to construct and run both NWP and the hydrological model, ei-ther simultaneously or on the same hardware infrastructures, to achieve more effective interaction and communication, so that the potential of fully coupled NWP-hydrological fore-casts on a single computer platform is explored, and first-hand knowledge on fully integrated hydro-meteorological modelling can be obtained.
Figure 10.The comparison of flow simulation in HYPE (event July 2007).
The study finds that when running the entire system on a reasonably powerful HPC platform, the overall time frame does not yet allow for a real-time simulation even without the most complex and demanding data simulation part. It is therefore suggested that the components responsible for large scale simulation, such as global and European areas, should remain at national weather service centres where dedicated HPC resources can deal with the demand as they already have been doing. However, it is still possible to have a high-resolution version with less geographical coverage running on a general-purpose HPC platform together with the impact analysing model such as a hydrological model and further inundation models. This configuration also allows for finer control and/or tuning of the models to fit various purposes.
The other main purpose of this study is to gain sight of how a common hydrological model can utilize the high-resolution precipitation (among others) forecast and simu-lation in an impact study of extreme weather events. It is encouraging to find that even without fine-tuning, such as using various parameterization schemes, the coupled hydro-meteorological was still able to capture the major flood peaks with much longer lead time compared with the conventional gauge- or radar-driven forecast (2–3 days vs. 2–3 h). The high-resolution UKV rainfall shows some promising agree-ment with rain-gauge measureagree-ments and radar estimation in the first 2–3 days in this flood event, both in the average catchment rainfall amount and hydrological simulation in HYPE.
this model coupling configuration, which, in fact, is the key research topic for further studies.
Overall, the primary value of this study is in making sure that the high-resolution UKV can be used to drive hydrologi-cal models like HYPE; and secondly, the study demonstrates that it is possible that with a moderate resources requirement, a fully integrated system can be established to benefit from independent data assimilation/NWP coupled with hydrologi-cal models. Although many deficiencies (such as uncertainty) still exist in such a system, as they do in many WRF-related studies, the ability to simulate from source (atmospheric ob-servations) to end (flow simulation) means that these issues will be addressed more efficiently in the future.
Consequently, the following recommendations for future work are made:
1. The study needs to be repeated and extended, as more data sets become available from UKV.
2. The impact of the high-resolution new radar data needs to be explored in the context of distributed hydrological modelling.
3. The UKV rainfall needs to be fully assessed by various lead times and ensemble simulations, which encapsulate uncertainty generation and propagation through com-plex “cloud to catchment” or “Whole Systems Mod-elling” concepts.
5 Data availability
The source code of hydrological model HYPE can be ob-tained from the Swedish Meteorological and Hydrological Institute (SMHI); the research license of Unified Model (UM) and the UKV suite can be applied through the Met Office in the UK. The NIMROD radar rainfall data can be requested and obtained from the British Atmospheric Data Centre (BADC); the hydrological data, including the rain gauge measurements and flow records, are managed by UK Environment Agency. The catchment characteristic data can be found in Sect. 2.
Acknowledgements. This study was partly funded under the Knowledge Transfer Partnership scheme, between Fujitsu Europe Laboratories Ltd and Swansea University, acting through support from Innovate UK (KTP009201) and the Welsh Government (GON CFI 468). The authors D. Zhu and S. Echendu would like to grate-fully acknowledge this support.
The study is also partly supported under the ongoing research initiative, “Welsh Extreme Weather Study”. The HPC resources were provided by HPC Wales (HPCW179). Access to the UM/UKV was supported by UK Met Office, under license agreement UM-L0030, which is also gratefully acknowledged. The NIMROD data were provided by the UK Met Office. The catchment soil data were provided by National Soil Resources Institute. The HYPE model and continuous modelling technical support were provided by the
Swedish Meteorological and Hydrological Institute. Finally, our thanks go to the National Centre for Atmospheric Sciences for their technical support and access to HPC resources.
Edited by: Q. Chen
Reviewed by: two anonymous referees
References
Cloke, H. L. and Pappenberger, F.: Ensemble flood forecasting: A review, J. Hydrol., 375, 613–626, 2009.
Dudhia, J.: A non-hydrostatic version of the Penn State/NCAR mesoscale model: validation tests and simulation of an At-lantic cyclone and cold front, Mon. Weather Rev., 121, 1493, doi:10.1175/1520-0493(1993)121<1493:ANVOTP>2.0.CO;2, 1993.
Golding B. W.: NIMROD: a system for generating automated very short range forecasts, Met. Appl., 5, 1–16, 1998.
Grell, G., Dudhia, J., and Stauffer, D.: A description of the fifth generation Penn State/NCAR Mesoscale Model (MM5), NCAR Technical Note, NCAR/TN-398CSTR, 117 pp., 1994.
Jasper, K., Gurtz, J., and Lang, H.: Advanced flood forecasting in Alpine watersheds by coupling meteorological observations and forecasts with a distributed hydrological model, J. Hydrol., 267, 40–52, 2002.
Kunstmann, H. and Stadler, C.: High resolution distributed atmospheric-hydrological modelling for Alpine catchments., J. Hydrol., 314, 105–124, 2005.
Schulla, J. and Jasper, K.: Model Description WASIM-ETH (Water Balance Simulation Model ETH), ETH-Zurich, Zurich, 2000. Seyoum, M., van Andel, S., Xuan, Y., and Amare, K.:
Pre-cipitation Forecasts for Rainfall Runoff Predictions: A case study in poorly gauged Ribb and Gumara catchments, up-per Blue Nile, Ethiopia, Phys. Chem. Earth, 61–62, 43–51, doi:10.1016/j.pce.2013.05.005, 2013.
Smith, K. T. and Austin, G. L.: Nowcasting precipitation – a pro-posal for a way forward, J. Hydrol., 239, 34–45, 2000.
Westrick, K., Storck, P., and Mass, C.: Description and evaluation of a hydrometeorological forecast system for mountainous wa-tersheds, Weather Forecast, 17, 250–262, 2002.
Wigmosta, M. S., Vail, L. W., and Lettenmaier, D. P.: A distributed hydrology-soil-vegetation model for complex terrain, Water Re-sour. Res., 30, 1665–1679, 1994.
Xuan, Y., Cluckie, I. D., and Wang, Y.: Uncertainty analysis of hydrological ensemble forecasts in a distributed model utilising short-range rainfall prediction, Hydrol. Earth Syst. Sci., 13, 293– 303, doi:10.5194/hess-13-293-2009, 2009.
Yarnal, B., Lakhtakia, M. N., Yu, Z., White, R. A., Pollard, D., Miller, D. A., and Lapenta, W. M.: A linked meteorological and hydrological model system: the Susquehanna River Basin Exper-iment (SRBEX), Global Planet. Change, 25, 149–161, 2000. Zhu, D. and Cluckie, I. D.: A preliminary appraisal of Thurnham
Dual Polarisation Radar in the context of hydrological modelling structure, J. Hydrol. Res., 43, 736–752, 2012.