GID
2, 539–561, 2012Geo-neutrinos
L. Ludhova
Title Page
Abstract Introduction
Conclusions References
Tables Figures
◭ ◮
◭ ◮
Back Close
Full Screen / Esc
Printer-friendly Version Interactive Discussion
Discussion
P
a
per
|
Dis
cussion
P
a
per
|
Discussion
P
a
per
|
Discussio
n
P
a
per
|
Geosci. Instrum. Method. Data Syst. Discuss., 2, 539–561, 2012 www.geosci-instrum-method-data-syst-discuss.net/2/539/2012/ doi:10.5194/gid-2-539-2012
© Author(s) 2012. CC Attribution 3.0 License.
Geoscientiic Instrumentation
Methods and
Data Systems
Discussions
This discussion paper is/has been under review for the journal Geoscientific Instrumentation, Methods and Data Systems (GI). Please refer to the corresponding final paper in GI if available.
Geo-neutrinos
L. Ludhova
Istituto Nazionale di Fisica Nucleare, via Celoria 16, 20133 Milano, Italy Received: 23 July 2012 – Accepted: 24 July 2012 – Published: 3 August 2012 Correspondence to: L. Ludhova ([email protected])
GID
2, 539–561, 2012Geo-neutrinos
L. Ludhova
Title Page
Abstract Introduction
Conclusions References
Tables Figures
◭ ◮
◭ ◮
Back Close
Full Screen / Esc
Printer-friendly Version Interactive Discussion
Discussion
P
a
per
|
Dis
cussion
P
a
per
|
Discussion
P
a
per
|
Discussio
n
P
a
per
|
Abstract
Geo-neutrinos, electron anti-neutrinos produced inβ-decays of naturally occurring ra-dioactive isotopes in the Earth, are a unique direct probe of our planet’s interior. After a brief introduction about the Earth (mostly for physicists) and the very basics about the neutrinos and anti-neutrinos (mostly for geologists), I describe the geo-neutrinos’ 5
properties and the main aims of their study. An overview of the latest experimental re-sults obtained by KamLand and Borexino experiments is provided. A short overview of future perspectives of this new inter-disciplinary field is given.
1 Introduction
The introduction is divided into three parts. First, the structure, composition, and 10
sources of information about the Earth are described. It is a short summary meant mostly for physicists. Secondly, the basic physics of neutrinos and anti-neutrinos, rel-evant for the geo-neutrino studies are described. This part is meant mostly for geolo-gists. The last part of the introduction finally describes the geo-neutrinos, their proper-ties, and the importance of their study.
15
1.1 The Earth (mostly for physicists)
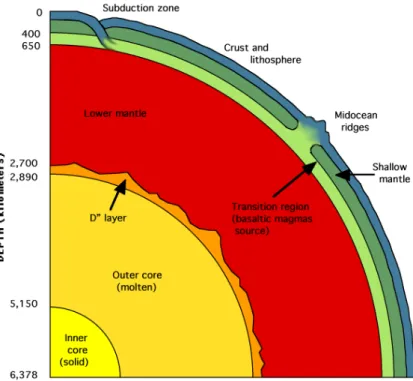
It is assumed that the Earth was created via accretion as an homogeneous object. The metallic core (3500 km radius) was the first to separate from the silicate primor-dial mantle which further differentiated into the current mantle (3000 km thickness) and the crust (5 to 75 km). The Fe-Ni metallic core with up to∼10 % admixture of lighter
20
elements, has a temperature range from 4100 to 5800 K. Its central part, inner core with the radius∼1300 km is solid due to high pressure. The 2200 km thick outer core is liquid and has a key role in the geo-dynamo process generating the Earth’s magnetic field. TheD′′ layer is a core-mantle boundary, a 200 km thick seismic discontinuity of
GID
2, 539–561, 2012Geo-neutrinos
L. Ludhova
Title Page
Abstract Introduction
Conclusions References
Tables Figures
◭ ◮
◭ ◮
Back Close
Full Screen / Esc
Printer-friendly Version Interactive Discussion
Discussion
P
a
per
|
Dis
cussion
P
a
per
|
Discussion
P
a
per
|
Discussio
n
P
a
per
|
3700 K is solid, but viscose on long time scales. It is involved in the convection driving the movement of tectonic plates with a speed of few centimeters per year. A transition zone in the depth of 400–600 km is a seismic discontinuity due to mineral recrystal-lization. The upper mantle contains viscose astenosphere on which are floating the litospheric tectonic plates. These comprise the uppermost, rigid part of the mantle and 5
the crust of two types: oceanic and continental. The continental crust (30 km average thickness) has the most complex history being the most differentiated and heteroge-neous, consisting of igheteroge-neous, metamorphic, and sedimentary rocks. The oceanic crust (5–10 km) is created along the mid-oceanic ridges where the basaltic magma diff eren-tiates from the partially melting mantle. A schematic profile of the Earth structure can 10
be found in Fig. 1.
Information about the Earth’s interior composition has insofar come exclusively from indirect probes. Geophysics, studying the propagation of mechanical waves through the Earth, constrains the density profile and the phase state. Geochemistry has limited sources of direct data as well and develops models of the Earth bulk composition based 15
on indirect information. The deepest drill hole ever made (12 km, Kola, Russia) repre-sents enormous technical difficulties, but is negligible with respect to the Earth radius of ∼6400 km. Some geological processes bring the deep rocks to the surface
(vol-canism, obduction, xenolites ...) but their chemical composition can be altered during the transport and the deep mantle is completely unreachable. Similar trends of relative 20
abundances of chemical elements in meteorites and in the Sun’s photosphere indicate that the Solar system developed from a chemically homogeneous nebula. Assuming these trends for the primordial Earth as well as rock melting trends which produced the current rocks, the Bulk Silicate Earth (BSE) model was developed, describing the com-position of the primitive mantle. The BSE model therefore describes the comcom-position of 25
GID
2, 539–561, 2012Geo-neutrinos
L. Ludhova
Title Page
Abstract Introduction
Conclusions References
Tables Figures
◭ ◮
◭ ◮
Back Close
Full Screen / Esc
Printer-friendly Version Interactive Discussion
Discussion
P
a
per
|
Dis
cussion
P
a
per
|
Discussion
P
a
per
|
Discussio
n
P
a
per
|
et al. (2010). The predictions of the absolute abundances of the long-lived radioactive elements producing geo-neutrinos differ up to a factor of 2–3, while the predictions of their relative proportions are in a much better agreement within 10 %.
The total terrestrial surface heat flux is deduced from the temperature-gradient mea-surements along ∼40 000 drill holes distributed around the world. It is important to
5
note that these drill holes are not distributed homogeneously, they are concentrated mostly on the continental crust, while almost missing in the hottest regions along the mid-ocean ridges. Using these temperature gradient data, geophysical models typi-cally conclude that the present surface heat flux is 47±2 TW (Davies and Davies,
2010). This conventional view has been challenged by an alternative flux estimate of 10
31±1 TW (Hofmeister and Criss, 2004) and other authors predict 44 TW (Pollack et
al., 1993). Such big discrepancies indicate that some systematic errors or model as-sumptions are out of the control.
There are several possible sources contributing to the total terrestrial surface heat flux and the radiogenic heat is generally considered as a main contribution to the total 15
heat budget. The main long-lived radioactive elements producing this radiogenic heat are238U, 232Th, and 40K. The range of the BSE models predicting the Th, U, and K abundances translates to radiogenic heat contributions of 12–30 TW (crust+mantle). Typically, based on geophysical calculations, parameterized convection models of the mantle require higher radiogenic heat contributions (∼70 % of the total heat flux) in
20
order to describe the Earth’s cooling history in terms of a balance of forces between thermal dissipation and mantle viscosity. Consequently, a geochemist’s view of the Earth predicts that its budget of heat producing elements in the BSE are up to a factor of∼3 lower than the models predicted by geophysicists. Thus, the relative contribution
of the radioactive power to the total planetary heat flux is poorly known. No contribution 25
is expected from the core. Thorium and uranium are refractory lithophile elements and contribute equally ∼80 % of the total radiogenic heat production of the Earth, while
GID
2, 539–561, 2012Geo-neutrinos
L. Ludhova
Title Page
Abstract Introduction
Conclusions References
Tables Figures
◭ ◮
◭ ◮
Back Close
Full Screen / Esc
Printer-friendly Version Interactive Discussion
Discussion
P
a
per
|
Dis
cussion
P
a
per
|
Discussion
P
a
per
|
Discussio
n
P
a
per
|
and size, K, Th, and U are quantitatively partitioned into the melt and depleted from the mantle. Thus, the continental crust, has over geologic time, been enriched in these elements and has a sizable fraction (about half) of the planet’s inventory, producing radiogenic power of 7.3±1.2 TW (Rudnick and Gao, 2003). The main unknown
re-main the abundances of the long-lived radioactive elements and the radiogenic heat 5
produced in the mantle.
It is possible that additional heat sources contribute to the total surface heat flux (esti-mated based on the temperature gradient measurements). Such additional heat might originate from accretion, gravitational contraction, latent heat from phase transitions, or from a (rather exotic) nuclear reactor in the core/core-mantle boundary (Herndon, 10
1996) or presence of 40K in the metallic core. It can be concluded, that systematic errors in both geochemical and geophysical models are not very well known and the validity of several assumptions on which they are based is not proven.
1.2 Neutrinos and anti-neutrinos (mostly for geologists)
Neutrinos (ν) and their anti-particles, anti-neutrinos (¯ν), are the fundamental elementary 15
particles belonging to the family of leptons. In contrast to charged leptons (electron, muon, and tau particles with negative electric charge and their positively charged anti-particles), they have no electric charge, so they do not interact via electromagnetic forces. All leptons do not interact via strong interactions. Neutrinos and anti-neutrinos, being neutral leptons, can interact only via weak interactions, making the probability 20
of their interaction along their passage through matter very rare. The so called cross-section of their weak interactions with matter is of the order of 10−45cm2. It means, that neutrinos and anti-neutrinos, once detected, can bring to the observer undisturbed information about the region of their production. The same low probability of interaction makes these particles extremely difficult to detect and often huge multi-ton detectors 25
GID
2, 539–561, 2012Geo-neutrinos
L. Ludhova
Title Page
Abstract Introduction
Conclusions References
Tables Figures
◭ ◮
◭ ◮
Back Close
Full Screen / Esc
Printer-friendly Version Interactive Discussion
Discussion
P
a
per
|
Dis
cussion
P
a
per
|
Discussion
P
a
per
|
Discussio
n
P
a
per
|
Both neutrinos and anti-neutrinos exist in three types, so called flavors: electron, muon, and tau. Each flavor is a linear combination of 3 so called mass eigenstates, labeled simply 1, 2, and 3, each flavor in characteristics proportions of 3 mass eigen-states. The dominant neutrino flux on the Earth comes from the electron flavor neutri-nos produced in the nuclear reactions powering the Sun: the flux of about 1010cm−2
s−1
5
with energies below 11 MeV. Neutrinos are usually detected via elastic scattering off electrons. The dominant sources of electron anti-neutrino fluxes on the Earth surface is the Earth itself (geo-neutrinos with energies below 3.5 MeV) and the nuclear power plants producing anti-neutrinos with energies up to 10 MeV. Geo-neutrinos are electron flavor anti-neutrinos, produced inβ-decays of40K and of several nuclides in the chains 10
of long-lived radioactive isotopes 238U and232Th, which are naturally present in the Earth. Their typical flux on the Earth’s surface is about 106cm−2s−1. Electron flavor anti-neutrinos are detected via the inverse neutronβ-decay reaction,
¯
νe+p →e+ +n, (1)
with a kinematic threshold of 1.806 MeV. 15
Both neutrinos and anti-neutrinos are very light particles and therefore they prop-agate with the velocity very close that of light. During their passage, the neutrino and/or anti-neutrino is represented as a mixtures of 3-mass eigenstates with period-ically evolving proportions. Therefore, the (anti-)neutrino which was produced in an interaction characterizing it as being of a certain flavor can be later on detected as an 20
(anti-)neutrino of the same or of a different flavor. For electron anti-neutrinos, the prob-ability to be detected again as electron anti-neutrinos oscillates according to (Fiorentini et al., 2012):
Pee =cos4θ13
1−sin2(2θ12) sin 2
∆m212L/4E+sin4θ13, (2)
whereθ12andθ13are the mixing parameters, so called mixing angles,∆m 2
12is a diff
er-25
GID
2, 539–561, 2012Geo-neutrinos
L. Ludhova
Title Page
Abstract Introduction
Conclusions References
Tables Figures
◭ ◮
◭ ◮
Back Close
Full Screen / Esc
Printer-friendly Version Interactive Discussion
Discussion
P
a
per
|
Dis
cussion
P
a
per
|
Discussion
P
a
per
|
Discussio
n
P
a
per
|
energy andLis the source-detectors distance. As we can see, for an anti-neutrino of a certain energy, thePee changes with distance L. For a 3 MeV anti-neutrino (about the
end-point of the geo-neutrino’s spectrum and the peak energy of reactor neutrinos), the oscillation length is of∼100 km. Therefore, for geo-neutrinos originating from a
contin-uous source of few thousands of kilometers (the Earth mantle and crust), the oscillation 5
pattern cannot be distinguished on the energy spectrum of detected geo-neutrinos and one can consider only the reduction of the total flux by (1−Pee) withPee=0.551±0.015
(Fiorentini et al., 2012). In the two flavor approximation consideringθ13=0 the Pee is
increased by about 0.009. For considering the spectral shape of reactor anti-neutrinos the oscillation pattern has to be taken into account.
10
1.3 Geo-neutrinos
Geo-neutrinos (geo-¯νe), electron anti-neutrinos (¯νe) are produced in β-decays of 40K and of several nuclides in the chains of long-lived radioactive isotopes238U and232Th, which are naturally present in the Earth:
238U
→ 206Pb+8α +8e−+6 ¯νe+51.7 MeV (3)
15
232Th
→208Pb+6α+4e− +4 ¯νe+42.8 MeV (4)
40K
→ 40Ca+e− +ν¯e+1.32 MeV. (5)
The Earth shines in geo-neutrinos with a flux of about 106cm−2s−1. It is important 20
to note that the ratio of the released radiogenic heat and the geo-neutrino flux is in a well fixed and known ratio. Therefore, it is in principle possible to determine the amount of the radiogenic heat contributing to the total terrestrial surface heat flux (Urey ratio) by measuring the geo-neutrino flux. By measuring the geo-neutrino flux at different locations through the globe, in different geological settings and/or by being able to 25
GID
2, 539–561, 2012Geo-neutrinos
L. Ludhova
Title Page
Abstract Introduction
Conclusions References
Tables Figures
◭ ◮
◭ ◮
Back Close
Full Screen / Esc
Printer-friendly Version Interactive Discussion
Discussion
P
a
per
|
Dis
cussion
P
a
per
|
Discussion
P
a
per
|
Discussio
n
P
a
per
|
– study the distribution of radioactive elements within the Earth, to determine their abundances in the crust and in the mantle;
– determine if there are any radioactive elements in the Earth’s core;
– understand if the mantle composition is homogeneous or not;
– test, validate and discriminate among different BSE models; 5
– exclude or confirm the presence of the geo-reactor in the core;
– determine the so called Urey ratio by measuring the radiogenic heat flux, an im-portant parameter for both geochemistry and geophysics.
– to study the bulk U and Th ratio in the sillicate Earth, an important parameter for geochemistry which could shed light on the process of the Earth’s formation; 10
We can see that geo-neutrinos can be used as a unique direct probe of the Earth inte-rior, not accessible by any other means. All these informations could be important data used as inputs for many geological, geophysical, and geochemical models describing such complex processes as the mantle convection, movement of tectonic plates, geo-dynamo (the process of the generation of the Earth’s magnetic field), the process of 15
the Earth formation etc.
The energy spectrum of geo-neutrinos extends to about 3.3 MeV. They are detected via the inverse neutronβ-decay reaction described above, see Eq. (1) which has a kinematic threshold of 1.806 MeV. The cross section of this interaction as a function of anti-neutrino energy is well known and can be found in (Strumia and Vissani, 2003). 20
Unfortunately, all geo-neutrinos produced in the decay of 40K are below this thresh-old and we are able to detect only the tail of the238U and 232Th geo-neutrinos. Geo-neutrinos from the232Th chain have the end point of their energy spectrum at about 2.25 MeV while those from the238U chain extend up to 3.3 MeV. Ideally, this spectral feature could be used in order to measure the U and Th ratio in the Earth. It is im-25
GID
2, 539–561, 2012Geo-neutrinos
L. Ludhova
Title Page
Abstract Introduction
Conclusions References
Tables Figures
◭ ◮
◭ ◮
Back Close
Full Screen / Esc
Printer-friendly Version Interactive Discussion
Discussion
P
a
per
|
Dis
cussion
P
a
per
|
Discussion
P
a
per
|
Discussio
n
P
a
per
|
better known than their absolute abundances. Therefore, by measuring the absolute abundances of238U and232Th, the absolute abundance of40K can be deduced with a better precision.
2 Latest geo-neutrino experimental results
There are only two running experiments able to measure geo-neutrinos: Borexino 5
placed at Laboratori Nazionali del Gran Sasso in central Italy and KamLand in Kamioka mine in Japan. Both experiments are large volume scintillator detectors placed in the underground in order to shield from cosmic rays. Both experiments detect geo-neutrinos via the inverse beta decay reaction, see Eq. (1) in which anti-neutrino inter-acts with a free proton (hydrogen nucleus) and a positron and a neutron are the reaction 10
products. The positron promptly comes to rest and annihilates emitting two 511 keVγ -rays, yielding a prompt event, with a visible energyEprompt directly correlated with the
energy of incident anti-neutrinoEν¯e:
Eprompt =Eν¯e −0.782 MeV. (6)
The free neutron emitted is typically captured on protons with a mean time ofτ∼200–
15
250 µs, resulting in the emission of a 2.22 MeV de-excitation γ-ray, which provides a coincident delayed event. The characteristic time and spatial coincidence of prompt and delayed events offers a clean signature of ¯νedetection.
The known ¯νe sources are geo-¯νe and reactor ¯νe, while atmospheric and super-nova relic ¯νe’s give a negligible contribution. A detailed analysis of the expected
re-20
actor anti-neutrino rate is necessary for both experiments. The determination of the expected signal from reactor ¯νe’s requires the collection of the detailed information on the time profiles of the thermal power and nuclear fuel composition for nearby re-actors. In Japan there are many nuclear power plants and in addition KamLand de-tector was constructed to measure reactor anti-neutrinos, so it is placed close to the 25
GID
2, 539–561, 2012Geo-neutrinos
L. Ludhova
Title Page
Abstract Introduction
Conclusions References
Tables Figures
◭ ◮
◭ ◮
Back Close
Full Screen / Esc
Printer-friendly Version Interactive Discussion
Discussion
P
a
per
|
Dis
cussion
P
a
per
|
Discussion
P
a
per
|
Discussio
n
P
a
per
|
was quite high in this experiment. To the contrary, in Italy there are no nuclear power plants (the mean reactor distance is of approximately 1000 km), so the reactor anti-neutrino flux in Borexino is up to a factor of 7 lower then in KamLand. In addition, since neutrinos are detected via elastic scattering offelectrons of the scintillator, there is no coincidence tag to may distinguish neutrino interactions from the signals due to 5
the natural radioactivity background. Therefore, the extreme radio-purity is a must for Borexino which in fact succeeded to decrease the internal radioactivity background to unprecedented low levels. Therefore, the other important backgrounds for geo-neutrino measurements, random coincidences and (α,n) interactions in which α’s are mostly from the210Po decay, are strongly suppressed in Borexino. To the contrary, KamLand 10
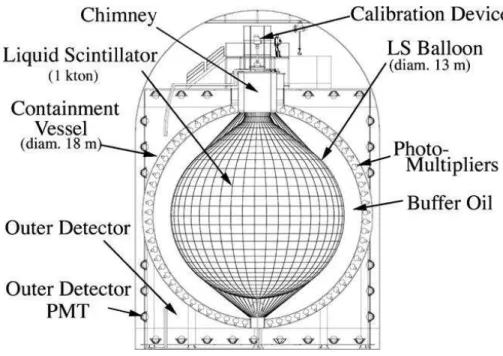
has an advantage of bigger target mass since it features about 1 kton of liquid scin-tillator while Borexino “only” 280 t. For both detectors the scinscin-tillator is placed in the very core of the detector and it is shielded by a layer of the buffer liquid (mineral oil in KamLand and quenched scintillator in Borexino). The scintillator volume is viewed by an array of about 2000 photomultipliers. The scintillation light isotropically propagates 15
from the interaction point outwards. The number of hit photomultipliers is a measure of energy deposited in the detector. The position of the interaction point can be de-termined via the time-of-flight measurement of detected scintillation photons. The time of each trigger is flagged by a gps time stamp. In both detectors the scintillator and buffer containing vessels are further surrounded by a tank filled with ultra-pure water, 20
called Outer Detector. This medium serves both as a passive shield against exter-nal gamma’s and neutrons as well as an active muon Cherenkov detector equipped with about 200 photomultipliers detecting Cherenkov light produced by cosmic muons traversing water. The schemes of the Borexino and KamLand detectors are shown in Figs. 2 and 3, respectively.
25
GID
2, 539–561, 2012Geo-neutrinos
L. Ludhova
Title Page
Abstract Introduction
Conclusions References
Tables Figures
◭ ◮
◭ ◮
Back Close
Full Screen / Esc
Printer-friendly Version Interactive Discussion
Discussion
P
a
per
|
Dis
cussion
P
a
per
|
Discussion
P
a
per
|
Discussio
n
P
a
per
|
complementary and probing different geological settings, and they could shed light on the hypothesis of a homogeneous vs heterogeneous mantle.
The first experimental indication of a geo-neutrino measurement (∼2.5σC.L.) was
reported by the KamLand collaboration (Araki et al., 2005; Abe et al., 2008). The obser-vation of geo-neutrinos at 99.997 % C.L. was then achieved by both Borexino (Bellini 5
et al., 2010) and KamLand (Gando et al., 2011). The observed energy spectra of the prompt candidates are showed in Figs. 4 and 5, respectively.
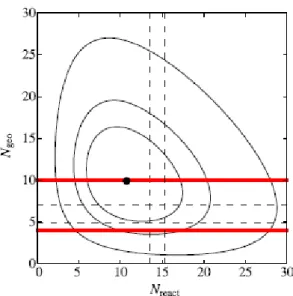
Borexino detected in total 21 candidates in 537.2 days of live time and in the energy range up to the end point of the reactor anti-neutrino spectrum. The result of an unbinned maximum likelihood fit gives the number of detected geo-neutrinos 10
Ngeo=9.9+ 4.1
−3.4 and the number of reactor anti-neutrinosNreact=10.7+ 4.3
−3.4. The Th:U
ra-tio was fixed to the chondritic value of 3.9. The contribura-tion of other background results negligible. Figure 6 shows the allowed regions forNgeo andNreact at 1, 2, and 3σC.L.
These results hint at a higher rate for geo-¯νethan the BSE from Fiorentini et al. (2007)
predicts, but the uncertainty prevents any conclusions.This Borexino measurement re-15
jects the hypothesis of an active geo-reactor of composition as in Herndon (1996) in the Earth’s core with a power above 3 TW at 95 % C.L.
KamLand detected 841 anti-neutrino candidates in the geo-neutrino energy window between 0.9 MeV and 2.6 MeV. The best fit with the Th:U ratio fixed to the chondritic value of 3.9 results in the number of detected geo-neutrinosNgeo=106+
29
−28. The∆χ 2
-20
profile from the fit to the total number of geo-neutrino events is shown in Fig. 7. The best fit is in agreement with the prediction of the BSE model from Enomoto et al. (2007), but other models cannot be firmly excluded yet.
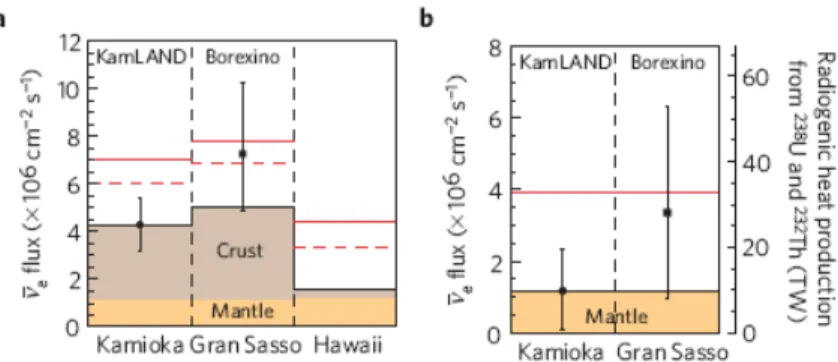
KamLand performed a combined analyses of the KamLand and Borexino results, which are summarized in Fig. 8. They find that decay of238U and232Th together con-25
GID
2, 539–561, 2012Geo-neutrinos
L. Ludhova
Title Page
Abstract Introduction
Conclusions References
Tables Figures
◭ ◮
◭ ◮
Back Close
Full Screen / Esc
Printer-friendly Version Interactive Discussion
Discussion
P
a
per
|
Dis
cussion
P
a
per
|
Discussion
P
a
per
|
Discussio
n
P
a
per
|
primordial heat are contributing to the total heat budget. The fully radiogenic, homoge-neous hypothesis is therefore excluded at 97.2 % C.L.
3 Future perspectives
The two geo-neutrino measurements opened a door towards a new field. It was proved that geo-neutrinos can be detected and that we, as a mankind, have a new tool how to 5
learn new things about our planet. In order to find definitive answers to the questions correlated to the radiogenic heat and abundances of radiogenic elements, more data is needed. Both Borexino and KamLAND will continue to take data in the near future. The earthquake disaster in Japan in March 2012 caused the reactor power plants in Japan to be switched off and some of them will be restarted after a thorough cam-10
paign of tests. The strong reduction of the reactor anti-neutrino background could help in improving the future geo-neutrino measurement of KamLand. In addition it would be important to construct larger volume detectors in order to increase the number of detected geo-neutrinos and so improve the precision of the flux measurement. Results from different detector sites placed at different geological settings is a key point for 15
understanding, for example, if the Earth mantle composition and heat distributions are homogeneous or not. Answers to questions like what is the bulk-Earth U versus Th ratio, is it the same like in meteorites can help in better understanding of the process of Earth formation and the distribution of elements in the Solar system. A new generation of experiments using liquid scintillators is either under the design or even construction 20
process. SNO+at Sudbury mine in Canada (Chen et al., 2006), having 1000 t of target, is in an advanced construction phase. The site is located on an old continental crust and the signal from reactor anti-neutrinos is about twice as the one at Gran Sasso. A new ambitious project to construct a 50 000 t detector is called LENA (Wurm et al., 2012). Among the most probable sites are Pyh ¨asalmi in Finland or Fr ´ejus in France. 25
GID
2, 539–561, 2012Geo-neutrinos
L. Ludhova
Title Page
Abstract Introduction
Conclusions References
Tables Figures
◭ ◮
◭ ◮
Back Close
Full Screen / Esc
Printer-friendly Version Interactive Discussion
Discussion
P
a
per
|
Dis
cussion
P
a
per
|
Discussion
P
a
per
|
Discussio
n
P
a
per
|
few years. The individual contribution of the U and Th geo-neutrino flux could be de-termined as well. An interesting project of 5000 t underwater experiment is HanoHano (Learned, 2007) planned to be placed on the oceanic crust (Hawaii). Due to the thin oceanic crust, the mantle contribution to the total geo-neutrino flux should be domi-nant. Therefore, this measurement would provide the most direct information about the 5
mantle. This forthcoming project together with the currently running experiments could be a starting point of a network useful to understand the Earth heat distribution.
References
Abe, S. et al.: KamLAND collaboration: Measurement of Neutrino Oscillation Parameters with KamLAND, Phys. Rev. Lett., 100, 221803, doi:10.1103/PhysRevLett.100.221803, 2008. 549 10
Alimonti, G. et al.: Borexono collaboration: The Borexino detector at the Laboratori Nazionali del Gran Sasso, Nucl. Instrum. Meth. A, 600, 568–593, 2009. 555
All ´egre, C. J., Poirier, J. P., Humler, E., and Hofmann, A. W.: The chemical composition of the Earth, Earth Planet. Sc. Lett., 134, 515–526, 1995. 541
Anderson, D. L.: The New Theory of the Earth, Cambridge University Press, 400 pp., 1997. 541 15
Araki, T. et al.: KamLAND collaboration: Experimental investigation of geologically produced antineutrinos with KamLAND, Nature, 436, 499–503, 2005. 549
Bellini, G. et al., Borexino collaboration: Observation of geo-neutrinos, 2010, Phys. Lett. B, 687, 299–304, 2010. 549, 557, 559
Chen, M. J.: Geo-neutrinos in SNO+, Earth Moon Planets, 99, 221–228, 2006. 550 20
Davies, J. H. and Davies, D. R.: Earth’s surface heat flux, Solid Earth, 1, 5–24, doi:10.5194/se-1-5-2010, 2010. 542
Enomoto, S., Ohtani, E., Inoue, K., and Suzuki, A.: Neutrino geophysics with KamLAND and future prospects, Earth Planet Sc. Lett., 258, 147–159, 2007. 549, 560
Fiorentini, G., Lissia, M., and Mantovani, F.: Geo-neutrinos and Earth’s interior, Phys. Rep., 25
453, 117–172, doi:10.1016/j.physrep.2007.09.001, 2007. 549, 559
GID
2, 539–561, 2012Geo-neutrinos
L. Ludhova
Title Page
Abstract Introduction
Conclusions References
Tables Figures
◭ ◮
◭ ◮
Back Close
Full Screen / Esc
Printer-friendly Version Interactive Discussion
Discussion
P
a
per
|
Dis
cussion
P
a
per
|
Discussion
P
a
per
|
Discussio
n
P
a
per
|
Gando, A. et al.: KamLAND collaboration: Partial radiogenic heat model for Earth revealed by geoneutrino measurements, Nat. Geosci., 4, 647–651, doi:10.1038/ngeo1205, 2011. 549, 558, 560, 561
Herndon, J. M.: Substructure of the inner core of the Earth, P. Natl. Acad. Sci. USA, 93, 646– 648, 1996. 543
5
Hofmeister, A. M. and Criss, R. E.: Earth’s heat flux revised and linked to chemistry, Tectono-physics, 395, 159–177, 2004. 542
Javoy, M., Kaminski, E., Guyot, F., Andrault, D., Sanloup, C., Moreira, M., Labrosse, S., Jambon, A., Agrinier, P., Davaille, A., and Jaupart, C.: The chemical composition of the Earth: Enstatite chondrite models, Earth Planet. Sc. Lett., 293, 259–268, 2010. 541
10
Learned, J. G., Dye, S. T., and Pakvasa, S.: Hanohano: A Deep Ocean Anti-Neutrino Detector for Unique Neutrino Physics and Geophysics Studies, in: Proceedings of the XII International Workshop on Neutrino Telescopes, 6–9 March 2007, edited by: Baldo Ceolin, M., Venice, 235–269, 2007. 551
Lyubetskaya, T. and Korenaga, J.: Chemical composition of Earth’s primitive mantle and 15
its variance: 2. Implications for global geodynamics, J. Geophys. Res., 112, B03211, doi:10.1029/2005JB004223, 2007. 541
McDonough, W. F. and Sun, S.-S.: The composition of the Earth, Chem. Geol., 120, 223–253, 1995. 541
Palme, H. and O’Neill, H. S. C: Cosmochemical Estimates of Mantle Composition, Treat. 20
Geochem., 2, 1–38, 2003. 541
Pollack, H. N., Hurter, S. J., and Johnson, J. R.: Heat flow from the Earth’s interior: Analysis of the global data set, Rev. Geophys., 31, 267–280, 1993. 542
Rudnick, R. L. and Gao, S.: The Composition of the Continental Crust, Treat. Geochem., 3, 1–64, 2003. 543
25
Strumia, A. and Vissani, F.: Precise quasielastic neutrino/nucleon cross section, Phys. Lett. B, 564, 42–54, 2003. 546
Suekane, F. for the KamLAND collaboration: Review KamLAND, Prog. Part. Nucl. Phys., 57, 106–126, 2006. 556
Turcotte, D. and Schubert, G.: Geodynamics, Cambridge University Press, 472 pp., 2002. 541 30
GID
2, 539–561, 2012Geo-neutrinos
L. Ludhova
Title Page
Abstract Introduction
Conclusions References
Tables Figures
◭ ◮
◭ ◮
Back Close
Full Screen / Esc
Printer-friendly Version Interactive Discussion
Discussion
P
a
per
|
Dis
cussion
P
a
per
|
Discussion
P
a
per
|
Discussio
n
P
a
per
|
P., Hagner, C., Hellgartner, D., Hissa, J., Horiuchi, S., Janka, H. T., Jaupart, C., Jochum, J., Kalliokoski, T., Kayunov, Al, Kuusiniemi, P., Lachenmaier, T., Lazanu, I., Learned, J. G., Lewke, T., Lombardi, P., Lorenz, S., Lubsandorzhiev, B., Ludhova, L., Loo, K., Maalampi, J., Mantovani, F., Marafini, M., Maricic, J., Marrodan Undagoitia, T., McDonough, W. F., Mira-monti, L., Mirizzi, Al., Meindel, Q., Mena, O., M ¨ollenberg, R., Muratova, V., Nahnhauer, R., 5
Nesterenko, D., Novikov, Y. N., Nuijten, G., Oberauer, L., Pakvasa, S., Palomates-Ruiz, S., Pallavicini, M., Pascoli, S., Patzak, T., Peltoniemi, J., Potzel, W., Raiha, T., Raffelt, G. G., Ranucci, G., Razzaque, S., Rammukainen, K., Sarkamo, J., Sinev, V., Spiering, Ch., Stahl, A., THorne, F., Tippmann, M., Tonazzo, A., Trzaska, W. H., Vergados, J. D., Wiesbusch, Ch., and Winter, J.: The next-generation liquid-scintillator neutrino observatory LENA, Astro. 10
GID
2, 539–561, 2012Geo-neutrinos
L. Ludhova
Title Page
Abstract Introduction
Conclusions References
Tables Figures
◭ ◮
◭ ◮
Back Close
Full Screen / Esc
Printer-friendly Version Interactive Discussion
Discussion
P
a
per
|
Dis
cussion
P
a
per
|
Discussion
P
a
per
|
Discussio
n
P
a
per
|
Fig. 1. A schematic profile of the Earth structure (from http://www.homepages.ucl.ac.uk/
GID
2, 539–561, 2012Geo-neutrinos
L. Ludhova
Title Page
Abstract Introduction
Conclusions References
Tables Figures
◭ ◮
◭ ◮
Back Close
Full Screen / Esc
Printer-friendly Version Interactive Discussion
Discussion
P
a
per
|
Dis
cussion
P
a
per
|
Discussion
P
a
per
|
Discussio
n
P
a
per
|
Stainless Steel Sphere External water tank
Nylon Inner Vessel Nylon Outer Vessel
Fiducial volume
Internal PMTs
Scintillator Buffer
Water Ropes
Steel plates for extra shielding
Borexino Detector
Muon PMTs
GID
2, 539–561, 2012Geo-neutrinos
L. Ludhova
Title Page
Abstract Introduction
Conclusions References
Tables Figures
◭ ◮
◭ ◮
Back Close
Full Screen / Esc
Printer-friendly Version Interactive Discussion
Discussion
P
a
per
|
Dis
cussion
P
a
per
|
Discussion
P
a
per
|
Discussio
n
P
a
per
|
GID
2, 539–561, 2012Geo-neutrinos
L. Ludhova
Title Page
Abstract Introduction
Conclusions References
Tables Figures
◭ ◮
◭ ◮
Back Close
Full Screen / Esc
Printer-friendly Version Interactive Discussion
Discussion
P
a
per
|
Dis
cussion
P
a
per
|
Discussion
P
a
per
|
Discussio
n
P
a
per
|
GID
2, 539–561, 2012Geo-neutrinos
L. Ludhova
Title Page
Abstract Introduction
Conclusions References
Tables Figures
◭ ◮
◭ ◮
Back Close
Full Screen / Esc
Printer-friendly Version Interactive Discussion
Discussion
P
a
per
|
Dis
cussion
P
a
per
|
Discussion
P
a
per
|
Discussio
n
P
a
per
|
GID
2, 539–561, 2012Geo-neutrinos
L. Ludhova
Title Page
Abstract Introduction
Conclusions References
Tables Figures
◭ ◮
◭ ◮
Back Close
Full Screen / Esc
Printer-friendly Version Interactive Discussion
Discussion
P
a
per
|
Dis
cussion
P
a
per
|
Discussion
P
a
per
|
Discussio
n
P
a
per
|
GID
2, 539–561, 2012Geo-neutrinos
L. Ludhova
Title Page
Abstract Introduction
Conclusions References
Tables Figures
◭ ◮
◭ ◮
Back Close
Full Screen / Esc
Printer-friendly Version Interactive Discussion
Discussion
P
a
per
|
Dis
cussion
P
a
per
|
Discussion
P
a
per
|
Discussio
n
P
a
per
|
GID
2, 539–561, 2012Geo-neutrinos
L. Ludhova
Title Page
Abstract Introduction
Conclusions References
Tables Figures
◭ ◮
◭ ◮
Back Close
Full Screen / Esc
Printer-friendly Version Interactive Discussion
Discussion
P
a
per
|
Dis
cussion
P
a
per
|
Discussion
P
a
per
|
Discussio
n
P
a
per
|