www.clim-past.net/11/915/2015/ doi:10.5194/cp-11-915-2015
© Author(s) 2015. CC Attribution 3.0 License.
Thermal evolution of the western South Atlantic and the
adjacent continent during Termination 1
C. M. Chiessi1, S. Mulitza2, G. Mollenhauer2,3, J. B. Silva4, J. Groeneveld2, and M. Prange2 1School of Arts, Sciences and Humanities, University of São Paulo, São Paulo, Brazil
2MARUM – Center for Marine Environmental Sciences, University of Bremen, Bremen, Germany
3Alfred Wegener Institute for Polar and Marine Research, Bremerhaven, Germany
4Institute of Geosciences, University of São Paulo, São Paulo, Brazil
Correspondence to:C. M. Chiessi ([email protected])
Received: 6 November 2014 – Published in Clim. Past Discuss.: 15 December 2014 Revised: 22 May 2015 – Accepted: 23 May 2015 – Published: 22 June 2015
Abstract. During Termination 1, millennial-scale weaken-ing events of the Atlantic meridional overturnweaken-ing circula-tion (AMOC) supposedly produced major changes in sea surface temperatures (SSTs) of the western South Atlantic, and in mean air temperatures (MATs) over southeastern South America. It has been suggested, for instance, that the Brazil Current (BC) would strengthen (weaken) and the North Brazil Current (NBC) would weaken (strengthen) dur-ing slowdown (speed-up) events of the AMOC. This anti-phase pattern was claimed to be a necessary response to the decreased North Atlantic heat piracy during periods of weak AMOC. However, the thermal evolution of the west-ern South Atlantic and the adjacent continent is so far largely unknown. Here we address this issue, presenting high-temporal-resolution SST and MAT records from the BC and southeastern South America, respectively. We identify a warming in the western South Atlantic during Heinrich Sta-dial 1 (HS1), which is followed first by a drop and then by increasing temperatures during the Bølling–Allerød, in phase with an existing SST record from the NBC. Additionally, a similar SST evolution is shown by a southernmost eastern South Atlantic record, suggesting a South Atlantic-wide pat-tern in SST evolution during most of Termination 1. Over southeastern South America, our MAT record shows a two-step increase during Termination 1, synchronous with atmo-spheric CO2rise (i.e., during the second half of HS1 and
dur-ing the Younger Dryas), and laggdur-ing abrupt SST changes by several thousand years. This delay corroborates the notion that the long duration of HS1 was fundamental in driving the Earth out of the last glacial.
1 Introduction
The thermal bipolar seesaw describes the warming occur-ring in the Southern Hemisphere due to diminished north-ward heat transport within the Atlantic Ocean when the At-lantic meridional overturning circulation (AMOC) is weak-ened (Mix et al., 1986; Stocker, 1998). This mechanism is particularly efficient for perturbations of the AMOC through positive anomalous freshwater fluxes in the high latitudes of the North Atlantic (Crowley, 1992; Manabe and Stouffer, 1988). Heinrich Stadial 1 (HS1) is probably the best exam-ple for a freshwater-forced AMOC reduction (McManus et al., 2004). It has been suggested that the southward-flowing Brazil Current (BC) might redirect the excess heat to the South Atlantic during times of AMOC slowdown (Crow-ley, 2011; Maier-Reimer et al., 1990). Yet, little is known about the thermal evolution of the western South Atlantic and the adjacent continent during Termination 1. The few available oceanic (e.g., Carlson et al., 2008) and continental (e.g., Bush et al., 2004) records do not show the necessary temporal resolution to appropriately resolve HS1. The lack of high-temporal-resolution records from the BC (Clark et al., 2012), for instance, hinders the evaluation of the previ-ously hypothesized anti-phase behavior between the BC and the North Brazil Current (NBC) during periods of a stalled AMOC (Arz et al., 1999; Schmidt et al., 2012; Chiang et al., 2008).
20 10 0
o
Sea surface temperature ( C)5 15 25
C
M
SSEC
SAC
ACC
8 3
2 1
4
6 7 5
o 40 W o
60 W o
80 W
o 0
o
20
S
o
40
S
o 40 W o
60 W o
80 W
o0
o
20
S
o
40
S
16 12 8 4
o
Mean air temperature ( C)20 24 28
A
B
Figure 1.Location of the marine sediment core investigated in this study and other archives discussed in the text.(a)Annual mean sea surface temperatures (color shading,◦C) (Locarnini et al., 2010), and main annual mean surface ocean currents in the western South Atlantic (black arrows) (Peterson and Stramma, 1991; Stramma and England, 1999). Thin white lines depict the main tributaries of the La Plata River. Numbers indicate the locations of the following archives: (1) GeoB3104-1 and GeoB3117-1 (Arz et al., 1999), (2) GeoB3129-1/3911-3 (Arz et al., 1999; Weldeab et al., 2006), (3) Lake Consuelo (Bush et al., 2004), (4) GeoB3202-1 and GeoB3229-2 (Arz et al., 1999), (5) mean location of the sites described by Behling (2002), (6) SAN76 (Toledo et al., 2007), (7) KNR159-5-36GGC (Carlson et al., 2008), and (8) GeoB6211-2 (this study). ACC: Antarctic Circumpolar Current; BC: Brazil Current; MC: Malvinas Current; NBC: North Brazil Current; SAC: South Atlantic Current; SSEC: Southern South Equatorial Current.(b)Annual mean air temperature (color shading,◦C) (Legates and Willmott, 1990), and annual mean low-level atmospheric circulation (black arrows) (Kalnay et al., 1996). The dashed black line depicts the La Plata River drainage basin. This figure was partly produced with Ocean Data View (Schlitzer, 2014).
derived organic matter, respectively. Our records come from a single marine sediment core collected off southeastern South America under the influence of the BC and span-ning Termination 1 with high temporal resolution. Our data provide evidence for millennial-scale fluctuations in the oceanic temperature record associated with changes in AMOC strength, and a two-step increase in the continental temperature record associated with changes in atmospheric CO2.
2 Regional setting
2.1 Western South Atlantic
Upper level circulation in the subtropical western South At-lantic is dominated by the southward-flowing BC (Fig. 1a) (Peterson and Stramma, 1991; Stramma and England, 1999). The BC originates between 10 and 15◦S from the bifurca-tion of the Southern South Equatorial Current (SSEC). At the bifurcation, the SSEC feeds both the BC and the north-ward flowing NBC (also termed the North Brazil
Undercur-rent (Stramma et al., 1995) between the bifurcation and ca. 5◦S). Around 37◦S the BC converges with the
northward-flowing Malvinas Current (Olson et al., 1988), where both currents turn southeastward and flow offshore as the South Atlantic Current and the northern branch of the Antarctic Cir-cumpolar Current, respectively. The position of the Brazil– Malvinas Confluence varies seasonally between ca. 34 and 40◦S, with a northward penetration of the Malvinas Current during austral winter and early spring and a southward shift of the BC during austral summer and early autumn (Olson et al., 1988). In its uppermost 100 m, the BC transports Trop-ical Water (>20◦C and>36 psu) in the mixed layer, and
from ca. 100 until 600 m the BC transports South Atlantic Central Water (6–20◦C and 34.6–36 psu) in the permanent
25 20 15
10 o
Sea surface temperature ( C)
o
40 W
o
50 W
o
60 W
o
30
S
o
40
S
o
20
S
J F M A M J J A S O N D 0
50 100 150 200 250
-1
Precipitation rate (mm month
)
J F M A M J J A S O N D 0
50 100 150 200 250
-1
Precipitation rate (mm month
)
J F M A M J J A S O N D 0
50 100 150 200 250
-1
Precipitation rate (mm month
)
J F M A M J J A S O N D 0
50 100 150 200 250
3
3
-1
Discharge (10
m
s
)
-1
Precipitation rate (mm month
)
J F M A M J J A S O N D 15
17.5 20 22.5 25 27.5
1
Figure 2.Histograms of the mean annual cycle of precipitation at selected stations in the La Plata River drainage basin (Xie and Arkin, 1997), and mean annual cycle of the La Plata River discharge on the lower right panel (Berbery and Barros, 2002). The color shading in the central panel depicts annual mean sea surface temperatures (◦C) (Locarnini et al., 2010). The number “1” in the central panel indicates the location of marine sediment core GeoB6211-2 (this study). This figure was partly produced with Ocean Data View (Schlitzer, 2014).
of the North Atlantic requires a net transfer of thermocline water from the South Atlantic to the North Atlantic together with net northward fluxes of intermediate and bottom waters (Rintoul, 1991; Peterson and Stramma, 1991). Thus, under modern conditions the NBC receives the larger portion (ca. 12 Sv) of the SSEC volume transport when compared to the BC (ca. 4 Sv) (e.g., Stramma et al., 1990).
2.2 Southeastern South America
Throughout the year atmospheric circulation over southeast-ern South America is dominated by northerly winds (Fig. 1b) (Kalnay et al., 1996). During Southern Hemisphere summer, the South Atlantic convergence zone, a northwest–southeast-oriented convective band along the northeastern boundary of the La Plata River drainage basin (LPRDB), and the South American low-level jet, a northwesterly low-level flow that transports moisture from the western Amazon to the LPRDB, are key features of the South American summer monsoon (Carvalho et al., 2004; Zhou and Lau, 1998). Dur-ing Southern Hemisphere winter, equatorward incursions of mid-latitude cold dry air result in cyclonic storms (Vera et al., 2002). Precipitation in the LPRDB is dominated by South-ern Hemisphere summer rainfall associated with the South American summer monsoon (Fig. 2) (Zhou and Lau, 1998;
Xie and Arkin, 1997). Correspondingly, maximum La Plata River discharge occurs in late Southern Hemisphere summer (Fig. 2). Winter precipitation triggered by occasional north-ward migration of extratropical cyclones results in less pro-nounced rainfall (Vera et al., 2002). Histograms of long-term mean average monthly precipitation display a strong South-ern Hemisphere winter minimum (Fig. 2), particularly in the northwestern sector of the LPRDB, which supplies most of the particulate load of the La Plata River (Depetris and Kempe, 1993; Depetris et al., 2003).
Air temperatures at low atmospheric levels over South America are dominated by the Equator-to-pole thermal gra-dient (Fig. 1b) (Garreaud et al., 2009). The meridional tem-perature profile is rather flat between the Equator and 20◦S,
centered around 20◦C. To the south of 20◦S, temperatures
gradually decrease to 0◦C over the southern tip of the
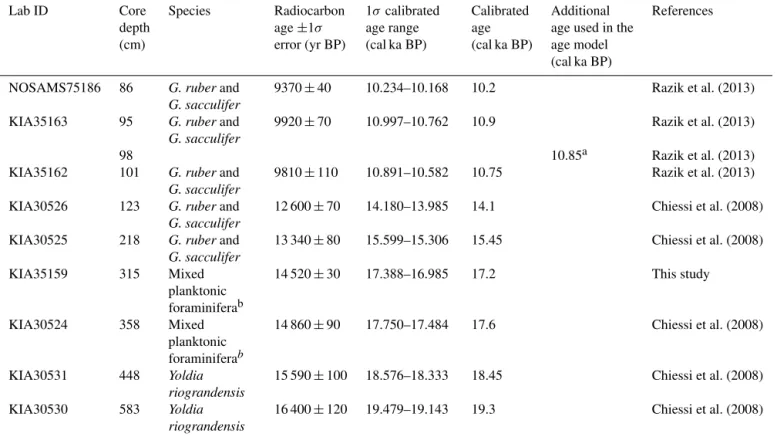
Table 1.Accelerator mass spectrometer radiocarbon ages and calibrated ages used to construct the age model of core GeoB6211-2.
Lab ID Core Species Radiocarbon 1σcalibrated Calibrated Additional References
depth age±1σ age range age age used in the
(cm) error (yr BP) (cal ka BP) (cal ka BP) age model (cal ka BP)
NOSAMS75186 86 G. ruberand G. sacculifer
9370±40 10.234–10.168 10.2 Razik et al. (2013)
KIA35163 95 G. ruberand G. sacculifer
9920±70 10.997–10.762 10.9 Razik et al. (2013)
98 10.85a Razik et al. (2013)
KIA35162 101 G. ruberand G. sacculifer
9810±110 10.891–10.582 10.75 Razik et al. (2013)
KIA30526 123 G. ruberand G. sacculifer
12 600±70 14.180–13.985 14.1 Chiessi et al. (2008)
KIA30525 218 G. ruberand G. sacculifer
13 340±80 15.599–15.306 15.45 Chiessi et al. (2008)
KIA35159 315 Mixed
planktonic foraminiferab
14 520±30 17.388–16.985 17.2 This study
KIA30524 358 Mixed
planktonic foraminiferab
14 860±90 17.750–17.484 17.6 Chiessi et al. (2008)
KIA30531 448 Yoldia
riograndensis
15 590±100 18.576–18.333 18.45 Chiessi et al. (2008)
KIA30530 583 Yoldia
riograndensis
16 400±120 19.479–19.143 19.3 Chiessi et al. (2008)
aInterpolated value between the calibrated radiocarbon ages at 95 and 101 cm depth.bMixed planktonic foraminifera containedG. ruber(pink and white),G. sacculifer,G.
bulloides,G. siphonifera,T. quinqueloba,G. glutinata,G. uvula,G. conglobatus, andG. falconensis.
3 Material and methods
3.1 Marine sediment core
We investigated sediment core GeoB6211-2 (Schulz et al., 2001; Wefer et al., 2001), collected from the continental slope off southeastern South America (32.51◦S, 50.24◦W; 657 m water depth; 774 cm long) (Figs. 1a, 2). The gravity core was raised at the Rio Grande Cone, a major sedimen-tary feature in the western Argentine Basin (Schulz et al., 2001). Because our focus here is Termination 1, we analyzed the section from 86 until 583 cm core depth that corresponds to the period from 10.2 until 19.3 cal ka BP (see Sect. 4.1 below).
One-meter-long sections of core GeoB6211-2 were lon-gitudinally split and described onboard, and then stored at 4◦C. Visual inspection of core GeoB6211-2 does not
pro-vide epro-vidence for depositional or erosive disturbance (We-fer et al., 2001). Onshore, the last deglaciation section of the core was sampled at 1 cm intervals. Samples for radio-carbon, Mg/Ca, and stable oxygen isotope (δ18O) analyses were wet-sieved, oven-dried at 50◦C, and the residues from the 150 µm size sieve were stored in glass vials. Hand pick-ing of foraminiferal tests was performed under a binocular microscope. Samples for lipid analyses were stored at 4◦C until processing.
3.2 Radiocarbon analyses and age model
The age model of core GeoB6211-2 is based on nine accel-erator mass spectrometry radiocarbon ages (Table 1, Fig. 3). Five ages are based on tests of the shallow-dwelling plank-tonic foraminifera Globigerinoides ruber (pink and white) and Globigerinoides sacculifer, while the remaining four ages are based either on mixed planktonic foraminifera (i.e., two ages) or epibenthic bivalve shells (i.e., two ages). Apart from the age obtained at 315 cm core depth, all ages were previously published by Chiessi et al. (2008) and Razik et al. (2013). For each sample, we collected around 10 mg of CaCO3 from the sediment fraction larger than 150 µm.
to the north of the Brazil–Malvinas Confluence, both be-ing places where corrections are typically necessary (Reimer and Reimer, 2001). All ages are indicated as calibrated years before present (cal a BP; present is AD 1950), except where noted otherwise. To construct the age model, we linearly in-terpolated the calibrated ages. For each dated depth we used in the interpolation the mean value from the 1σ range of the calibrated age.
3.3 Mg/Ca analyses and sea surface temperatures
Around 40 tests of G. ruber (white, sensu stricto accord-ing to Wang, 2000) within the size range 250–350 µm were used for Mg/Ca analyses. Analyses were performed at ap-proximately every centimeter between 86 and 123 cm core depth, and at approximately every 4 cm below 123 cm core depth. Different spacing was applied to compensate for the lower sedimentation rates in the section 86–123 cm core depth as compared to the section 123–583 cm core depth (see Sect. 4.1 below). After the tests had been gently crushed, shell fragments were cleaned according to the standard clean-ing protocol for foraminiferal Mg/Ca analyses suggested by Barker et al. (2003) and slightly modified by Groen-eveld and Chiessi (2011). Before dilution, samples were cen-trifuged for 10 min (6000 rpm) to exclude any remaining in-soluble particles from the analyses. Samples were diluted with Seralpur water before analysis with an inductively cou-pled plasma optical emission spectrometer (ICP-OES) (Ag-ilent Technologies, 700 Series with autosampler (ASX-520 Cetac) and micro-nebulizer) at the MARUM – Center for Marine Environmental Sciences, University of Bremen, Ger-many. Instrumental precision of the ICP-OES was monitored by analysis of an in-house standard solution with a Mg/Ca of 2.93 mmol mol−1after every five samples (long-term
stan-dard deviation of 0.026 mmol mol−1 or 0.91 %). To allow inter-laboratory comparison we analyzed an international limestone standard (ECRM752–1) with a reported Mg/Ca of 3.75 mmol mol−1 (Greaves et al., 2008). The long-term average of the ECRM752-1 standard, which was routinely analyzed twice before each batch of 50 samples in every session, is 3.78 mmol mol−1(1σ=0.066 mmol mol−1). An-alytical error based on three replicate measurements of each sample for G. ruberwas 0.14 % (1σ =0.004 mmol mol−1)
for Mg/Ca. To convert Mg/Ca into sea surface tempera-tures (SSTs), we used the calibration equation of Anand et al. (2003) forG. ruber(white) in the size range 250–350 µm with no pre-assumed exponential constant:
Mg/Ca=0.34 exp(0.102×SST). (1)
The propagation of uncertainties typically results in 1σ error of about 1◦C for SST (Mohtadi et al., 2014).
According to Hönisch et al. (2013), the small sensitivity ofG. ruberMg/Ca to changes in salinity (i.e., 3.3±1.7 % per salinity unit) supports the use of this paleotemperature proxy given the range of salinity change in our study area (see Sect. 4.3 below).
We measured Mg/Ca in tests of G. ruber (white) be-cause it dwells in the uppermost water column and reflects mixed-layer conditions (Chiessi et al., 2007). Moreover,G. ruber(white) records austral hemisphere summer conditions at our core site (Fraile et al., 2009a; Lombard et al., 2011), with no significant change in seasonal preference during the Last Glacial Maximum (LGM) (Fraile et al., 2009b). Further-more, the mean Mg/Ca-based SST (i.e., 23.1◦C) obtained
for the uppermost two samples of multicore GeoB6211-1 (collected in the same site as gravity core GeoB6211-2) compares favorably with the modern mean summer SST in the top 20 m of the local water column (i.e., 24.1◦C) and
differs considerably from modern mean winter SST (i.e., 17.8◦C), corroborating the austral hemisphere summer sig-nal recorded byG. ruber(white) (Chiessi et al., 2014).
3.4 Stable oxygen isotope analyses and sea surface salinities
Ten hand-picked tests ofG. ruber(white, sensu stricto ac-cording to Wang, 2000) within the size range 250–350 µm from approximately every centimeter of core GeoB6211-2 were used for δ18O analyses. Results between 448 and 123 cm core depth were previously published by Chiessi et al. (2009). Stable oxygen isotope analyses were performed on a Finnigan MAT 252 mass spectrometer equipped with an automatic carbonate preparation device at MARUM. Iso-topic results were calibrated relative to the Vienna Pee Dee Belemnite (VPDB) using the NBS19 standard. The standard deviation of the laboratory standard was lower than 0.07 ‰ for the measuring period.
To calculate theδ18O of continental-ice-volume-corrected surface sea water (δ18Oivc-ssw), a proxy for relative sea
sur-face salinity, we used (i) ourG. ruberMg/Ca SST andδ18O; (ii) the paleotemperature equation from Mulitza et al. (2003) forG. ruber(white),
SST(◦C)= −4.44×δ18OG.ruber−δ18Osw
+14.20 (2)
(iii) the VPDB to Vienna Standard Mean Ocean Water con-version factor from Hut (1987); (iv) the sea-level curve from Lambeck and Chappell (2001); and (v) the global average change inδ18Oswsince the LGM from Schrag et al. (2002).
The sea-level curve from Lambeck and Chappell (2001) is consistent with the timing of meltwater pulse 1A reported by Deschamps et al. (2012) (14.5 and 14.6 cal ka BP, re-spectively). The propagation of uncertainties typically results in 1σ error of about 0.3 ‰ forδ18Oivc-ssw (Mohtadi et al.,
3.5 Lipid analyses and continental mean air temperatures
Lipid analyses were performed at approximately every 6 cm. Lipid extraction of freeze-dried powdered samples was performed by the use of ultrasonic probes. Ex-tracts were saponified and further separated on Bond Elut SiO2 columns. Polar fractions containing glycerol
di-alkyl glycerol tetraethers (GDGTs) were eluted with 2 mL of MeOH. Prior to analysis by high-performance liquid chromatography/atmospheric pressure chemical ionization mass spectrometry (HPLC/APCI-MS), samples were fil-tered through a 4 µm pore size PTFE filter and dissolved in hexane/isopropanol (99 : 1; v/v). An Agilent 1200 se-ries HPLC/APCI-MS system equipped with a Grace Prevail Cyano column (150 mm×2.1 mm; 3 µm) was used, and sep-aration was achieved in normal phase using the method de-scribed by Hopmans et al. (2004).
Mean air temperature (MAT) was estimated according to Peterse et al. (2012). GDGTs with the following protonated molecular ion masses were quantified: 1022 (Ia), 1020 (Ib), 1018 (Ic); 1036 (IIa), 1034 (IIb), 1032 (IIc); 1050 (IIIa). Ra-tios of peak areas were used to calculate the methylation of branched tetraether (MBT’) and cyclization of branched tetraether (CBT) indices as follows:
MBT’= (Ia+Ib+Ic)
(Ia+Ib+Ic+IIa+IIb+IIc+IIIa), (3)
CBT= −log
Ib+IIb
Ia+IIa
. (4)
Index values calculated using Eqs. (3) and (4) were subse-quently converted to MAT estimates according to
MAT ◦C=
0.81−5.67×CBT+31.0×MBT’. (5)
The production of GDGTs by some uncharacterized micro-bial community in marine sediments has gained recent at-tention (e.g., Zhu et al., 2011). For in situ production in the marine realm, the authors consistently describe an increase in the relative abundance of those GDGTs containing cyclopen-tane moieties (e.g., GDGT Ic and GDGT IIc) as well as a de-crease in the relative abundance of the compounds GDGT Ia and GDGT IIa. We carefully screened our results for a simi-lar behavior.
Temperature estimates are thought to reflect mean annual air temperature (Peterse et al., 2012). During Termination 1, our core site received terrigenous material discharged from the La Plata River drainage basin (LPRDB) as attested by Nd isotopes (Lantzsch et al., 2014). Within the LPRDB, most of the suspended load (Depetris et al., 2003) and particulate organic matter (Depetris and Kempe, 1993) originates from the Bermejo River sub-basin, located in the northwest do-main. The amount of river suspended load corresponds to the discharge (Depetris et al., 2003), and most of the particulate organic matter is soil-derived (Depetris and Kempe, 1993).
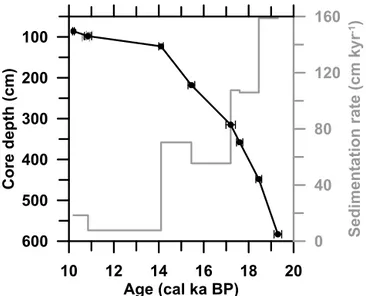
10 12 14 16 18 20
Age (cal ka BP)
0 40 80 120 160
Sedimentation rate (cm kyr
-1)
600 500 400 300 200 100
Core depth (cm)
Figure 3.Age model and sedimentation rates for marine sediment core GeoB6211-2.
Thus, we expect our MAT record to represent a LPRDB-integrated signal with a predominant contribution from its northwestern domain.
4 Results
4.1 Radiocarbon analyses and age model
The investigated section (i.e., 86–583 cm core depth) of core GeoB6211-2 recorded the period between 10.2 and 19.3 cal ka BP (Table 1, Fig. 3). The Marine13 calibration curve produced very similar ages (i.e., difference smaller than 0.2 kyr) when compared to the previously published val-ues (Chiessi et al., 2008; Razik et al., 2013) calibrated with Marine04 (Hughen et al., 2004) and Marine09 (Reimer et al., 2009). Thus, the age model used here is very similar to the age models published by Chiessi et al. (2008) between 19.3 and 14.1 cal ka BP, and by Razik et al. (2013) between 14.1 and 10.2 cal ka BP.
Sedimentation rates of the investigated section of core GeoB6211-2 show a two-step decrease from the LGM to the early Holocene (Fig. 3). Mean values decrease from ca. 160 to 80 cm kyr−1 at 18.45 cal ka BP, and from ca. 80 to
10 cm kyr−1at 14.1 cal ka BP.
4.2 Mg/Ca analyses and sea surface temperatures
Mg/Ca values from G. ruber range from 2.50 to 3.60 mmol mol−1and are equivalent to 19.5 and 23.1◦C,
re-spectively (Fig. 4b). Reconstructed SST increase since the LGM (averaging 20.6◦C) until ca. 18 cal ka BP, remain-ing roughly constant (averagremain-ing 21.9◦C) until ca. 16 cal ka BP. A marked SST drop reaching minimum value (20.4◦C) at ca. 15.5 cal ka BP ends the period of relatively stable SST. A double-peak structure culminating at ca. 15 cal ka BP (23.0◦C) and ca. 13 cal ka BP (22.9◦C) was followed by low temperatures (averaging 21.7◦C) until ca. 11.9 cal ka BP. Af-ter that, the record is characAf-terized by oscillating SST (aver-aging 22.2◦C) SST. Thus, the deglacial SST rise is ca. 1.6◦C.
4.3 Stable oxygen isotope analyses and sea surface salinities
Values of G. ruber δ18O show a stepwise decrease from 0.75 ‰ during the LGM to −0.06 ‰ during the early Holocene (Fig. 4c). There are three major steps, and they oc-curred at ca. 15.5, 13.5 and 11.5 cal ka BP.
Ice-volume-corrected δ18Ossw values range from 0.88 to
2.15 ‰ (Fig. 4d). From the LGM until ca. 14 cal ka BP, tem-poral changes in δ18Oivc-ssw are similar to the changes
de-scribed for SST. After that, the record is marked by roughly constant values (averaging 1.65 ‰) until 11.5 cal ka BP and a rather large variability around 1.47 ‰ during the early Holocene.
4.4 Lipid analyses and continental mean air temperatures
We first examined our data set for indications of marine in-situ production of GDGTs as described in Sect. 3.5, which was not the case (Chiessi et al., 2015b). Then, we calcu-lated continental MAT values that range from 11.5◦C at
18.0 cal ka BP to 14.9◦C at 11.5 cal ka BP (Fig. 4e). Recon-structed MATs show a small gradual increase from the base of the record until ca. 16.5 cal ka BP, when a sharp increase of ca. 1.1◦C takes place. Temperatures remain relatively stable until ca. 12.5 cal ka BP, when an increase of ca. 1.0◦C within ca. 1 kyr was recorded. After that, stable MATs character-ize the record until the early Holocene. Although our MAT record does not cover the LGM, the deglacial MAT rise cal-culated using the averaged value for the oldest and youngest 500-year values of our time series is 2.5◦C. The marked
de-crease in the mean temporal resolution of our MAT record after 14.1 cal ka BP that shifts from ca. 70 to ca. 555 years is worthy of note. This has to be considered while interpreting the MAT trends described for the period after 14.1 cal ka BP.
5 Discussion
The two major decreases in sedimentation rates found in GeoB6211-2 are remarkably synchronous (within age model uncertainties) with outstanding events of sea-level rise re-lated to meltwater pulses that occurred at ca. 19 and 14.6 cal ka BP (Deschamps et al., 2012; Yokoyama et al., 2000). The sea-level drop preceding the LGM shifted the coastline towards our core site. With the resulting narrow continental shelf, the large sediment supply of the La Plata River was directed to the Rio Grande Cone via the La Plata paleo-valley, which was responsible for the high sed-imentation rates typical for the lowermost section of core GeoB6211-2 (Fig. 3) (Chiessi et al., 2008; Lantzsch et al., 2014). The stepwise rise in sea level following the LGM caused abrupt displacements of the coastline towards the continent trapping a large amount of the La Plata River sed-iment supply on the shelf and controlling the stepwise de-crease in sedimentation rate at our site (Chiessi et al., 2008; Lantzsch et al., 2014). Because of the high sedimentation rates (i.e., ca. 100 cm kyr−1) found between the LGM and
14.1 cal ka BP, core GeoB6211-2 is particularly well suited to investigate HS1.
5.1 Sea surface temperatures and salinities of the western South Atlantic during Termination 1
The high SSTs reconstructed for our western South Atlantic site between 18 and 16 cal ka BP as well as the peak in SST at ca. 15 cal ka BP (Fig. 4b) fall within HS1, as defined by Sarnthein et al. (2001). It has been suggested that, during HS1, a strong slowdown of the AMOC (Fig. 5b) (McManus et al., 2004) produced by a positive anomalous freshwater discharge into the high latitudes of the North Atlantic (Bond et al., 1992) would have been responsible for a decreased cross equatorial heat transport in the Atlantic (Fig. 5a) (Bard et al., 2000). Under a sluggish AMOC, the residual heat not transported to the North Atlantic would be trapped in the Southern Hemisphere (Broecker, 1998; Crowley, 1992). Many water-hosing model experiments that show a strong decrease in AMOC strength have suggested that the South-ern Hemisphere warming should have affected the surface layer of the BC (Kageyama et al., 2013; Stouffer et al., 2006). This warming has been suggested for experiments under both LGM and preindustrial boundary conditions. Here we show the first record that corroborates this suggestion (Fig. 4b). We propose that the surface layer of the BC acted as a con-duit and storage volume for part of the heat not transported to the North Atlantic during HS1 that was eventually shunted towards higher latitudes in the South Atlantic (Barker et al., 2009; Anderson et al., 2009). Moreover, the marked drop in our SST record reaching minimum values at ca. 15.5 cal ka BP could be related to an intervening warm spell registered within HS1 in the North Atlantic mid-latitudes (Martrat et al., 2014). We hypothesize that millennial-scale changes
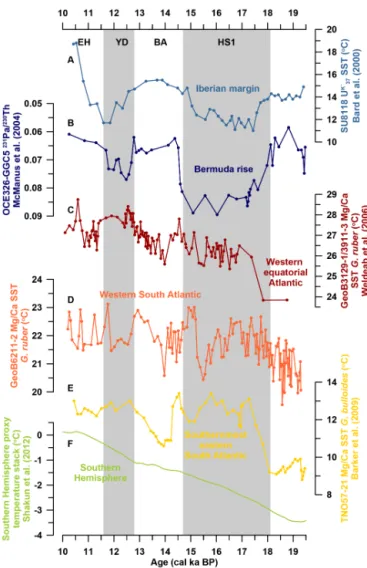
as-Figure 5.Millennial-scale variability of sea surface temperatures of the Brazil Current spanning Termination 1 compared to available circum-Atlantic records.(a)SU8118U37K′-based sea surface tem-peratures (Bard, 2000). (b) OCE326-GGC5231Pa/230Th-based record of the strength of the Atlantic meridional overturning cir-culation (McManus et al., 2004). (c) GeoB3129-1/3911-3 Glo-bigerinoides ruber(white) Mg/Ca-based sea surface temperatures (Weldeab et al., 2006). (d) GeoB6211-2 Globigerinoides ruber (white) Mg/Ca-based sea surface temperatures.(e)TN057-21 Glo-bigerina bulloidesMg/Ca-based sea surface temperatures (Barker et al., 2009). (f) Southern Hemisphere proxy temperature stack (Shakun et al., 2012). Grey vertical bars depict Heinrich Stadial 1 (HS1) (Sarnthein et al., 2001) and the Younger Dryas (YD) (Ras-mussen et al., 2006). BA: Bølling–Allerød; EH: early Holocene.
sociated with Termination 1 (e.g., HS1) affected the BC, and that centennial-scale fluctuations (e.g., internal structure of HS1) were also registered. However, we primarily discuss the millennial-scale events because of age model uncertain-ties.
HS1 (Figs. 1a, 5c) (Weldeab et al., 2006). This core (i.e., GeoB3129-1/3911-3) was collected off NE Brazil at 4.61◦S,
thus under the influence of the NBC. The similarity in SST between both western South Atlantic records goes beyond HS1, and is also valid for the SST drop with minimum values at ca. 14 cal ka BP, and peak SST at ca. 13 cal ka BP, during the Bølling–Allerød (BA). Thus, our SST record (from the BC) together with the SST record from Weldeab et al. (2006) (from the NBC) suggests a generally in-phase behavior of the BC and the NBC regions during HS1 and the BA. This con-tradicts the BC–NBC anti-phase relationship suggested by Arz et al. (1999), at least concerning SST, since we have no proxy to assess current strength.
It is worthy of note that Arz et al. (1999) based their suggestion exclusively on δ18O records of planktonic foraminifera. The more negative excursion in foraminiferal δ18O that those authors reported during HS1 for the cores collected under the influence of the BC (i.e., GeoB3229-2, GeoB3202-1) when compared to the less negative ex-cursion reported for the cores under the influence of the NBC (i.e., GeoB3104-1, GeoB3117-1, GeoB3129-1/3911-3, GeoB3176-1) supported the notion that the sluggish AMOC would have triggered a weakening in the NBC and a strength-ening in the BC (Fig. 1a). This would have been responsible for the low HS1 meridional gradient in theδ18O records pub-lished by Arz et al. (1999).
Based on absolute SST and δ18Oivc-ssw values from the
NBC (Weldeab et al., 2006) and the BC (this study) we are now able to show that the HS1–LGM SST (δ18Oivc-ssw)
anomaly at the NBC site amounts to ca. 2.5◦C and 0.5 ‰,
re-spectively, while at our BC site it is limited to ca. 1.3◦C and
0.3 ‰, respectively. Thus, the NBC showed larger SST and δ18Oivc-sswincreases when compared to the BC during HS1.
Since temperature andδ18Oswinfluence foraminiferalδ18O
in opposite directions, the signal of the stronger warming at the NBC was dampened by the larger increase inδ18Oivc-ssw,
preventing theδ18O signal inG. ruberto change (assuming a 0.2 ‰◦C−1; Mulitza et al., 2003). So far, this stands for no BC–NBC anomaly in foraminiferalδ18O during HS1. Nev-ertheless, our BC site is located ca. 12◦ downstream of the sites investigated by Arz et al. (1999) in the BC. Because the north–south SST gradient in the western South Atlantic was larger than the one forδ18Oivc-sswduring HS1, it is expected
that a larger warming at the southern sites studied by Arz et al. (1999) overprinted theδ18Oivc-ssweffect and produced the
reported negative excursion in foraminiferalδ18O.
Together with the NBC record, our SST reconstruction provides evidence that the western South Atlantic was indeed affected by Northern Hemisphere rapid climate change dur-ing Termination 1. However, the thermal response of the sur-face layer of the western South Atlantic cannot be described as an anti-phase in SST between the BC and the NBC regions (Arz et al., 1999) but rather as a widespread and phase in-crease in SST.
The low SSTs from our record during the Younger Dryas (YD) do not agree with the high temperatures reported by Weldeab et al. (2006) for the same event (Fig. 5c, d). The inconsistency of the YD SST signal in the western South At-lantic may be due to (i) the smaller amplitude of the AMOC slowdown that characterized the YD when compared to HS1 (McManus et al., 2004; Ritz et al., 2013); (ii) the shorter duration of the YD when compared to HS1 (EPICA Com-munity Members, 2006; Rasmussen et al., 2006; Sarnthein et al., 2001) related to the time needed for the South At-lantic to equilibrate after an anomalous freshwater pulse in the high latitudes of the North Atlantic; and (iii) the differ-ent boundary conditions of the YD when compared to those present during HS1 (Clark et al., 2012). Numerical model ex-periments provide key insights into these three non-exclusive possibilities. First, water-hosing model experiments that re-tain an active and relatively strong AMOC indeed showed a much weaker expression of the bipolar seesaw when com-pared to simulations in which the AMOC strongly decreases (Kageyama et al., 2013; Otto-Bliesner and Brady, 2010). Second, the reduction of the AMOC intensity due to fresh-water perturbation increases with increasing duration and amount of the freshwater perturbation (Rind et al., 2001; Prange et al., 2002). Third, freshwater discharge to different geographic regions in the North Atlantic has been shown to trigger different responses in the AMOC (Roche et al., 2009; Otto-Bliesner and Brady, 2010). Thus, all three possibilities may have acted together or independently, producing a dif-ferent response of the western South Atlantic during the YD and HS1.
In addition to the bipolar seesaw, another mechanism that acts to cool the western South Atlantic during specific slow-down events of the AMOC seems to exist. This mecha-nism may be related to a change in the wind field, or more precisely to a weakening of the subtropical high-pressure cell (Prange and Schulz, 2004). Based on climate model sults and proxy records from the Benguela upwelling re-gion, Prange and Schulz (2004) suggested a weakening of the South Atlantic subtropical anticyclone in response to a reduced cross-equatorial Atlantic Ocean heat transport. This would result in a weakening of the BC and its associated heat transport from the tropics and hence a cooling at our core site. Which mechanism dominates (i.e., bipolar seesaw or wind field) may depend on boundary conditions and fresh-water forcing function.
al., 2009). The striking similarity of the three high-temporal-resolution (i.e., 150 years or less between adjacent samples) Mg/Ca-based SST records from the South Atlantic (this study; Weldeab et al., 2006; Barker et al., 2009) not influ-enced by continental margin upwelling (Farmer et al., 2005) or continental freshwater discharge (Weldeab et al., 2007) suggests an emerging South Atlantic-wide pattern in SST evolution during most of Termination 1. Still, the view of the YD as a replicate of HS1 seems not to hold for the western South Atlantic.
Recently, Weber et al. (2014) suggested that Antarctic meltwater pulses may have cooled the upper water col-umn of the South Atlantic. Indeed, our sea surface tem-perature record shows minor (i.e., ca. 0.5◦C) decreases
around the two most prominent events of increased flux of iceberg-rafted debris at the Scotia Sea (a proxy for Antarc-tic meltwater pulses) recorded during Termination 1 (i.e., Antarctic Ice Sheet discharge (AID) event 7 between 16.91 and 15.75 cal ka BP, and event AID6 between 14.86 and 13.94 cal ka BP) (Chiessi et al., 2015a). Thus, Antarctic melt-water pulses may have contributed to the variability in SST from the subtropical domain of the Brazil Current on top of the mechanisms already described.
5.2 Continental mean air temperatures over
southeastern South America during Termination 1
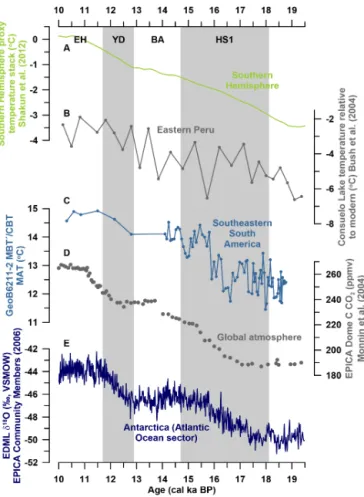
Most of the warming in our step-like structured MAT record takes place during the second half of HS1 and during the YD, but due to the marked decrease in temporal resolution of our MAT record after 14.1 cal ka BP we raise a note of cau-tion while interpreting the temperature rise during the YD (Fig. 4e) (Sarnthein et al., 2001; Rasmussen et al., 2006). Our MAT record is remarkably similar to deglacial rise in atmospheric CO2and Antarctic temperatures (Fig. 6c, d, e)
(EPICA Community Members, 2006; Monnin et al., 2004). The timing of the two pulses of MAT increase in our record (i.e., ca. 16.5 and 12.5 cal ka BP) is synchronous with in-tervals of marked increases in global atmospheric CO2and
Antarctic temperatures, and the periods of relatively stable MAT are also contemporaneous with periods of a small rate of global atmospheric CO2 and Antarctic temperature
in-crease. The two pulses of sharp increase in deglacial atmo-spheric CO2 also occurred simultaneously with increased
upwelling in the Southern Ocean (Anderson et al., 2009). As suggested by Toggweiler et al. (2006), warming around Antarctica may have increased upwelling through a poleward shift in the Southern Westerlies and a corresponding increase in northward Ekman transport of surface waters. Still, the trigger for the changes in upwelling in the Southern Ocean probably resided in the high latitudes of the North Atlantic (i.e., HS1 and the YD) and was transmitted to the Southern Hemisphere via changes in atmospheric (Lee et al., 2011) or oceanic (Knutti et al., 2004) circulation.
Since atmospheric circulation in the LPRDB is dominated by northerly winds (Fig. 1b) (Kalnay et al., 1996), deglacial evolution of continental surface air temperature in the region is also expected to follow the mean warming trend of low-latitude regions in South America. However, high-temporal-resolution and continuous MAT records from tropical South America to the east of the Andes spanning most of Termina-tion 1 are, to our knowledge, still absent, and highlight the uniqueness of our record (Shakun et al., 2012). The pollen-derived temperature record from Lake Consuelo (13.95◦S), eastern Peru, is probably the temperature record with the highest resolution in the region (Fig. 6b) (Bush et al., 2004). The large variability and the low temporal resolution of that record for Termination 1 hampers any detailed correlation to our MAT record (Fig. 6b, c). Thus, a putative link in deglacial surface air temperature evolution between tropical and sub-tropical South America remains elusive.
The general agreement between our MAT record and the deglacial rise in atmospheric CO2 content (Monnin et al.,
2004) (Fig. 6c, d) suggests that greenhouse gas concentra-tions exerted a strong control on the evolution of LPRDB MAT during Termination 1.
Additionally, Antarctic meltwater pulses may have de-creased MAT over southeastern South America (Weber et al., 2014). The modeled cooling amounts to ca. 1.0◦C over the southernmost portion of the LPRDB. Given age model uncer-tainties, the two most prominent events of increased flux of iceberg-rafted debris at the Scotia Sea (i.e., AID7 and AID6; Weber et al., 2014) partially correlate with negative anoma-lies in our MAT record (Chiessi et al., 2015a). Thus, Antarc-tic meltwater pulses may have contributed to the variability in MAT over the LPRDB in addition to changes in atmospheric CO2concentration.
5.3 Combining sea surface temperatures in the western South Atlantic and continental mean air
temperatures on the adjacent continent during Termination 1
Our SST record suggests that the South Atlantic, and the BC more specifically, was of paramount importance for the southward propagation of the thermal bipolar seesaw signal of HS1 (Fig. 5). Indeed, the western South Atlantic was more sensitive to AMOC forcing than lowland South America, which appears to be more susceptible to atmospheric CO2
changes (Figs. 5 and 6). Thus, our SST and MAT records sum up to other lines of evidence supporting the notion that global continental air temperature closely tracked the increase in at-mospheric CO2concentration during Termination 1, and that
variations in the AMOC caused a seesawing of heat between the hemispheres mainly impacting the oceans in the Southern Hemisphere (Shakun et al., 2012).
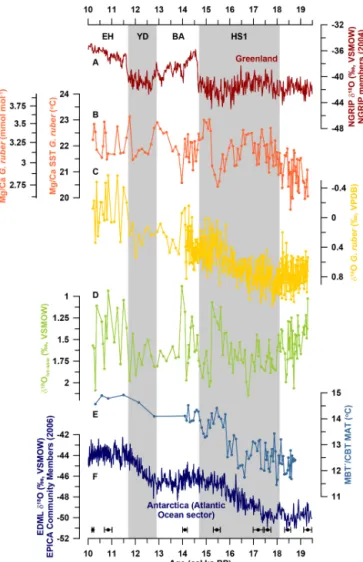
Figure 6.Millennial-scale variability of the mean air temperature of southeastern South America spanning Termination 1 compared to selected available records.(a)Southern Hemisphere proxy tem-perature stack (Shakun et al., 2012). (b) Lake Consuelo pollen-based temperature anomalies relative to modern conditions (Bush et al., 2004). (c)GeoB6211-2 methylation of branched tetraether (MBT’)- and cyclization of branched tetraether (CBT)-based mean air temperature (MAT).(d)EPICA Dome C (Monnin et al., 2004) atmospheric CO2plotted versus its original chronology.(e)EPICA Dronning Maud Land (EPICA Community Members, 2006)δ18O plotted versus its original chronology. Grey vertical bars depict Heinrich Stadial 1 (HS1) (Sarnthein et al., 2001) and the Younger Dryas (YD) (Rasmussen et al., 2006). BA: Bølling–Allerød; EH: early Holocene.
relationship to be established between changes in AMOC strength related to the onset of HS1 and the rise in at-mospheric CO2. According to our records, the decrease in
AMOC strength already impacted SST in the western South Atlantic as early as ca. 19 cal ka BP, while the rise in at-mospheric CO2only affected MAT at ca. 16.5 cal ka BP. As
suggested by Denton et al. (2010), the long duration of last deglaciation stadials was of fundamental importance to pro-duce the necessary large oceanic CO2release via the
South-ern Ocean (Anderson et al., 2009). Thus, increasing North-ern Hemisphere summer insolation alone was insufficient to terminate the last glaciation, and the impact of rising
atmo-spheric CO2was a key factor to complete the last
deglacia-tion (Denton et al., 2010; Shakun et al., 2012).
Interestingly, our SST and MAT records present differ-ent amplitudes in deglacial temperature rise. Similar to the oceanic and continental temperature records reported by Weijers et al. (2007), our oceanic temperatures (i.e., 1.6◦C) showed a smaller amplitude when compared to our continen-tal temperatures (i.e., 2.5◦C) (Fig. 4b, e). The deglacial am-plitude of our SST record is very similar to global compila-tions (i.e., 1–2◦C) (e.g., MARGO Project Members, 2009) and regional reconstructions (i.e., 1–2◦C) (Carlson et al.,
2008; Toledo et al., 2007), even considering the lower tem-poral resolution of those reconstructions when compared to our record.
On the other hand, the deglacial amplitude of our MAT record is remarkably smaller than the amplitude of the few other available continental records for tropical South America, namely 5–7◦C from Behling (2002) and 5–9◦C
from Bush et al. (2004). Nevertheless, pollen-based tropi-cal and subtropitropi-cal temperature reconstructions should be in-terpreted with caution since changes in moisture availability may also impact the recorded signal.
The difference between oceanic and continental warming during Termination 1 reported in this study agrees with cli-mate model simulations that suggest an average continental deglacial warming in the tropics ca. 1.5 times higher than the deglacial warming of the tropical oceans (Otto-Bliesner et al., 2006; Braconnot et al., 2012). The land / sea warming ratio is usually explained through differences in evaporation between land and ocean, and through land-surface feedbacks (Braconnot et al., 2012).
6 Conclusions
Our SST record from the BC in the western South Atlantic shows a marked positive anomaly during HS1. This is the first record that corroborates model suggestions that the sur-face layer of the BC acted as an important conduit and stor-age volume for part of the heat not transported to the North Atlantic under a sluggish AMOC. Thus, the BC was of paramount importance in propagating southwards the ther-mal bipolar seesaw signal of HS1. Moreover, the marked similarity to a SST record from the NBC suggests an in-phase thermal evolution of the BC and the NBC during HS1 (and the BA), contradicting previous assumptions of a BC–NBC anti-phase. Similar changes in SST are not only a pervasive feature of the western South Atlantic but also of the south-ernmost eastern South Atlantic, suggesting a South Atlantic-wide pattern in SST evolution during most of Termination 1. Over southeastern South America, our MAT record shows that most of the deglacial warming occurred during the sec-ond half of HS1 and during the YD. Changes in MAT are re-markably synchronous with atmospheric CO2rise,
con-trol on South American surface temperatures during Termi-nation 1. The ca. 2.5 kyr lag of MAT rise when compared to SST rise after the LGM corroborates the notion that the long duration of HS1 was fundamental to drive the Earth out of the last glacial.
Acknowledgements. We thank M. Segl and S. Pape for their help with the isotope and trace element analyses, respectively. We thank W. Duleba, S. L. Ho and U. Merkel for discussion, and L. Barbara (reviewer), the anonymous reviewer and J. P. Bernal (editor) for constructive comments. Logistic and technical assis-tance was provided by the captain and crew of the R/V Meteor. C. M. Chiessi acknowledges the financial support from FAPESP (grant 2012/17517-3). This study was partially performed during a stay of C. M. Chiessi at the Hanse Institute for Advanced Study in Delmenhorst, Germany. S. Mulitza was funded through the DFG Research Centre/Cluster of Excellence “The Ocean in the Earth System”. Sample material was provided by the GeoB Core Repository at the MARUM – Center for Marine Environmental Sciences, University of Bremen, Germany. The data reported in this paper will be archived in Pangaea (www.pangaea.de).
Edited by: J. P. Bernal
References
Anand, P., Elderfield, H., and Conte, M. H.: Calibration of Mg/Ca thermometry in planktonic foraminifera from a sediment trap time series, Paleoceanography, 18, 1050, doi:10.1029/2002PA000846, 2003.
Anderson, R. F., Ali, S., Bradtmiller, L. I., Nielsen, S. H., Fleisher, M. Q., Anderson, B. E., and Burckle, L. H.: Wind-driven up-welling in the Southern Ocean and the deglacial rise in atmo-spheric CO2, Science, 323, 1443–1448, 2009.
Antonov, J. I., Seidov, D., Boyer, T. P., Locarnini, R. A., Mishonov, A. V., Garcia, H. E., Baranova, O. K., Zweng, M. M., and John-son, D. R.: World Ocean Atlas 2009 Volume 2: Salinity, edited by: Levitus, S., NOAA Atlas NESDIS 69, US Gov. Printing Of-fice, Washington, DC, 184 pp., 2010.
Arz, H. W., Pätzold, J., and Wefer, G.: The deglacial history of the western tropical Atlantic as inferred from high resolution stable isotope records off northeastern Brazil, Earth Planet. Sci. Lett., 167, 105–117, 1999.
Bard, E., Rostek, F., Turon, J.-L., and Gendreau, S.: Hydrological Impact of Heinrich Events in the Subtropical Northeast Atlantic, Science, 289, 1321–1324, 2000.
Barker, S., Greaves, M., and Elderfield, H.: A study of cleaning procedures used for foraminiferal Mg/Ca pa-leothermometry, Geochem. Geophys. Geosys., 4, 8407, doi:10.1029/2003GC000559, 2003.
Barker, S., Diz, P., Vautravers, M. J., Pike, J., Knorr, G., Hall, I. R., and Broecker, W. S.: Interhemispheric Atlantic seesaw response during the last deglaciation, Nature, 457, 1097–1102, 2009. Behling, H.: South and southeast Brazilian grasslands during
Late Quaternary times: a synthesis, Palaeogeogr. Palaeoclimatol. Palaeoecol., 177, 19–27, 2002.
Berbery, E. H. and Barros, V. R.: The Hydrologic Cycle of the La Plata Basin in South America, J. Hydrometeorol., 3, 630–645, 2002.
Bond, G., Heinrich, H., Broecker, W., Labeyrie, L., McManus, J., Andrews, J., Huon, S., Jantschik, R., Clasen, S., Simet, C., Tedesco, K., Klas, M., Bonani, G., and Ivy, S.: Evidence for mas-sive discharges of icebergs into the North Atlantic ocean during the last glacial period, Nature, 360, 245–249, 1992.
Braconnot, P., Harrison, S. P., Kageyama, M., Bartlein, P. J., Masson-Delmotte, V., Abe-Ouchi, A., Otto-Bliesner, B., and Zhao, Y.: Evaluation of climate models using palaeoclimatic data, Nat. Clim. Change, 2, 417–424, 2012.
Broecker, W.: Paleocean circulation during the last deglaciation: A bipolar seesaw?, Paleoceanography, 13, 119–121, 1998. Bush, M. B., Silman, M. R., and Urrego, D. H.: 48 000 years of
climate and forest change in a biodiversity hot spot, Science, 303, 827–829, 2004.
Carlson, A. E., Oppo, D. W., Came, R. E., LeGrande, A. N., Keigwin, L. D., and Curry, W. B.: Subtropical Atlantic salin-ity variabilsalin-ity and Atlantic meridional circulation during the last deglaciation, Geology, 36, 991–994, 2008.
Carvalho, L. M. V., Jones, C., and Liebmann, B.: The South Atlantic Convergence Zone: intensity, form, persistence, and relationships with intraseasonal to interannual activity and extreme rainfall, J. Climate, 17, 88–109, 2004.
Chiang, J. C. H., Cheng, W., and Bitz, C. M.: Fast tele-connections to the tropical Atlantic sector from Atlantic thermohaline adjustment, Geophys. Res. Lett., 35, L07704, doi:10.1029/2008GL033292, 2008.
Chiessi, C. M., Ulrich, S., Mulitza, S., Pätzold, J., and Wefer, G.: Signature of the Brazil-Malvinas Confluence (Argentine Basin) in the isotopic composition of planktonic foraminifera from sur-face sediments, Mar. Micropaleontol., 64, 52–66, 2007. Chiessi, C. M., Mulitza, S., Paul, A., Pätzold, J., Groeneveld, J., and
Wefer, G.: South Atlantic interocean exchange as the trigger for the Bølling warm event, Geology, 36, 919–922, 2008.
Chiessi, C. M., Mulitza, S., Pätzold, J., Wefer, G., and Marengo, J. A.: Possible impact of the Atlantic Multidecadal Oscillation on the South American summer monsoon, Geophys. Res. Lett., 36, L21707, doi:10.1029/2009gl039914, 2009.
Chiessi, C. M., Mulitza, S., Groeneveld, J., Silva, J. B., Campos, M. C., and Gurgel, M. H. C.: Variability of the Brazil Current during the late Holocene, Palaeogeogr. Palaeoclimatol. Palaeoecol., 415, 28–36, 2014.
Chiessi, C. M., Mulitza, S., Mollenhauer, G., Silva, J. B., Groen-eveld, J., Prange, M.: Interactive comment on “Thermal evolution of the western South Atlantic and the adjacent continent during Termination 1” by C. M. Chiessi et al., Clim. Past Discuss., 10, C2489–C2489, 2015a
Chiessi, C. M., Mulitza, S., Mollenhauer, G., Silva, J. B., Groen-eveld, J., and Prange, M.: Interactive comment on “Thermal evo-lution of the western South Atlantic and the adjacent continent during Termination 1” by C. M. Chiessi et al., Clim. Past Dis-cuss., C2490–C2490, 2015b.
F., Johnson, T. C., Lynch-Stieglitz, J., Markgraf, V., McManus, J., Mitrovica, J. X., Moreno, P. I., and Williams, J. W.: Global climate evolution during the last deglaciation, Proc. Natl. Acad. Sci., 109, E1134–E1142, 2012.
Crowley, T. J.: North Atlantic Deep Water cools the southern hemi-sphere, Paleoceanography, 7, 489–497, 1992.
Crowley, T. J.: Proximal trigger for late glacial Antarctic circulation and CO2changes, 19, 70–71, PAGES news, 2011.
Denton, G. H., Anderson, R. F., Toggweiler, J. R., Edwards, R. L., Schaefer, J. M., and Putnam, A. E.: The last glacial termination, Science, 328, 1652–1656, 2010.
Depetris, P. J. and Kempe, S.: Carbon dynamics and sources in the Paraná River, Limnol. Oceanogr., 38, 382–395, 1993.
Depetris, P. J., Probst, J.-L., Pasquini, A. I., and Gaiero, D. M.: The geochemical characteristics of the Paraná River suspended sedi-ment load: an initial assesssedi-ment, Hydrol. Proc., 17, 1267–1277, 2003.
Deschamps, P., Durand, N., Bard, E., Hamelin, B., Camoin, G., Thomas, A. L., Henderson, G. M., Okuno, J., and Yokoyama, Y.: Ice-sheet collapse and sea-level rise at the Bolling warming 14 600 years ago, Nature, 483, 559–564, 2012.
EPICA Community Members: One-to-one coupling of glacial cli-mate variability in Greenland and Antarctica, Nature, 7116, 195– 198, 2006.
Farmer, E. C., deMenocal, P. B., and Marchitto, T. M.: Holocene and deglacial ocean temperature variability in the Benguela upwelling region: Implications for low-latitude atmospheric circulation, Paleoceanography, 20, PA2018, doi:10.1029/2004pa001049, 2005.
Fraile, I., Mulitza, S., and Schulz, M.: Modeling planktonic foraminiferal seasonality: Implications for sea-surface tempera-ture reconstructions, Mar. Micropaleontol., 72, 1–9, 2009a. Fraile, I., Schulz, M., Mulitza, S., Merkel, U., Prange, M., and
Paul, A.: Modeling the seasonal distribution of planktonic foraminifera during the Last Glacial Maximum, Paleoceanogra-phy, 24, PA2216, doi:10.1029/2008PA001686, 2009b.
Garreaud, R. D., Vuille, M., Compagnucci, R., and Marengo, J.: Present-day South American climate, Palaeogeogr. Palaeoclima-tol. Palaeoecol., 281, 180–195, 2009.
Greaves, M., Caillon, N., Rebaubier, H., Bartoli, G., Bohaty, S., Cacho, I., Clarke, L., Cooper, M., Daunt, C., Delaney, M., deMenocal, P., Dutton, A., Eggins, S., Elderfield, H., Garbe-Schoenberg, D., Goddard, E., Green, D., Groeneveld, J., Hast-ings, D., Hathorne, E., Kimoto, K., Klinkhammer, G., Labeyrie, L., Lea, D. W., Marchitto, T., Martínez-Botí, M. A., Mortyn, P. G., Ni, Y., Nuernberg, D., Paradis, G., Pena, L., Quinn, T., Rosenthal, Y., Russell, A., Sagawa, T., Sosdian, S., Stott, L., Tachikawa, K., Tappa, E., Thunell, R., and Wilson, P. A.: Interlaboratory comparison study of calibration standards for foraminiferal Mg/Ca thermometry, Geochemistry, Geophysics, Geosystems, 9, Q08010, doi:10.1029/2008gc001974, 2008. Groeneveld, J. and Chiessi, C. M.: Mg/Ca of Globorotalia
inflata as a recorder of permanent thermocline tempera-tures in the South Atlantic, Paleoceanography, 26, PA2203, doi:10.1029/2010pa001940, 2011.
Hönisch, B., Allen, K. A., Lea, D. W., Spero, H. J., Eggins, S. M., Arbuszewski, J., deMenocal, P., Rosenthal, Y., Russell, A. D., and Elderfield, H.: The influence of salinity on Mg/Ca in planktic foraminifers – Evidence from cultures, core-top
sedi-ments and complementaryδ18O, Geochim. Cosmochim. Acta, 121, 196–213, 2013.
Hopmans, E. C., Weijers, J. W. H., Schefuß, E., Herfort, L., Sin-ninghe Damsté, J. S., and Schouten, S.: A novel proxy for ter-restrial organic matter in sediments based on branched and iso-prenoid tetraether lipids, Earth Planet. Sci. Lett., 224, 107–116, 2004.
Hughen, K. A., Baillie, M. G. L., Bard, E., Beck, J. W., Bertrand, C. J. H., Blackwell, P. G., Buck, C. E., Burr, G. S., Cutler, K. B., Damon, P. E., Edwards, R. L., Fairbanks, R. G., Friedrich, M., Guilderson, T. P., Kromer, B., McCormac, G., Manning, S., Ram-sey, C. B., Reimer, P. J., Reimer, R. W., Remmele, S., Southon, J. R., Stuiver, M., Talamo, S., Taylor, F. W., Van der Plicht, J., and Weyhenmeyer, C. E.: Marine04 marine radiocarbon age calibra-tion, 0–26 cal kyr BP, Radiocarbon, 46, 1059–1086, 2004. Hut, G.: Consultants group meeting on stable isotope reference
samples for geochemical and hydrological investigations, Inter-national Atomic Energy Agency, Vienna, 42 pp., 1987.
Kageyama, M., Merkel, U., Otto-Bliesner, B., Prange, M., Abe-Ouchi, A., Lohmann, G., Ohgaito, R., Roche, D. M., Singarayer, J., Swingedouw, D., and Zhang, X.: Climatic impacts of fresh water hosing under Last Glacial Maximum conditions: a multi-model study, Clim. Past, 9, 935–953, doi:10.5194/cp-9-935-2013, 2013.
Kalnay, E., Kanamitsu, M., Kistler, R., Collins, W., Deaven, D., Gandin, L., Iredell, M., Saha, S., White, G., Woollen, J., Zhu, Y., Leetmaa, A., Reynolds, R., Chelliah, M., Ebisuzaki, W., Higgins, W., Janowiak, J., Mo, K. C., Ropelewski, C., Wang, J., Jenne, R., and Joseph, D.: The NCEP/NCAR 40-Year Reanalysis Project, Bull. Am. Meteorol. Soc., 77, 437–471, 1996.
Knutti, R., Fluckiger, J., Stocker, T. F., and Timmermann, A.: Strong hemispheric coupling of glacial climate through freshwater dis-charge and ocean circulation, Nature, 430, 851–856, 2004. Lambeck, K. and Chappell, J.: Sea level change through the last
glacial cycle, Science, 292, 679–686, 2001.
Lantzsch, H., Hanebuth, T. J. J., Chiessi, C. M., Schwenk, T., and Violante, R. A.: The high-supply, current-dominated continental margin of southeastern South America during the late Quater-nary, Quaternary Res., 81, 339–354, 2014.
Lee, S.-Y., Chiang, J. C. H., Matsumoto, K., and Tokos, K. S.: Southern Ocean wind response to North Atlantic cooling and the rise in atmospheric CO2: Modeling perspective and pa-leoceanographic implications, Paleoceanography, 26, PA1214, doi:10.1029/2010pa002004, 2011.
Legates, D. R. and Willmott, C. J.: Mean seasonal and spatial vari-ability in global surface air temperature, Theor. Appl. Climatol., 41, 11–21, 1990.
Locarnini, R. A., Mishonov, A. V., Antonov, J. I., Boyer, T. P., Gar-cia, H. E., Baranova, O. K., Zweng, M. M., and Johnson, D. R.: World Ocean Atlas 2009, Volume 1: Temperature, edited by: Levitus, S., NOAA Atlas NESDIS 68, U.S. Government Printing Office, Washington, DC, 184 pp., 2010.
Maier-Reimer, E., Mikolajewicz, U., and Crowley, T.: Ocean GCM sensitivity experiment with an open Central American Isthmus, Paleoceanography, 5, 349–366, 1990.
Manabe, S. and Stouffer, R. J.: Two Stable Equilibria of a Coupled Ocean-Atmosphere Model, J. Climate, 1, 841–866, 1988. MARGO Project Members: Constraints on the magnitude and
patterns of ocean cooling at the Last Glacial Maximum, Nat. Geosci., 2, 127–132, 2009.
Martrat, B., Jimenez-Amat, P., Zahn, R., and Grimalt, J. O.: Similar-ities and dissimilarSimilar-ities between the last two deglaciations and in-terglaciations in the North Atlantic region, Quaternary Sci. Rev., 99, 122–134, 2014.
McManus, J. F., Francois, R., Gherardi, J. M., Keigwin, L. D., and Brown-Leger, S.: Collapse and rapid resumption of Atlantic meridional circulation linked to deglacial climate changes, Na-ture, 428, 834–837, 2004.
Mix, A., Ruddiman, W. F., and McIntyre, A.: Late Quaternary pa-leoceanography of the tropical Atlantic, 1: Spatial variability of annual mean sea-surface temperatures, 0-20,000 years B.P., Pa-leoceanography, 1, 43–66, 1986.
Mohtadi, M., Prange, M., Oppo, D.W., De Pol-Holz, R., Merkel, U., Zhang, X., Steinke, S., and Lückge, A.: North Atlantic forcing of tropical Indian Ocean climate, Nature, 509, 76–80, 2014. Monnin, E., Steig, E. J., Siegenthaler, U., Kawamura, K.,
Schwan-der, J., Stauffer, B., Stocker, T. F., Morse, D. L., Barnola, J.-M., Bellier, B., Raynaud, D., and Fischer, H.: Evidence for sub-stantial accumulation rate variability in Antarctica during the Holocene, through synchronization of CO2in the Taylor Dome, Dome C and DML ice cores, Earth Planet. Sci. Lett., 224, 45–54, 2004.
Mulitza, S., Boltovskoy, D., Donner, B., Meggers, H., Paul, A., and Wefer, G.: Temperature:δ18O relationships of planktonic foraminifera collected from surface waters, Palaeogeogr. Palaeo-climatol. Palaeoecol., 202, 143–152, 2003.
NGRIP members: High-resolution record of Northern Hemisphere climate extending into the last interglacial period, Nature, 431, 147–151, 2004.
Olson, D. B., Podestá, G. P., Evans, R. H., and Brown, O. B.: Tem-poral variations in the separation of Brazil and Malvinas Cur-rents, Deep-Sea Res. Pt. A, 35, 1971–1990, 1988.
Otto-Bliesner, B., Brady, E., Clauzet, G., Tomas, R., Levis, S., and Kothavala, Z.: Last Glacial Maximum and Holocene Climate in CCSM3, J. Climate, 19, 2529–2547, 2006.
Otto-Bliesner, B. L. and Brady, E. C.: The sensitivity of the climate response to the magnitude and location of freshwater forcing: last glacial maximum experiments, Quaternary Sci. Rev., 29, 56–73, 2010.
Peterse, F., van der Meer, J., Schouten, S., Weijers, J. W. H., Fierer, N., Jackson, R. B., Kim, J.-H., and Sinninghe Damsté, J. S.: Revised calibration of the MBT–CBT paleotemperature proxy based on branched tetraether membrane lipids in surface soils, Geochim. Cosmochim. Acta, 96, 215–229, 2012.
Peterson, R. G. and Stramma, L.: Upper-level circulation in the South Atlantic Ocean, Prog. Oceanogr., 26, 1–73, 1991. Prange, M. and Schulz, M.: A coastal upwelling seesaw in
the Atlantic Ocean as a result of the closure of the Cen-tral American Seaway, Geophys. Res. Lett., 31, L17207, doi:10.1029/2004gl020073, 2004.
Prange, M., Romanova, V., and Lohmann, G.: The glacial thermo-haline circulation: Stable or unstable?, Geophys. Res. Lett., 29, 2028, doi:10.1029/2002GL015337, 2002.
Rasmussen, S. O., Andersen, K. K., Svensson, A. M., Steffensen, J. P., Vinther, B. M., Clausen, H. B., Siggaard-Andersen, M. L., Johnsen, S. J., Larsen, L. B., Dahl-Jensen, D., Bigler, M., Röthlisberger, R., Fischer, H., Goto-Azuma, K., Hansson, M. E., and Ruth, U.: A new Greenland ice core chronology for the last glacial termination, J. Geophys. Res., 111, D06102, doi:10.1029/2005jd006079, 2006.
Razik, S., Chiessi, C. M., Romero, O. E., and von Dobeneck, T.: Interaction of the South American Monsoon System and the Southern Westerly Wind Belt during the last 14 kyr, Palaeogeogr. Palaeoclimatol. Palaeoecol., 374, 28–40, 2013.
Reimer, P. J. and Reimer, R. W.: A marine reservoir correction database and on-line interface, Radiocarbon, 34, 461–463, 2001. Reimer, P. J., Baillie, M. G. L., Bard, E., Bayliss, A., Beck, J. W., Blackwell, P. G., Ramsey, C. B., Buck, C. E., Burr, G. S., Ed-wards, R. L., Friedrich, M., Grootes, P. M., Guilderson, T. P., Hajdas, I., Heaton, T. J., Hogg, A. G., Hughen, K. A., Kaiser, K. F., Kromer, B., McCormac, F. G., Manning, S. W., Reimer, R. W., Richards, D. A., Southon, J. R., Talamo, S., Turney, C. S. M., Van der Plicht, J., and Weyhenmeyer, C. E.: IntCal09 and Marine09 radiocarbon age calibration curves, 0–50 000 years cal BP, Radiocarbon, 51, 1111–1150, 2009.
Reimer, P. J., Bard, E., Bayliss, A., Beck, J. W., Blackwell, P. G., Ramsey, C. B., Buck, C. E., Cheng, H., Lawrence Edwards, R., Friedrich, M., Grootes, P. M., Guilderson, T. P., Haflidason, H., Hajdas, I., Hatte, C., Heaton, T. J., Hoffmann, D. L., Hogg, A. G., Hughen, K. A., Kaiser, K. F., Kromer, B., Manning, S. W., Niu, M., Reimer, R. W., Richards, D. A., Scott, E. M., Southon, J. R., Staff, R. A., Turney, C. S. M., and Van der Plicht, J.: IntCal13 and Marine13 radiocarbon age calibration curves 0–50 000 years cal BP, Radiocarbon, 55, 1869–1887, 2013.
Rind, D., Russell, G., Schmidt, G., Sheth, S., Collins, D., deMeno-cal, P., and Teller, J.: Effects of glacial meltwater in the GISS coupled atmosphere-ocean model: 2. A bipolar seesaw in At-lantic Deep Water production, J. Geophys. Res.-Atmos., 106, 27355–27365, 2001.
Rintoul, S. R.: South Atlantic interbasin exchange, J. Geophys. Res., 96, 2675–2692, doi:10.1029/90jc02422, 1991.
Ritz, S. P., Stocker, T. F., Grimalt, J. O., Menviel, L., and Timmer-mann, A.: Estimated strength of the Atlantic overturning circula-tion during the last deglaciacircula-tion, Nat. Geosci., 6, 208–212, 2013. Roche, D. M., Wiersma, A. P., and Renssen, H.: A systematic study of the impact of freshwater pulses with respect to different geo-graphical locations, Clim. Dynam., 34, 997–1013, 2009. Sarnthein, M., Stattegger, K., Dreger, D., Erlenkeuser, H., Grootes,
P., Haupt, b., Jung, S., Kiefer, T., Kuhnt, W., Pflaumann, U., Schäfer-Neth, C., Schulz, H., Schulz, M., Seidov, D., Simstich, J., van Kreveld, S., Vogelsang, E., Völker, A., and Weinelt, M.: Fundamental Modes and Abrupt Changes in North Atlantic Cir-culation and Climate over the last 60 ky – Concepts, Reconstruc-tion and Numerical Modeling, in: The Northern North Atlantic: A Changing Environment, edited by: Schäfer, P., Ritzrau, W., Schlüter, M., and Thiede, J., Springer, Berlin, 365–410, 2001. Schefuss, E., Kuhlmann, H., Mollenhauer, G., Prange, M., and
Schlitzer, R.: Ocean Data View, available at: http://odv.awi.de, last access: 31 October 2014.
Schmidt, M. W., Chang, P., Hertzberg, J. E., Them, T. R., Ji, L., and Otto-Bliesner, B. L.: Impact of abrupt deglacial climate change on tropical Atlantic subsurface temperatures, Proc. Natl. Acad. Sci., 109, 14348–14352, 2012.
Schrag, D. P., Adkins, J. F., McIntyre, K., Alexander, J. L., Hodell, D. A., Charles, C. D., and McManus, J. F.: The oxygen isotopic composition of seawater during the Last Glacial Maximum, Qua-ternary Sci. Rev., 21, 331–342, 2002.
Schulz, H. D., Ayres Neto, A., Boetius, A., Enneking, K., Fabian, K., Feseker, T., Funk, J., Gorke, M., Heidersdorf, F., Hensen, C., Heuer, V., Hill, H. G., Hinrichs, S., Kasten, S., Klann, M., Lacerda de Souza, C., Martinez Briao, A., Meyer, S., Mulitza, S., Niebler, H.-S., Ochsenhirt, W.-T., Panteleit, B., Pfeifer, K., Schewe, F., Schwenk, T., Senorans, J. L., Siemer, S., Steinmetz, E., and Wenzhöfer, F.: Report and preliminary results of Meteor Cruise M46/2, Recife (Brazil) – Montevideo (Uruguay), 2 De-cember – 29 DeDe-cember 1999, Fachbereich Geowissenschaften, Universität Bremen, Bremen, 107 pp., 2001.
Shakun, J. D., Clark, P. U., He, F., Marcott, S. A., Mix, A. C., Liu, Z., Otto-Bliesner, B., Schmittner, A., and Bard, E.: Global warm-ing preceded by increaswarm-ing carbon dioxide concentrations durwarm-ing the last deglaciation, Nature, 484, 49–54, 2012.
Stocker, T. F.: The seasaw effect, Science, 282, 61–62, 1998. Stommel, H.: A survey of ocean current theory, Deep-Sea Res., 4,
149–184, 1957.
Stouffer, R. J., Yin, J., Gregory, J. M., Dixon, K. W., Spelman, M. J., Hurlin, W., Weaver, A. J., Eby, M., Flato, G. M., Hasumi, H., Hu, A., Jungclaus, J. H., Kamenkovich, I. V., Levermann, A., Montoya, M., Murakami, S., Nawrath, S., Oka, A., Peltier, W. R., Robitaille, D. Y., Sokolov, A., Vettoretti, G., and Weber, S. L.: Investigating the Causes of the Response of the Thermohaline Circulation to Past and Future Climate Changes, J. Climate, 19, 1365–1387, 2006.
Stramma, L. and England, M.: On the water masses and mean cir-culation of the South Atlantic Ocean, J. Geophys. Res.: Oceans, 104, 20863–20883, 1999.
Stramma, L., Ikeda, Y., and Peterson, R. G.: Geostrophic transport in the Brazil Current region north of 20◦S, Deep-Sea Res., 37, 1875–1886, 1990.
Stramma, L., Fischer, J., and Reppin, J.: The North Brazil Under-current, Deep-Sea Res. Pt. I, 42, 773–795, 1995.
Stuiver, M. and Reimer, P. J.: Extended14C data base and revised CALIB 3.014C age calibration program, Radiocarbon, 35, 215– 230, 1993.
Toggweiler, J. R., Russell, J. L., and Carson, S. R.: Mid-latitude westerlies, atmospheric CO2, and climate change during the ice ages, Paleoceanography, 21, PA2005, doi:10.1029/2005pa001154, 2006.
Toledo, F. A. L., Costa, K. B., and Pivel, M. A. G.: Salinity changes in the western tropical South Atlantic during the last 30 kyr, Glob. Planet. Change, 57, 383–395, 2007.
Vera, C. S., Vigliarolo, P. K., and Berbery, E. H.: Cold Season Synoptic-Scale Waves over Subtropical South America, Month. Weather Rev., 130, 684–699, 2002.
Wang, L.: Isotopic signals in two morphotypes ofGlobigerinoides ruber(white) from the South China Sea: implications for mon-soon climate change during the last glacial cycle, Palaeogeogr. Palaeoclimatol. Palaeoecol., 161, 381–394, 2000.
Weber, M. E., Clark, P. U., Kuhn, G., Timmermann, A., Sprenk, D., Gladstone, R., Zhang, X., Lohmann, G., Menviel, L., Chikamoto, M. O., Friedrich, T., and Ohlwein, C.: Millennial-scale variabil-ity in Antarctic ice-sheet discharge during the last deglaciation, Nature, 510, 134–138, 2014.
Wefer, G., Adegbie, A. T., Böckel, B., Brauner, R., Büttner, U., Diekamp, V., Dillon, M., Dobeneck, T. v., Donner, B., Eberwein, A., Heinecke-Herzog, M., Kim, J. H., Meier, S., Mollenhauer, G., Olguin, H., Romero, O., Schewe, F., Schlemm, V., Schmieder, F., Schünemann, H., Streng, M., and Volbers, A. N. A.: Re-port and preliminary results of Meteor Cruise M46/4, Mar del Plata (Argentina) – Salvador da Bahia (Brazil), 10 February – 13 March 2000, With partial results of Meteor Cruise M46/2., Fachbereich Geowissenschaften, Universität Bremen, Bremen, 136 pp., 2001.
Weijers, J. W., Schefuss, E., Schouten, S., and Sinninghe Damste, J. S.: Coupled thermal and hydrological evolution of tropical Africa over the last deglaciation, Science, 315, 1701–1704, 2007. Weldeab, S., Schneider, R. R., and Kölling, M.: Deglacial sea
sur-face temperature and salinity increase in the western tropical At-lantic in synchrony with high latitude climate instabilities, Earth Planet. Sci. Lett., 241, 699–706, 2006.
Weldeab, S., Lea, D. W., Schneider, R. R., and Andersen, N.: 155 000 years of West African monsoon and ocean thermal evo-lution, Science, 316, 1303–1307, 2007.
Xie, P. and Arkin, P. A.: Global Precipitation: A 17-Year Monthly Analysis Based on Gauge Observations, Satellite Estimates, and Numerical Model Outputs, Bull. Am. Meteorol. Soc., 78, 2539– 2558, 1997.
Yokoyama, Y., Lambeck, K., De Deckker, P., Johnston, P., and Fi-field, L. K.: Timing of the Last Glacial Maximum from observed sea-level minima, Nature, 406, 713–716, 2000.
Zhou, J. and Lau, K. M.: Does a Monsoon Climate Exist over South America?, J. Climate, 11, 1020–1040, 1998.