ACPD
14, 24149–24181, 2014Oxidant production from source-oriented
particulate matter – Part 1
J. G. Charrier et al.
Title Page
Abstract Introduction
Conclusions References
Tables Figures
◭ ◮
◭ ◮
Back Close
Full Screen / Esc
Printer-friendly Version
Interactive Discussion
Discussion
P
a
per
|
Discus
sion
P
a
per
|
Discussion
P
a
per
|
Discussion
P
a
per
|
Atmos. Chem. Phys. Discuss., 14, 24149–24181, 2014 www.atmos-chem-phys-discuss.net/14/24149/2014/ doi:10.5194/acpd-14-24149-2014
© Author(s) 2014. CC Attribution 3.0 License.
This discussion paper is/has been under review for the journal Atmospheric Chemistry and Physics (ACP). Please refer to the corresponding final paper in ACP if available.
Oxidant production from source-oriented
particulate matter – Part 1: Oxidative
potential using the dithiothreitol (DTT)
assay
J. G. Charrier1, N. K. Richards-Henderson1, K. J. Bein2,3, A. S. McFall1,
A. S. Wexler1,2,4, and C. Anastasio1
1
Department of Land, Air and Water Resources, University of California, Davis, CA, USA
2
Air Quality Research Center, University of California, Davis, CA, USA
3
Center for Health and the Environment, University of California, Davis, CA, USA
4
Department of Mechanical and Aeronautical Engineering, University of California, Davis, CA, USA
Received: 5 September 2014 – Accepted: 5 September 2014 – Published: 18 September 2014 Correspondence to: C. Anastasio ([email protected])
ACPD
14, 24149–24181, 2014Oxidant production from source-oriented
particulate matter – Part 1
J. G. Charrier et al.
Title Page
Abstract Introduction
Conclusions References
Tables Figures
◭ ◮
◭ ◮
Back Close
Full Screen / Esc
Printer-friendly Version
Interactive Discussion
Discussion
P
a
per
|
Discus
sion
P
a
per
|
Discussion
P
a
per
|
Discussion
P
a
per
|
Abstract
Recent epidemiological evidence supports the hypothesis that health effects from in-halation of ambient particulate matter (PM) are governed by more than just the mass of PM inhaled. Both specific chemical components and sources have been identified as important contributors to mortality and hospital admissions, even when these end-5
points are unrelated to PM mass. Sources may cause adverse health effects via their ability to produce reactive oxygen species, possibly due to the transition metal content of the PM. Our goal is to quantify the oxidative potential of ambient particle sources collected during two seasons in Fresno, CA using the dithiothreitol (DTT) assay. We collected PM from different sources or source combinations into different ChemVol 10
(CV) samplers in real time using a novel source-oriented sampling technique based on single particle mass spectrometry. We segregated the particles from each source-oriented mixture into two size fractions – ultrafine (Dp≤0.17 µm) and submicron fine
(0.17 µm≤Dp≤1.0 µm) – and measured metals and the rate of DTT loss in each PM extract. We find that the mass-normalized oxidative potential of different sources varies 15
by up to a factor of 8 and that submicron fine PM typically has a larger mass-normalized oxidative potential than ultrafine PM from the same source. Vehicular Emissions, Re-gional Source Mix, Commute Hours, Daytime Mixed Layer and Nighttime Inversion sources exhibit the highest mass-normalized oxidative potential. When we apportion the volume-normalized oxidative potential, which also accounts for the source’s preva-20
lence, cooking sources account for 18–29 % of the total DTT loss while mobile (traffic) sources account for 16–28 %. When we apportion DTT activity for total PM sampled to specific chemical compounds, soluble copper accounts for roughly 50 % of total air-volume-normalized oxidative potential, soluble manganese accounts for 20 %, and other unknown species, likely including quinones and other organics, account for 30 %. 25
ACPD
14, 24149–24181, 2014Oxidant production from source-oriented
particulate matter – Part 1
J. G. Charrier et al.
Title Page
Abstract Introduction
Conclusions References
Tables Figures
◭ ◮
◭ ◮
Back Close
Full Screen / Esc
Printer-friendly Version
Interactive Discussion
Discussion
P
a
per
|
Discus
sion
P
a
per
|
Discussion
P
a
per
|
Discussion
P
a
per
|
1 Introduction
Inhalation of particulate matter (PM) has been linked with adverse health effects and mortality in humans (Dominici et al., 2006; Dockery et al., 1993; Pope et al., 2002; Sun-yer and Basagana, 2001; Breysse et al., 2013). Current regulations to protect health are based on PM mass without regard to source or chemical composition. While PM 5
mass often exhibits good correlations with toxicity (Brunekreef and Holgate, 2002), the true toxicity of PM is likely more complicated than mass alone, and may be de-fined by a combination of properties including number concentration, size, surface area and chemical composition (Valavanidis et al., 2008; Adamson et al., 1999; Costa and Dreher, 1997; Stoeger et al., 2006; Peters et al., 1997; Perrone et al., 2013). These 10
properties determine where PM will deposit in the lungs, how it will interact with the body, and how much oxidative stress it will produce (Churg and Brauer, 1997; Aust et al., 2002; Oberdorster et al., 2005; Yang et al., 2009). Oxidative stress is hypothe-sized as a primary mechanism for adverse health effects from PM (Ercan et al., 2006; Fearon and Faux, 2009; Halliwell and Cross, 1994), and occurs when reactive oxy-15
gen species (ROS) or other oxidants overwhelm the natural defenses of the body (Li et al., 2003a). The picture is further complicated by the fact that PM is a complex mix-ture of particles from various primary and secondary sources with different degrees of atmospheric processing. Aging changes both the size distribution and chemical com-position of PM (Ellison et al., 1999; Maring et al., 2003; Pirrone et al., 2000; Sullivan 20
et al., 2007), making sources harder to differentiate and potentially changing the toxicity of the aerosol over time.
Recent epidemiological studies have identified specific sources or chemical compo-nents of PM that are associated with health outcomes even when PM mass is not, supporting the hypothesis that specific chemicals or sources have higher toxicities. 25
ACPD
14, 24149–24181, 2014Oxidant production from source-oriented
particulate matter – Part 1
J. G. Charrier et al.
Title Page
Abstract Introduction
Conclusions References
Tables Figures
◭ ◮
◭ ◮
Back Close
Full Screen / Esc
Printer-friendly Version
Interactive Discussion
Discussion
P
a
per
|
Discus
sion
P
a
per
|
Discussion
P
a
per
|
Discussion
P
a
per
|
Lall et al. (2011) identified steel and traffic PM in New York as sources associated with respiratory and cardiovascular hospital emissions, respectively. Traffic and residual oil fly ash are two sources commonly associated with adverse effects (Hoffmann et al., 2007; Peters et al., 2004; Dreher et al., 1997), possibly due to the ability of transition metals in the PM to cause oxidative stress (Gasser et al., 2009; Antonini et al., 2004; 5
Aust et al., 2002; Dye et al., 1997; Costa and Dreher, 1997).
One of the primary tools used to identify sources of ambient PM is positive matrix factorization (PMF). PMF can be used in conjunction with in vitro (Zhang et al., 2008) or epidemiological (Lall et al., 2011) data to identify sources that are potentially important for human health. However, PMF requires intensive sampling and chemical analysis to 10
obtain enough data for accurate source identification, which limits its applicability. In this work we use a novel method (Bein et al., 2009) to identify, separate, and collect ambient particles from different sources in real time based on their chemical composition. The method uses single particle mass spectrometry coupled to a suite of particle samplers, which allows for source identification and collection on relatively short (minute) time 15
scales. Each source-oriented mixture of particles is collected on individual substrates as ultrafine (UF,Dp≤0.17 µm) and sub-micron fine (SMF, 0.17 µm≤Dp≤1.0 µm) size
fractions. Using this technique we collected up to 10 sources over two sampling cam-paigns during 2008 and 2009 in Fresno, CA. In this paper we describe the soluble and total metal composition of the PM sources and their oxidative potential as measured by 20
the dithiothreitol (DTT) assay. In our companion manuscript (Part 2), we quantitatively measure the rate of production of two reactive oxygen species, hydroxyl radical (·OH) and hydrogen peroxide (HOOH), from the particles in a cell-free surrogate lung fluid, and compare these results with our DTT outcomes (Richards-Henderson et al., 2014). In this current paper, we examine differences in chemical composition and oxidative 25
ACPD
14, 24149–24181, 2014Oxidant production from source-oriented
particulate matter – Part 1
J. G. Charrier et al.
Title Page
Abstract Introduction
Conclusions References
Tables Figures
◭ ◮
◭ ◮
Back Close
Full Screen / Esc
Printer-friendly Version
Interactive Discussion
Discussion
P
a
per
|
Discus
sion
P
a
per
|
Discussion
P
a
per
|
Discussion
P
a
per
|
2 Methods
2.1 Source-oriented particulate matter
Source-oriented particles (i.e., particles primarily from one source or a mixture of a few sources) were identified and collected using on-line single particle mass spectrometry (RSMS-II) as described in Bein et al. (2009). Downstream of the RSMS-II was a bank 5
of 10 ChemVol (CV) samplers – which are high flow rate (900 Lpm) impactor-based samplers (Demokritou et al., 2002) – for PM collection, with each CV assigned to one source or source combination. Table 1 lists the CVs for each collection season, with corresponding source identification and sampling information. Prior to sample collec-tion, Bein et al. (2009) used a pre-study analysis in Fresno, CA to determine up to 8 10
major nighttime sources based on RSMS-II single particle mass spectra, diurnal trends, and back trajectory analysis. These pre-study data were used to define the combina-tion of spectra that identify a specific source. During later sample colleccombina-tion, when the single particle mass spectrometer observed these spectra, sampling algorithms auto-matically switched the flow of ambient aerosol to the appropriate CV. We continuously 15
collected PM over each sampling period, alternating between CVs as an individual source became dominant during nighttime sampling. If the RSMS-II identified a mixture of sources or an unidentified source, the flow was directed to the “Nighttime Inversion (CV 10)” sampler, which therefore represents a mixture of many different particle ori-gins and histories. Daytime PM were not separated into sources because the lower PM 20
mass and greater turbulent mixing in the boundary layer during the day did not allow for a clear separation of sources (Bein et al., 2009). Daytime PM were segregated into one to three samples based on time-of-day instead of chemical-composition. These samples include “Daytime Mixed Layer (CV9)” for both seasons, along with “Morning Commute (CV8)” and “Evening Commute (CV7)” during winter 2009 (specific sampling 25
ACPD
14, 24149–24181, 2014Oxidant production from source-oriented
particulate matter – Part 1
J. G. Charrier et al.
Title Page
Abstract Introduction
Conclusions References
Tables Figures
◭ ◮
◭ ◮
Back Close
Full Screen / Esc
Printer-friendly Version
Interactive Discussion
Discussion
P
a
per
|
Discus
sion
P
a
per
|
Discussion
P
a
per
|
Discussion
P
a
per
|
Particles were collected in Fresno, CA from 9 November 2008 to 21 October 2008 and from 3 January 2009 to 4 June 2009. To maintain consistency with previous pub-lications (Bein et al., 2009; Bein and Wexler, 2014; Bein et al., 2014; Carosino et al., 2014) these study periods are designated “summer” and “winter”, respectively, which reflect the timing of the corresponding pre-studies for the single particle mass spec-5
trometer, though actual sample collections were in fall and spring. For each CV parti-cles were collected separately as ultrafine (UF,Dp≤0.17 µm) and submicron fine (SMF,
0.17< Dp≤1.0 µm) size fractions. SMF samples were collected on polyurethane foam (PUF, Fisher Scientific) and UF were collected on Teflon-coated glass-fiber filters (Pall TX-40, Fisher Scientific).
10
2.2 PM extraction and sample preparation
The PM extraction is described in detail in Bein and Wexler (2014). Briefly, PM col-lection substrates were extracted via sonication using a sequential series of solvents: Milli-Q (18.2 MΩcm), dichloromethane (HPLC grade, 99.9 %, Acros) then hexane (Op-tima, HPLC grade, 95 %, Fisher). The water fraction was extracted in a separatory fun-15
nel with dichloromethane then hexane to remove organics (especially semi-volatiles). The remaining water fraction was Lyophilized (freeze dried, Labconco FreeZone®) to remove water ice leaving solid PM behind. The four dichloromethane and hexane ex-tracts were dried under nitrogen and the remaining solid from all extractions, including the water fraction, were combined. The solid was stored under vacuum in the freezer 20
(−20◦C) in 10 mL serum bottles with 20 mm rubber split stoppers (Labconco) until
re-constitution. To obtain a total extracted mass for each PM sample, the vacuum sealed serum bottles were gravimetrically weighed before and after PM was added using an A&D model HR-202i semi-micro analytical balance (±0.01 mg). This method extracts
over 90 % of PM from the filters, and retains bulk chemical composition better than 25
ACPD
14, 24149–24181, 2014Oxidant production from source-oriented
particulate matter – Part 1
J. G. Charrier et al.
Title Page
Abstract Introduction
Conclusions References
Tables Figures
◭ ◮
◭ ◮
Back Close
Full Screen / Esc
Printer-friendly Version
Interactive Discussion
Discussion
P
a
per
|
Discus
sion
P
a
per
|
Discussion
P
a
per
|
Discussion
P
a
per
|
To divide each particle sample into smaller aliquots, we first reconstituted the mate-rial in methanol (Fisher, HPLC grade, 99.9 %), sonicated for∼10 min in a bath sonica-tor (Branson model 8510, Bransonic®), and split the suspension into 8 mL amber glass (Thermo Scientific) vials for DTT analysis. Methanol in each vial was evaporated and the resulting solids were stored in the dark at−20◦C until the day of each experiment.
5
2.3 Dithiothreitol assay
Dithiothreitol (DTT) is commonly used to measure the oxidative potential of PM (Cho et al., 2005; Charrier and Anastasio, 2012). This method measures the rate of loss of 100 µM DTT at 37◦C upon incubation with PM. The magnitude of the rate of DTT loss is proportional to the oxidative potential of the PM. We used DTT analysis meth-10
ods identical to Charrier and Anastasio (2012). We warm the PM sample of known mass (Table S2 in the Supplement) for 2 min in a 7.0 mL amber glass vial. We start the reaction by adding 100 µM DTT in 0.10 M phosphate buffer (77.8 mM Na2H2PO4 and 22.2 mM KH2PO4, pH 7.4; Chelex-treated) and measure the concentration of DTT over time to calculate the linear rate of DTT loss. Each experiment includes a solu-15
tion blank and positive control (0.50 µM Cu(II)SO4) to ensure reproducibility from day to day: our average (±1σ,n=25) blank is 0.19±0.05 µM DTT min−1 and our average blank-corrected positive control is 0.76±0.05 µM DTT min−1. Each PM sample and fil-ter blank is analyzed in triplicate. All sample rates are corrected by their daily solution blank and average filter blank (which was already solution-blank corrected). The final 20
DTT rate for a given size fraction of source-oriented mixture (i.e., CV) is reported as a PM-mass-normalized rate (pmols DTT min−1µg PM−1) according to:
Mass-normalized DTT rate=Blank corrected rate of loss (pmols DTT min
−1 )
ACPD
14, 24149–24181, 2014Oxidant production from source-oriented
particulate matter – Part 1
J. G. Charrier et al.
Title Page
Abstract Introduction
Conclusions References
Tables Figures
◭ ◮
◭ ◮
Back Close
Full Screen / Esc
Printer-friendly Version
Interactive Discussion
Discussion
P
a
per
|
Discus
sion
P
a
per
|
Discussion
P
a
per
|
Discussion
P
a
per
|
We also calculate the air-volume-normalized rate for a given season and size fraction (pmols DTT min−1m−3of air sampled) according to:
Air-volume-normalized DTT rate=
X([Mass-normalized DTT rate CVi]·[total mass CVi(µg)])
Total air volume for that season (m3) (2) 5
where the numerator term is summed over each source-oriented mixture i and the total air volume collected is 41 568 m3for summer and 40 029 m3 for winter. The error of each sample includes the standard deviation of replicates (n=2–3), the error of mass in the sample (Supplement, Table S2), and propagated error of the filter blank (n=3–5).
10
2.4 Transition metal analysis
Soluble metals were measured by extracting the PM solid in acid-washed PTFE con-tainers containing 5.0 mL of a surrogate lung fluid (SLF). The SLF is composed of PBS (114 mM NaCl (A.C.S., Fisher), 2.2 mM KH2PO4 (A.C.S., 99 %, Fisher), and 7.8 mM Na2HPO4(A.C.S., Fisher) at pH 7.4 that is Chelex-treated to remove transition metals 15
(Charrier and Anastasio, 2012)) and four anti-oxidants (200 µM ascorbic acid (99 %, Fluka), 300 µM citric acid (99.7 %, Sigma Aldrich), 100 µM glutathione (98 %, Sigma Aldrich) and 100 µM uric acid (A.C.S., Sigma Aldrich)). After 1.5 or 24 h of incubation on a wrist-action shake table, 400 µL of the PM extract was filtered (0.22 µm, PTFE syringe filter, Tisch Scientific) into a 15 mL acid-washed polypropylene centrifuge vial 20
(Fisher Scientific) containing 3.6 mL of 3 % nitric acid (Optima, Fisher Scientific) and then refrigerated until analysis. Samples were analyzed for Ba, Cd, Co, Cr, Cu, Fe, Mn, Mo, Ni, Pb, V, and Zn by ICP-MS (Agilent 7500 CE); further details of ICP-MS analysis along with total metals analysis are given in the Sect. S3 in the Supplement. Soluble metal concentrations were corrected for the metal concentration in the solution 25
calcu-ACPD
14, 24149–24181, 2014Oxidant production from source-oriented
particulate matter – Part 1
J. G. Charrier et al.
Title Page
Abstract Introduction
Conclusions References
Tables Figures
◭ ◮
◭ ◮
Back Close
Full Screen / Esc
Printer-friendly Version
Interactive Discussion
Discussion
P
a
per
|
Discus
sion
P
a
per
|
Discussion
P
a
per
|
Discussion
P
a
per
|
lated from the variance between replicates and the propagated error of the solution and field blanks.
Conditions of the DTT assay differ from the SLF conditions under which the PM was extracted for metals analysis, i.e., temperature and the presence of antioxidants. Since these factors may affect soluble metal concentrations in the extract, we compared met-5
als content in separate SLF and DTT extracts for 12 samples. We found very good agreement between the two techniques, except that Fe was sometimes higher in the SLF than DTT assay (Supplement, Sect. S1), possibly because SLF contains citrate, which solubilizes particulate Fe (Aust et al., 2002). Although our soluble Fe concen-trations in SLF are likely upper-bound estimates of the amounts in the DTT assay, Fe 10
is a relatively weak oxidant for DTT (Charrier and Anastasio, 2012) and is a negligible contributor to DTT loss in our Fresno source-oriented samples, as we describe later.
3 Results and discussion
3.1 Sample characteristics
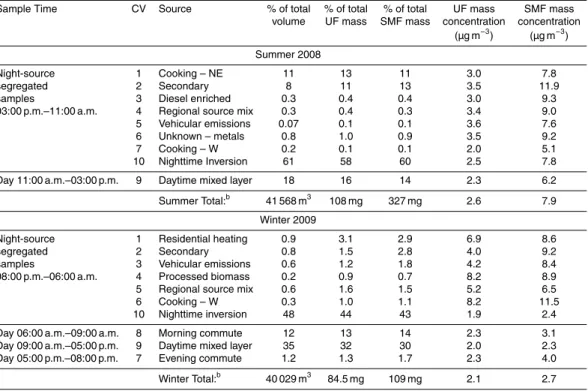
Table 1 summarizes the sampling characteristics and source identifications for each 15
CV. Detailed source identification information can be found in Bein et al. (2009, 2014). Briefly, sources were identified based on chemical composition measured by the single-particle mass spectrometer, the temporal pattern of the source, and wind roses indi-cating the direction of the source. In addition to the timed daytime CVs, seven other sources were identified in summer and six in winter. Two distinct cooking sources were 20
identified: “Cooking – NE (CV1)” is from the northeast, characterized by a high K con-tent, while “Cooking – W (CV6 or CV7)” comes from the west and is characterized by K and mixed Na/K particles. In summer the “Unknown – Metals (CV 6)” source is of unknown origin and was identified based on high concentrations of metals, especially Zn and Pb (Bein et al., 2014).
ACPD
14, 24149–24181, 2014Oxidant production from source-oriented
particulate matter – Part 1
J. G. Charrier et al.
Title Page
Abstract Introduction
Conclusions References
Tables Figures
◭ ◮
◭ ◮
Back Close
Full Screen / Esc
Printer-friendly Version
Interactive Discussion
Discussion
P
a
per
|
Discus
sion
P
a
per
|
Discussion
P
a
per
|
Discussion
P
a
per
|
The volume and mass of the collected PM for each sample varies widely depending on how often a source was dominant. During most nights, no single dominant source was identified, and sampling was directed to “Nighttime Inversion (CV10)” which ac-counts for 40–60 % of PM mass in each season (Table 1). The difference in the percent of total mass attributed to “Nighttime Inversion (CV 10)” between seasons is partially 5
driven by different sampling times: nighttime sampling was 18 h per day during summer and 10 h per day during winter (Table 1). The total air volume and total UF mass con-centration are similar between seasons, approximately 40 000 m3 and ∼80–100 mg, respectively. In contrast, the total SMF mass collected is three times larger in summer than in winter. In summer, UF mass concentrations for the CVs are relatively similar 10
(2.0–3.6 µg m−3), while there is more variability in mass concentrations for PM sources in the other seasons and sizes: 5.1–11.9 µg m−3 for SMF summer, 1.9–8.2 µg m−3 for UF in winter, and 2.3–11.5 µg m−3for SMF in winter (Table 1).
3.2 Metals composition by CV
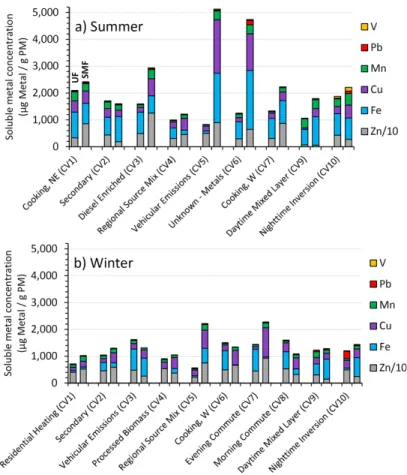
Figure 1 shows the soluble metals content for each source, season, and size frac-15
tion in units of µg metal per gram of PM; total metals are in Fig. S2 in the Sup-plement. Ambient concentrations (ng m−3) of total and soluble metals are summa-rized by season and size fraction in Table S1 in the Supplement. The median sol-uble metals concentrations are at or below median levels from other regions of the US (Charrier and Anastasio, 2012). The general trend in relative abundance follows 20
Zn≫Ba∼Fe>Cu∼Mn>Ni>Pb∼V∼Cr>Cd∼Co. On average, Zn, Ba, Fe, Cu
and Mn account for 66, 11, 10, 5.6, and 3.0 % by mass of the all measured soluble metals, respectively, while other metals each account for less than 3 %. In the total metals data Fe is slightly more important, accounting for 20 % of the total on average, while Zn still dominates with an average of 57 % of the total. Total and soluble metals 25
ACPD
14, 24149–24181, 2014Oxidant production from source-oriented
particulate matter – Part 1
J. G. Charrier et al.
Title Page
Abstract Introduction
Conclusions References
Tables Figures
◭ ◮
◭ ◮
Back Close
Full Screen / Esc
Printer-friendly Version
Interactive Discussion
Discussion
P
a
per
|
Discus
sion
P
a
per
|
Discussion
P
a
per
|
Discussion
P
a
per
|
(median solubility of 27 %). A large percent of each particulate metal is soluble, with an average of approximately 100 % for all species besides Fe, which has an average solubility of 29 %. Metal solubility in ambient PM depends on a number of factors in-cluding pH, ligands, particle size, morphology, and extraction technique. A large range of metal solubilities in ambient PM have been reported (Connell et al., 2006). However, 5
it is generally accepted that Fe solubility in ambient PM is low with reports ranging from<1 % to 6 % solubility (Costa and Dreher, 1997; Upadhyay et al., 2011; Connell et al., 2006). The generally high metal solubilities in the source-oriented particles might be due to the extraction procedure used to remove PM from their substrates required a number of analytical steps which may have changed some properties of the PM, e.g. 10
sonication of particles may have preferentially removed soluble metals, and left some fraction of insoluble metals on the filter.
In general, the soluble metals content in µg metal g−1 PM is similar for the two size fractions of a given source. Notable exceptions are “Diesel Enriched (CV 3)”, “Vehicular Emissions (CV 5)”, and “Unknown – Metals (CV 6)” in summer and “Regional Source 15
Mix (CV 5)” in winter, all of which have a higher concentration of metals in the SMF size fraction compared to the UF, especially for Fe, Cu and Mn.
3.3 Mass-normalized oxidative potential
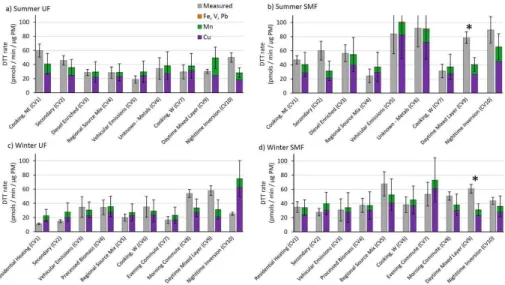
We start by examining the rate of DTT loss for each source normalized by PM mass (Eq. 1), which is a measure of the intrinsic oxidative potential of each source. Figure 2 20
shows that, for a given source, the submicron fine particles (SMF) are generally more reactive than the accompanying ultrafine (UF) particles: for approximately half of the PM sources the SMF reactivity is a factor of 2 larger than that for the UF fraction. This higher reactivity of the submicron fine particles is in contrast to past results, where ultrafine particles (typically Dp<0.1 µm) are generally reported to be more reactive 25
ACPD
14, 24149–24181, 2014Oxidant production from source-oriented
particulate matter – Part 1
J. G. Charrier et al.
Title Page
Abstract Introduction
Conclusions References
Tables Figures
◭ ◮
◭ ◮
Back Close
Full Screen / Esc
Printer-friendly Version
Interactive Discussion
Discussion
P
a
per
|
Discus
sion
P
a
per
|
Discussion
P
a
per
|
Discussion
P
a
per
|
Thus this difference in the mass-normalized oxidative potential between SMF and UF particles might reflect differences in sampling site.
Across both seasons, we observe a range of DTT rates for both UF and SMF PM, with values of 11–60 and 24–92 pmols DTT min−1µg PM−1, respectively; i.e., the mass-normalized oxidative potential of different sources varies by up to a factor of 5.5 for UF 5
and 3.8 for SMF particles. Our mass-normalized rates of DTT loss are similar to those reported in the literature (restricted to those studies using the same DTT method), which range from 5.0 to 170 pmol DTT min−1µg PM−1(Verma et al., 2009; Ntziachristos et al., 2007; De Vizcaya-Ruiz et al., 2006; Verma et al., 2012).
We also calculated the overall oxidative potential for each size fraction in each of 10
the two seasons. This metric sums the mass-normalized oxidative potential of each particle type, weighted by the mass of that PM collected:
Mass Weighted Oxidative Potential=X(Fi,k×DTTi,k) (3)
wherej refers to season (summer or winter),k refers to size fraction (UF or SMF),F
15
is the fraction of total mass collected (Table 1) and DTT is the mass-normalized ox-idative potential (Fig. 2, bars). If we consider each season across both size fractions (i.e., summing overk in Eq. 3), the overall oxidative potentials for summer and winter PM1.0are 71±9 and 45±2 pmols DTT min−1µg−1PM, respectively. Thus, the average
mass-normalized oxidative potential of summer PM is 60 % higher than that of winter 20
for our study periods. Broken down by season and size fraction, the weighted averages are 79±12 and 47±4 pmols DTT min−1µg−1 PM for summer SMF and UF size
frac-tions, respectively, and 49±3 and 39±3 pmols DTT min−1µg−1PM for winter SMF and UF, respectively; these values are plotted as lines in Fig. 2. Thus the overall oxidative potential of SMF PM is higher than UF in both seasons, by 68 % in summer and 26 % 25
ACPD
14, 24149–24181, 2014Oxidant production from source-oriented
particulate matter – Part 1
J. G. Charrier et al.
Title Page
Abstract Introduction
Conclusions References
Tables Figures
◭ ◮
◭ ◮
Back Close
Full Screen / Esc
Printer-friendly Version
Interactive Discussion
Discussion
P
a
per
|
Discus
sion
P
a
per
|
Discussion
P
a
per
|
Discussion
P
a
per
|
When comparing each source-oriented mixture to the weighted average for season and size (bars vs. lines in Fig. 2), most summer sources have an oxidative potential that is at or below the weighted average. This is because “Nighttime Inversion (CV 10)” accounts for most of the PM mass and has a high oxidative potential in summer for both UF and SMF PM, so it dominates the weighted average. In winter, there is less 5
variability between the oxidative potentials of the different sources, but most sources are still at or below the weighted average defined by the “Daytime Mixed Layer (CV 9)” and “Nighttime Inversion (CV 10)”, which make up most of the PM mass.
3.4 Contribution of transition metals to DTT activity
DTT responses in Fig. 2 often mirror the soluble metals concentrations (Fig. 1), e.g., 10
summer SMF “Vehicular Emissions (CV 5)” and “Unknown – Metals (CV 6)” have some of the highest DTT responses, and also have substantially higher soluble metals con-centrations. Other sources, such as summer SMF “Daytime Mixed Layer (CV 9)” and “Nighttime Inversion (CV 10)” also have a high DTT response, but lower soluble metals per PM mass, indicating metals may not explain the DTT response in these cases. To 15
quantify the contribution of each metal to our measured DTT response, we use our measured metal concentrations in each PM extract in conjunction with concentration-response curves for individual transition metals and quinones (Charrier and Anastasio, 2012). In this prior work we determined that the DTT responses from these individual species are additive: mixtures of metals and quinones give the same DTT response as 20
the sum of the DTT responses from the individual species. Therefore, to calculate the total DTT response from soluble metals, we sum the calculated DTT response from each individual species.
Figure 3 shows the measured DTT rate (in grey) in each PM extract compared to the calculated DTT responses from Cu (purple), Mn (green), and Fe, V and Pb (orange)s. 25
ACPD
14, 24149–24181, 2014Oxidant production from source-oriented
particulate matter – Part 1
J. G. Charrier et al.
Title Page
Abstract Introduction
Conclusions References
Tables Figures
◭ ◮
◭ ◮
Back Close
Full Screen / Esc
Printer-friendly Version
Interactive Discussion
Discussion
P
a
per
|
Discus
sion
P
a
per
|
Discussion
P
a
per
|
Discussion
P
a
per
|
of the 38 samples the measured and calculated rates of DTT loss are not statistically different (p <0.05). This excellent agreement between measured and calculated DTT loss is sometimes due to a large error in the calculated DTT response from metals; however, visual inspection of most pairs shows excellent agreement. Our error primar-ily comes from error in the soluble metals measurement as well as error in PM masses 5
added to the vial (Supplement, Table S2). There are a few cases where the calculated DTT response is larger than the measured DTT response, but large error bars in the soluble metals data indicate these differences are generally due to experimental er-ror. One exception is winter UF “Nighttime Inversion (CV10)”, which has a much larger calculated DTT response than we measured from PM. We don’t currently have an ex-10
planation for this result, but it could be an outlier in either the DTT or soluble metals data.
On average (±σ), soluble Cu and Mn account for 83±40 % and 26±14 % of the
measured DTT response, respectively. Fe, V, and Pb each contribute less than 1 % to DTT response; these contributions are too small to be seen for most samples in 15
Fig. 3. Sources of Cu and Mn in Fresno are incompletely understood, as indicated by recent modeling that showed poor correlation between predicted and measured concentrations of Cu and Mn in PM2.5and PM0.1at Fresno (Hu et al., 2014). The model underpredicts Cu and overpredicts Mn. In the US, industrial Cu processing is thought to be the largest source of Cu, followed by brake lining dust, agricultural soil, sintering 20
furnaces, and process gas combustion, while Mn is primarily emitted by unpaved road dust, agricultural soil, electric arc furnaces, and cast iron cupola furnaces in foundries (Reffet al., 2009). The relative importance of industrial sources will likely be smaller in Ca, while break lining dust and agricultural sources will likely be larger due to high VMT and intense agricultural activity. For example, some dairies use copper baths to treat 25
ACPD
14, 24149–24181, 2014Oxidant production from source-oriented
particulate matter – Part 1
J. G. Charrier et al.
Title Page
Abstract Introduction
Conclusions References
Tables Figures
◭ ◮
◭ ◮
Back Close
Full Screen / Esc
Printer-friendly Version
Interactive Discussion
Discussion
P
a
per
|
Discus
sion
P
a
per
|
Discussion
P
a
per
|
Discussion
P
a
per
|
The daytime samples summer SMF CV9 and winter SMF and UF CV8, and CV9, stand out as having a relatively high contribution from unknown species (i.e., the mea-sured rate of DTT loss is larger than the rate calculated from metals). The meamea-sured DTT response in both summer and winter SMF “Daytime Mixed Layer (CV 9)” is statisti-cally larger than calculated from transition metals (Fig. 3b and d, marked with stars). In 5
both cases, unknown species account for 49 % of the measured rates of DTT loss. This indicates that compounds other than the soluble metals we measured, likely quinones or other organics, sometimes make significant contributions to the PM oxidative po-tential. It is possible that insoluble metals also contribute to DTT loss by “unknown species”, but this is less likely since the insoluble fraction of diesel PM (which has 10
a low metal content) oxidizes DTT quickly, while insoluble dust (which has high met-als) oxidizes DTT very slowly (Akhtar et al., 2010). Furthermore, based on our total and soluble metals data, most DTT active metals (except Fe) have a high solubility (Supplement, Fig. S4), while Fe is less soluble but has a very low DTT activity (Char-rier and Anastasio, 2012). Hu et al. (2008) found a strong correlation between DTT 15
response and organic carbon (OC) and observed that concentrations of OC are more than 4 times larger during the day than at night. This could explain our observed in-crease in DTT activity from compounds other than metals during the day. OC is made up of a wide variety of organic compounds, not all of which are DTT active. Except for quinones (Kumagai et al., 2002; Charrier and Anastasio, 2012; Chung et al., 2006), 20
it is largely unknown which organic compounds are active in the DTT assay. Recent research has identified humic-like substances (HULIS) as DTT-active (Verma et al., 2012; Lin and Yu, 2011), so these types of compounds may contribute to the oxidative potential of OC.
We can estimate the likely contribution of quinones to our Fresno PM samples by us-25
ACPD
14, 24149–24181, 2014Oxidant production from source-oriented
particulate matter – Part 1
J. G. Charrier et al.
Title Page
Abstract Introduction
Conclusions References
Tables Figures
◭ ◮
◭ ◮
Back Close
Full Screen / Esc
Printer-friendly Version
Interactive Discussion
Discussion
P
a
per
|
Discus
sion
P
a
per
|
Discussion
P
a
per
|
Discussion
P
a
per
|
If we assume this ambient concentration for all of our Fresno source-oriented mixtures (SMF+UF), the resulting PQN concentration in solution is between 1–12 nM. This would correspond to DTT responses in the range of 0.01–0.16 µM DTT min−1, which represents 2–36 % of the measured DTT rates (with an average ±1σ contribution of 13±9 %). This calculation suggests that PQN will have, at most, a small contribu-5
tion to overall DTT response, and that Cu and Mn dominate DTT loss in the Fresno source-oriented PM1.0 (Fig. 3). This is consistent with our previous calculations for PM2.5 based on typical literature concentrations of DTT-active species (Charrier and Anastasio, 2012), where Cu, Mn, and quinones accounted for 47 %, 28 % and 18 % of the calculated DTT response of a hypothetical “typical” fine particle sample. It is 10
possible that our results underestimate the quinone contribution because semi-volatile organics might be lost during sampling or particle extraction, but we do not have any evidence for this.
In contrast to our mechanistic approach to identify the important DTT-active species in PM, previous studies generally use correlation analysis. However, correlations be-15
tween our DTT results and measured soluble metal concentrations (Supplement, Fig. S4a–c) reveal some of the difficulties with the correlation approach. Cu, Mn, and Fe are modestly correlated with DTT loss (R2values of 0.40, 0.56 and 0.43, respectively), but the correlation with Cu is the weakest, even though our mechanistic approach iden-tifies Cu as the dominant contributor to DTT loss. The correlation understates the role 20
of copper because this metal has a non-linear concentration-response curve (see the green line in Fig. S5a in the Supplement). The positive correlation between DTT loss and Mn agrees with our mechanistic results, but the correlation with Fe is spurious (since Fe is nearly inactive in the DTT assay), possibly due to the covariance between Fe and Mn (Supplement, Fig. S5f). These plots illustrate that correlation analysis is 25
ACPD
14, 24149–24181, 2014Oxidant production from source-oriented
particulate matter – Part 1
J. G. Charrier et al.
Title Page
Abstract Introduction
Conclusions References
Tables Figures
◭ ◮
◭ ◮
Back Close
Full Screen / Esc
Printer-friendly Version
Interactive Discussion
Discussion
P
a
per
|
Discus
sion
P
a
per
|
Discussion
P
a
per
|
Discussion
P
a
per
|
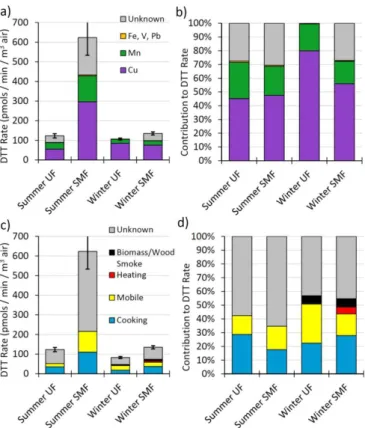
3.5 Air-volume-normalized oxidative potential
While the mass-normalized oxidative potential in Figs. 2 and 3 is useful for identify-ing sources that have the highest potential for harm, the oxidative burden associated with an air parcel also depends on the particle mass concentration of each source. A source aerosol with a very high mass-normalized oxidative potential may not be im-5
portant if its atmospheric mass concentration is low. As a first step to address this, we use Eq. (2) to calculate the air-volume-weighted DTT response for each size frac-tion and season. This metric weights both the intrinsic oxidative potential of a source and the relative abundance of that source. The volume-normalized oxidative poten-tials from both size fractions (i.e., all PM with Dp≤1.0 µm) for summer and winter
10
are 746±90 and 217±10 pmols DTT min−1m−3-air, respectively. The DTT activity in the summer particles is over 3 times higher than in the winter because both the PM mass concentration and mass-normalized oxidative potential of that PM are higher in summer (Table 1 and Fig. 2), by factors of 2.2 and 1.6, respectively. The winter SMF and UF volume-normalized oxidative potentials are 135 and 83 pmols DTT min−1m−3 -15
air, respectively, while the corresponding summer SMF and UF values are 623 and 123 pmols DTT min−1m−3-air, respectively. SMF PM has a higher volume-normalized oxidative potential in both seasons, with summer SMF exhibiting very high oxidative potential due to high mass concentrations and high intrinsic oxidative potentials.
To identify which species and sources drive the air-volume-normalized responses, 20
we next apportion the volume-normalized oxidative potential in two ways – by chemical composition and by source (Fig. 4). Figure 4a shows the contributions of soluble met-als and unknown species for each size fraction and season as an absolute value, while Fig. 4b shows the data as a percent of the total DTT loss. Summer SMF particles have the greatest oxidative potential, approximately 6 times larger than the other conditions, 25
ACPD
14, 24149–24181, 2014Oxidant production from source-oriented
particulate matter – Part 1
J. G. Charrier et al.
Title Page
Abstract Introduction
Conclusions References
Tables Figures
◭ ◮
◭ ◮
Back Close
Full Screen / Esc
Printer-friendly Version
Interactive Discussion
Discussion
P
a
per
|
Discus
sion
P
a
per
|
Discussion
P
a
per
|
Discussion
P
a
per
|
winter UF does not have a contribution from unknown species. Based on these results, unknown species, likely quinones or other organics, are important to the oxidative po-tential of PM in Fresno, but copper and manganese are the dominant redox-active speces. The unknown contribution to PM is primarily from daytime sources (Fig. 3), consistent with secondary formation of quinones from PAHs (Eiguren-Fernandez et al., 5
2008; Wang et al., 2007). DTT response from most segregated nighttime sources, on the other hand, is completely explained by metals, with little unknown contribution (Fig. 3).
Apportionment of volume-normalized oxidative potential by source is more difficult because most (>79 %) of the mass collected was during times when sources were not 10
segregated (daytime), or were collected as part of the catch-all “Nighttime Inversion (CV 10)” source. To more accurately quantify the prevalence of each source, we use modeling results for Fresno based on the ARB’s primary PM2.5 and PM0.1 emissions inventory (Hu et al., 2014). We match sources that we measured with emissions inven-tory sources, then use the modeling results that quantify the relative abundance of each 15
emissions inventory source. A detailed summary of our method is in the Supplement (Sect. S5 and Tables S3 and S4 in the Supplement).
Our results in Fig. 4c and d show that cooking and mobile sources are the largest identified individual contributions, accounting for 18–29 % and 16–28 %, respectively, of the volume-normalized oxidative potential. Biomass/Wood Smoke was only identified 20
during winter in our sampling, and contributes 6 % to the volume-normalized oxidative potential for both the SMF and UF size fractions. Though our sample is designated as “winter”, we only caught the tail end of the wood burning season (Hu et al., 2014), thus these results contain relatively low ambient concentrations of wood burning and do not represent true winter conditions, when much more burning occurs. Heating was only 25
ACPD
14, 24149–24181, 2014Oxidant production from source-oriented
particulate matter – Part 1
J. G. Charrier et al.
Title Page
Abstract Introduction
Conclusions References
Tables Figures
◭ ◮
◭ ◮
Back Close
Full Screen / Esc
Printer-friendly Version
Interactive Discussion
Discussion
P
a
per
|
Discus
sion
P
a
per
|
Discussion
P
a
per
|
Discussion
P
a
per
|
and atmospheric PM mass that was either not identified as a specific source, did not match between the model and ambient sampling, or constituted a mixture of all iden-tified sources. Additionally, modeling results used to identify the relative abundance of each source type use only primary PM mass, without an accounting for the secondary mass present in our ambient samples. Thus, secondary organic aerosol (including re-5
actions that produce quinones) are automatically included in the “Unknown” category. In fact, most of the measured ambient Cu and Mn are apportioned to this category since most measured PM mass resides in this category. In summer, 76 % of Cu and 83 % of Mn are apportioned to this category, while in winter 77 % of Cu and 90 % of Mn are in the unknown categories. This is why it was necessary to use modeling results to 10
properly apportion source contributions.
3.6 Vehicular emissions
Vehicular (mobile) emissions sources exhibited some of the highest mass-normalized oxidative potentials (Fig. 2), high soluble metals concentrations (Fig. 1), and a large contribution to total volume-normalized oxidative potential of PM (Fig. 4c and d). This 15
agrees with literature results that have consistently linked vehicular emissions to both high oxidative potential (Cheung et al., 2010; Delfino et al., 2013; Gasser et al., 2009) and adverse health effects and mortality in humans (Lall et al., 2011; Hoek et al., 2002; Hoffmann et al., 2007). Vehicular emissions contain multiple toxic chemical classes across size ranges, including many metal and organic species. Metals can be emitted 20
from brake wear, lubricating oil and catalytic converters (Lough et al., 2005; Cheung et al., 2010; Zhao et al., 2006). Particulate organics from vehicles are both primary and secondary and are present across multiple size classes (Kam et al., 2012). Paved road dust is a large contribution to PM emissions in urban areas and consists of many sources of PM including soil, biogenic material, and tire and brake wear (Rogge et al., 25
ACPD
14, 24149–24181, 2014Oxidant production from source-oriented
particulate matter – Part 1
J. G. Charrier et al.
Title Page
Abstract Introduction
Conclusions References
Tables Figures
◭ ◮
◭ ◮
Back Close
Full Screen / Esc
Printer-friendly Version
Interactive Discussion
Discussion
P
a
per
|
Discus
sion
P
a
per
|
Discussion
P
a
per
|
Discussion
P
a
per
|
In our summer data, “Vehicular Emissions (CV5)” showed high oxidative potential per mass of PM compared to other sources (Fig. 2a), and also high soluble metals concentrations (Fig. 1a). This source also showed significantly higher oxidative poten-tial and soluble metals in the SMF size fraction vs. UF, which is not true for a majority of other sources. Summer SMF “Vehicular Emissions (CV 5)” was enriched in soluble 5
Zn, Fe and Cu, which were 46 %, 79 % and 188 % higher than the average summer SMF concentrations for the other sources, while concentrations of soluble V, and Mn were similar to the average for the same size and season. Zn and Cu are known to be enriched in brake wear and road dust (Cheung et al., 2010), which have the largest concentrations in coarse sizes but also contribute to submicron PM (Kam et al., 2012). 10
Thus the enhancement in soluble metals in the larger size fraction of summer Vehicular Emissions suggest brake wear or paved road dust can be important contributors to the oxidative potential of SMF vehicular emissions. Winter “Vehicular Emissions (CV3)” did not exhibit the same pronounced enhancement in either soluble metals (Fig. 1b) or ox-idative potential (Fig. 2b), or show a difference between the two size fractions. We do 15
not currently have a definitive explanation for this result; however, there was periodic rain during winter sampling which may have suppressed paved road dust.
4 Conclusions
We measured the oxidative potential of 38 source-oriented particle samples – sepa-rated into submicron fine (SMF) and ultrafine (UF) size fractions – from Fresno, CA 20
in summer 2008 and winter 2009 using the DTT assay. We also quantified total and soluble metals in each sample. Fe and Zn are the most abundant metals, followed by Cu and Mn. V and Pb concentrations are extremely low, and Co, Cr, Cd and Ni are below detection. PM collected in summer 2008 has over two times more Mn and Fe on average and a three times higher ambient SMF mass concentration. As a result, the ox-25
ACPD
14, 24149–24181, 2014Oxidant production from source-oriented
particulate matter – Part 1
J. G. Charrier et al.
Title Page
Abstract Introduction
Conclusions References
Tables Figures
◭ ◮
◭ ◮
Back Close
Full Screen / Esc
Printer-friendly Version
Interactive Discussion
Discussion
P
a
per
|
Discus
sion
P
a
per
|
Discussion
P
a
per
|
Discussion
P
a
per
|
compared to UF particles. Summer SMF sources with high oxidative potential include “Vehicular Emissions (CV 5)”, “Unknown – Metals (CV 6)”, “Daytime Mixed Layer (CV 9)”, and “Nighttime Inversion (CV 10)”. UF sources with the highest oxidative potential per mass of PM include summer “Cooking – NE (CV1)”, summer “Nighttime Inversion (CV 10)”, winter “Morning Commute (CV 8)” and winter “Daytime Mixed Layer (CV 9)". 5
On an air-volume-normalized basis useful for considerations of human exposure, sum-mer PM produces 240 % more oxidative potential than winter PM per cubic meter of air. 83 % of summer oxidative potential is from the SMF size fraction.
Our results indicate that Cu, and to a lesser extent Mn, account for 100 % of the DTT response for most of our individual nighttime sources. DTT rates in the day-10
time sources are also generally dominated by metals, but these samples also have a large (up to 50 %) contribution from unknown compounds, likely quinones and other organics. When calculating the overall volume-normalized oxidative potential for each season (Fig. 4), Cu accounts for approximately 50 %, unknown species account for approximately 30 %, and Mn accounts for 20 %. These results are supported by re-15
cent epidemiological studies that found a statistical relationship between the Cu con-tent of PM and mortality in California (Ostro et al., 2007). When we apportion our volume-normalized oxidative potential to sources, we find that Cooking accounts for 18–29 %, Mobile sources account for 14–28 %, heating and biomass combustion make minor contributions (though they will be larger in the winter months) and un-20
known/unconstrained sources make the largest contribution at 43–65 %.
The Supplement related to this article is available online at doi:10.5194/acpd-14-24149-2014-supplement.
Acknowledgements. We thank Joel Commisso at the UC Davis ICP-MS facility for soluble met-als measurements, Tobias Kraft for assistance with data collection, Jianlin Hu and Mike
Klee-25
ACPD
14, 24149–24181, 2014Oxidant production from source-oriented
particulate matter – Part 1
J. G. Charrier et al.
Title Page
Abstract Introduction
Conclusions References
Tables Figures
◭ ◮
◭ ◮
Back Close
Full Screen / Esc
Printer-friendly Version
Interactive Discussion
Discussion
P
a
per
|
Discus
sion
P
a
per
|
Discussion
P
a
per
|
Discussion
P
a
per
|
and funding from EPRI (award # P43512/C18871). Additional funding was provided by EPA STAR Graduate Fellowship to J.G.C. (no. FP-91718101-0), the National Institute of Environ-mental Health Sciences (Grant # P42ES004699), and by the California Agricultural Experiment Station (Project CA-D*-LAW-6403-RR). This work has not been formally reviewed by the EPA or NIEHS. The views expressed in this article are solely those of the authors and do not
nec-5
essarily represent the views of the funders, who do not endorse any products or commercial services mentioned in this article.
References
Adamson, I. Y. R., Prieditis, H., and Vincent, R.: Pulmonary toxicity of an atmospheric particu-late sample is due to the soluble fraction, Toxicol. Appl. Pharmacol., 157, 43–50, 1999.
10
Akhtar, U. S., McWhinney, R. D., Rastogi, N., Abbatt, J. P. D., Evans, G. J., and Scott, J. A.: Cytotoxic and proinflammatory effects of ambient and source-related particulate matter (PM) in relation to the production of reactive oxygen species (ROS) and cytokine adsorption by particles, Inhal. Toxicol., 22, 37–47, 2010.
Antonini, J. M., Taylor, M. D., Leonard, S. S., Lawryk, N. J., Shi, X. L., Clarke, R. W., and
15
Roberts, J. R.: Metal composition and solubility determine lung toxicity induced by residual oil fly ash collected from different sites within a power plant, Mol. Cell. Biochem., 255, 257– 265, 2004.
Aust, A. E., Ball, J. C., Hu, A. A., Lighty, J. S., Smith, K. R., Straccia, A. M., Veranth, J. M., and Young, W. C.: Particle characteristics responsible for effects on human lung epithelial cells,
20
Research Report, Health Effects Institute, 1–65, discussion 67–76, 2002.
Bein, K. J., Zhao, Y., and Wexler, A. S.: Conditional sampling for source-oriented toxicologi-cal studies using a single particle mass spectrometer, Env. Sci. Technol., 43, 9445–9452, doi:10.1021/es901966a, 2009.
Bein, K. J. and Wexler, A. S.: A high-efficiency, low-bias method for extracting particulate matter
25
from filter and impactor substrates, Atmos. Environ., 90, 87–95, 2014.
Bein, K. J., Zhao, Y., and Wexler, A. S.: Retrospective source attribution for source-oriented sampling and toxicity, Env. Sci. Technol., submitted, 2014.
Breysse, P. N., Delfino, R. J., Dominici, F., Elder, A. C. P., Frampton, M. W., Froines, J. R., Geyh, A. S., Godleski, J. J., Gold, D. R., Hopke, P. K., Koutrakis, P., Li, N., Oberdorster, G.,
ACPD
14, 24149–24181, 2014Oxidant production from source-oriented
particulate matter – Part 1
J. G. Charrier et al.
Title Page
Abstract Introduction
Conclusions References
Tables Figures
◭ ◮
◭ ◮
Back Close
Full Screen / Esc
Printer-friendly Version
Interactive Discussion
Discussion
P
a
per
|
Discus
sion
P
a
per
|
Discussion
P
a
per
|
Discussion
P
a
per
|
Pinkerton, K. E., Samet, J. M., Utell, M. J., and Wexler, A. S.: US EPA particulate matter research centers: summary of research results for 2005–2011, Air Qual. Atmos. Health, 6, 333–355, 2013.
Brunekreef, B. and Holgate, S. T.: Air pollution and health, Lancet, 360, 1233–1242, 2002. Carosino, C. M., Bein, K. J., Plummer, L. E., Castaneda, A., Zhao, Y., Wexler, A. S., and
Pinker-5
ton, K. E.: Allergic airway inflammation is exacerbated differentially by ambient particle size, season and time of day: heme oxygenase-1 as a biomarker of adjuvant potential, Part. Fibre Toxicol., submitted, 2014.
Charrier, J. G. and Anastasio, C.: On dithiothreitol (DTT) as a measure of oxidative potential for ambient particles: evidence for the importance of soluble transition metals, Atmos. Chem.
10
Phys., 12, 9321–9333, doi:10.5194/acp-12-9321-2012, 2012.
Cheung, K. L., Ntziachristos, L., Tzamkiozis, T., Schauer, J. J., Samaras, Z., Moore, K. F., and Sioutas, C.: Emissions of particulate trace elements, metals and organic species from gasoline, diesel, and biodiesel passenger vehicles and their relation to oxidative potential, Aerosol Sci. Tech., 44, 500–513, 2010.
15
Cho, A. K., Di Stefano, E., You, Y., Rodriguez, C. E., Schmitz, D. A., Kumagai, Y., Miguel, A. H., Eiguren-Fernandez, A., Kobayashi, T., Avol, E., and Froines, J. R.: Determination of four quinones in diesel exhaust particles, SRM 1649a, an atmospheric PM2.5, Aerosol Sci. Tech., 38, 68–81, 2004.
Cho, A. K., Sioutas, C., Miguel, A. H., Kumagai, Y., Schmitz, D. A., Singh, M.,
Eiguren-20
Fernandez, A., and Froines, J. R.: Redox activity of airborne particulate matter at different sites in the Los Angeles Basin, Environ. Res., 99, 40–47, 2005.
Chung, M. Y., Lazaro, R. A., Lim, D., Jackson, J., Lyon, J., Rendulic, D., and Hasson, A. S.: Aerosol-borne quinones and reactive oxygen species generation by particulate matter ex-tracts, Env. Sci. Technol., 40, 4880–4886, 2006.
25
Churg, A. and Brauer, M.: Human lung parenchyma retains PM2.5, Am. J. Respir. Crit. Care Med., 155, 2109–2111, 1997.
Connell, D. P., Winter, S. E., Conrad, V. B., Kim, M., and Crist, K. C.: The Steubenville Com-prehensive Air Monitoring Program (SCAMP): concentrations and solubilities of PM2.5trace elements and their implications for source apportionment and health research, J. Air Waste
30
ACPD
14, 24149–24181, 2014Oxidant production from source-oriented
particulate matter – Part 1
J. G. Charrier et al.
Title Page
Abstract Introduction
Conclusions References
Tables Figures
◭ ◮
◭ ◮
Back Close
Full Screen / Esc
Printer-friendly Version
Interactive Discussion
Discussion
P
a
per
|
Discus
sion
P
a
per
|
Discussion
P
a
per
|
Discussion
P
a
per
|
Costa, D. L. and Dreher, K. L.: Bioavailable transition metals in particulate matter mediate car-diopulmonary injury in healthy and compromised animal models, Environ. Health Perspect., 105, 1053–1060, 1997.
De Vizcaya-Ruiz, A., Gutierrez-Castillo, M. E., Uribe-Ramirez, M., Cebrian, M. E., Mugica-Alvarez, V., Sepulveda, J., Rosas, I., Salinas, E., Garcia-Cuellar, C., Martinez, F.,
Alfaro-5
Moreno, E., Torres-Flores, V., Osornio-Vargas, A., Sioutas, C., Fine, P. M., Singh, M., Geller, M. D., Kuhn, T., Miguel, A. H., Eiguren-Fernandez, A., Schiestl, R. H., Reliene, R., and Froines, J.: Characterization and in vitro biological effects of concentrated particulate matter from Mexico City, Atmos. Environ., 40, S583–S592, 2006.
Delfino, R. J., Staimer, N., Tjoa, T., Gillen, D. L., Schauer, J. J., and Shafer, M. M.: Airway
10
inflammation and oxidative potential of air pollutant particles in a pediatric asthma panel, J. Expo. Sci. Environ. Epidemiol., 23, 466–473, 2013.
Demokritou, P., Kavouras, I. G., Ferguson, S. T., and Koutrakis, P.: Development of a high volume cascade impactor for toxicological and chemical characterization studies, Aerosol Sci. Tech., 39, 925–933, 2002.
15
Dockery, D. W., Pope, C. A., Xu, X. P., Spengler, J. D., Ware, J. H., Fay, M. E., Ferris, B. G., and Speizer, F. E.: An association between air pollution and mortality in 6 United-States cities, N. Engl. J. Med., 329, 1753–1759, 1993.
Dominici, F., Peng, R. D., Bell, M. L., Pham, L., McDermott, A., Zeger, S. L., and Samet, J. M.: Fine particulate air pollution and hospital admission for cardiovascular and respiratory
dis-20
eases, J. Am. Med. Assoc., 295, 1127–1134, 2006.
Dreher, K. L., Jaskot, R. H., Lehmann, J. R., Richards, J. H., McGee, J. K., Ghio, A. J., and Costa, D. L.: Soluble transition metals mediate residual oil fly ash induced acute lung injury, J. Toxicol. Environ. Health, 50, 285–305, 1997.
Dye, J. A., Adler, K. B., Richards, J. H., and Dreher, K. L.: Epithelial injury induced by exposure
25
to residual oil fly-ash particles: role of reactive oxygen species?, Am. J. Respir. Cell Mol. Biol., 17, 625–633, 1997.
Eiguren-Fernandez, A., Miguel, A. H., Lu, R., Purvis, K., Grant, B., Mayo, P., Di Stefano, E., Cho, A., and Froines, J.: Atmospheric formation of 9,10-phenanthraquinone in the Los An-geles air basin, Atmos. Environ., 42, 2312–2319, 2008.
30
ACPD
14, 24149–24181, 2014Oxidant production from source-oriented
particulate matter – Part 1
J. G. Charrier et al.
Title Page
Abstract Introduction
Conclusions References
Tables Figures
◭ ◮
◭ ◮
Back Close
Full Screen / Esc
Printer-friendly Version
Interactive Discussion
Discussion
P
a
per
|
Discus
sion
P
a
per
|
Discussion
P
a
per
|
Discussion
P
a
per
|
Ercan, H., Birben, E., Dizdar, E. A., Keskin, O., Karaaslan, C., Soyer, O. U., Dut, R., Sacke-sen, C., Besler, T., and Kalayci, O.: Oxidative stress and genetic and epidemiologic deter-minants of oxidant injury in childhood asthma, J. Allerg. Clin. Immunol., 118, 1097–1104, doi:10.1016/j.jaci.2006.08.012, 2006.
Fearon, I. M. and Faux, S. P.: Oxidative stress and cardiovascular disease: novel tools give
5
(free) radical insight, J. Mol. Cell. Cardiol., 47, 372–381, doi:10.1016/j.yjmcc.2009.05.013, 2009.
Gasser, M., Riediker, M., Mueller, L., Perrenoud, A., Blank, F., Gehr, P., and Rothen-Rutishauser, B.: Toxic effects of brake wear particles on epithelial lung cells in vitro, Part. Fibre Toxicol., 6, 30, doi:10.1186/1743-8977-6-30, 2009.
10
Halliwell, B. and Cross, C. E.: Oxygen-derived species – their relation to human-disease and environmental stress, Environ. Health Perspect., 102, 5–12, 1994.
Hoek, G., Brunekreef, B., Goldbohm, S., Fischer, P., and van den Brandt, P. A.: Association between mortality and indicators of traffic-related air pollution in the Netherlands: a cohort study, Lancet, 360, 1203–1209, 2002.
15
Hoffmann, B., Moebus, S., Mohlenkamp, S., Stang, A., Lehmann, N., Dragano, N., Schmer-mund, A., Memmesheimer, M., Mann, K., Erbel, R., and Jockel, K. H.: Residential exposure to traffic is associated with coronary atherosclerosis, Circulation, 116, 489–496, 2007. Hu, J., Hongliang, Z., Chen, S., Ying, Q., Wiedinmyer, C., Vandenberghe, F., and Kleeman, M.:
Identifying PM2.5and PM0.1sources for epidemological studies in California, Env. Sci.
Tech-20
nol., 48, 4980–4990, 2014.
Hu, S., Polidori, A., Arhami, M., Shafer, M. M., Schauer, J. J., Cho, A., and Sioutas, C.: Re-dox activity and chemical speciation of size fractioned PM in the communities of the Los Angeles-Long Beach harbor, Atmos. Chem. Phys., 8, 6439–6451, doi:10.5194/acp-8-6439-2008, 2008.
25
Ito, K., Mathes, R., Ross, Z., Nadas, A., Thurston, G., and Matte, T.: Fine particulate matter constituents associated with cardiovascular hospitalizations and mortality in New York City, Environ. Health Perspect., 119, 467–473, 2011.
Jokela, W. E., Tilley, J. P., and Ross, D. S.: Manure nutrient content on Vermont dairy farms: long-term trends and relationships, Commun. Soil Sci. Plan., 41, 623–637, 2010.
30
ACPD
14, 24149–24181, 2014Oxidant production from source-oriented
particulate matter – Part 1
J. G. Charrier et al.
Title Page
Abstract Introduction
Conclusions References
Tables Figures
◭ ◮
◭ ◮
Back Close
Full Screen / Esc
Printer-friendly Version
Interactive Discussion
Discussion
P
a
per
|
Discus
sion
P
a
per
|
Discussion
P
a
per
|
Discussion
P
a
per
|
Kumagai, Y., Koide, S., Taguchi, K., Endo, A., Nakai, Y., Yoshikawa, T., and Shimojo, N.: Oxi-dation of proximal protein sulfhydryls by phenanthraquinone, a component of diesel exhaust particles, Chem. Res. Tox., 15, 483–489, doi:10.1021/tx0100993, 2002.
Lall, R., Ito, K., and Thurston, G.: Distributed lag analyses of daily hospital admissions and source-apportioned fine particle air pollution, Environ. Health Perspect., 119, 455–460,
5
2011.
Li, N., Hao, M. Q., Phalen, R. F., Hinds, W. C., and Nel, A. E.: Particulate air pollutants and asthma – a paradigm for the role of oxidative stress in PM-induced adverse health effects, Clin. Immunol., 109, 250–265, doi:10.1016/j.clim.2003.08.006, 2003a.
Li, N., Sioutas, C., Cho, A., Schmitz, D., Misra, C., Sempf, J., Wang, M. Y., Oberley, T.,
10
Froines, J., and Nel, A.: Ultrafine particulate pollutants induce oxidative stress and mito-chondrial damage, Environ. Health Perspect., 111, 455–460, 2003b.
Lin, P. and Yu, J. Z.: Generation of reactive oxygen species mediated by humic-like substances in atmospheric aerosols, Env. Sci. Technol., 45, 10362–10368, 2011.
Lough, G. C., Schauer, J. J., Park, J. S., Shafer, M. M., Deminter, J. T., and Weinstein, J. P.:
15
Emissions of metals associated with motor vehicle roadways, Env. Sci. Technol., 39, 826– 836, 2005.
Maring, H., Savoie, D. L., Izaguirre, M. A., Custals, L., and Reid, J. S.: Mineral dust aerosol size distribution change during atmospheric transport, J. Geophys. Res.-Atmos., 108, 8592, doi:10.1029/2002JD002536, 2003.
20
Ntziachristos, L., Froines, J. R., Cho, A. K., and Sioutas, C.: Relationship between redox ac-tivity and chemical speciation of size-fractionated particulate matter, Part. Fibre Toxicol., 4, doi:10.1186/1743-8977-4-5, 2007.
Oberdorster, G., Oberdorster, E., and Oberdorster, J.: Nanotoxicology: an emerging discipline evolving from studies of ultrafine particles, Environ. Health Perspect., 113, 823–839, 2005.
25
Ostro, B., Feng, W.-Y., Broadwin, R., Green, S., and Lipsett, M.: The effects of components of fine particulate air pollution on mortality in California: results from CALFINE, Environ. Health Perspect., 115, 13–19, 2007.
Perrone, M. G., Gualtieri, M., Consonni, V., Ferrero, L., Sangiorgi, G., Longhin, E., Ballabio, D., Bolzacchini, E., and Camatini, M.: Particle size, chemical composition, seasons of the year
30