Abstract: This paper combined the visual features of Thangka image, and carried some research on how to distinguish Thangka image in digital area. Firstly, using the methods of normalization and image partition processing to preprocess image, and then, adopting two kinds of methods to extract visual features from Thangka image , include (1) Image entropy; (2) Image Color Change Rate(ICCR) matrix. The paper used all the advantage features that Thangka image has, such as colorful vision, informative content and so on, to design similarity measurement through statistic works and propose Interval Threshold Asymptotic Algorithm (ITAA) to distinguish Thangka and non-Thangka image. The experiments showed that the final result is effectively approached to our initial purpose.
Key words: Thangka; Image entropy; Partition processing; Color change rate matrix; Interval threshold asymptotic algorithm
I. INTRODUCTION
Thangka, Tibetan word meaning “painted scroll”, is an art of painting on silk or cloth. It is an integral part of Tibetan painting art with a long history. Its content involves interesting and colorful stories, relates to the history event, religion, personage, local conditions and customs, folklore, fairy story, building layout, astronomy calendar, Tibetan medicine, Tibetan pharmacology and so on. The fantastic art of Thangka is gem of Tibetan culture and art. It is the extremely costful image data and historical material in Tibetology, it is also regarded as an encyclopedia of the history and society of the Tibetan people, has a great value to study from both the academic point of view and the art point of view. It is a bright pearl in the treasure house of world culture as well as a valuable cultural heritage of the world.
In recent years, we used Thangka as our studying object and made some research outcomes in the area of image processing and pattern recognition. For example, the creation of Thangka image database, the digital inpainting of broken Thangka [1]-[3] and Thangka image semantic retrieval[4]-[6]. However, how to make computer understand Thangka, how to distinguish whether an image is Thangka or not is an issue to consider. Presently, there is neither clear definition nor common method.
Manuscript received December 24, 2009. This work was supported in part by the Nature Science Foundation of China under Grant No.60875006, and Science and Research Foundation of Gansu province under Grant No. 096RJZA112.
Lu Yin was with Information Technology Institute, Northwest University for Nationalities, Lanzhou 730030, China; E-mail: [email protected]
Weilan Wang was with School of Computer Science and Information Engineering, Northwest University for Nationalities, Lanzhou 730030, China; E-mail: [email protected]
Danchun Yang was with Art College, Northwest University for Nationalities, Lanzhou 730030, China; E-mail:[email protected]
Thangka image has plentiful features itself, such as colorful visual effect, complicated background, irregular shape, and subtle painting. Through a lot of observations, studying, and related experiments, a method based on multiple feature extraction was proposed to distinguish Thangka and non-Thangka image and tried tentative research on digital definition of Thangka image.
II. FEATURE EXTRACTION BASED ON IMAGE ENTROPY Entropy is an important concept of information theory, which is proposed by Shannon in 1948. Its basic function is to eliminate uncertain elements from many complex factors and to resolve the problem that occurs during the quantitative measurement of information.
A. Image entropy
For digital image, every color value which belongs to different pixels filled various spatial regions with different probabilities. After image gray processing, pixels with different gray levels in image are stochastic appearance, and the probabilities of their appearances are independent to each other. If a digital image has its gray levels range from{0,1,2…
N }, and each level has appearance probability as {P0,P1,P2…
PN}.
Then, image entropy[7][8] can be defined by formula (1).
0
log
N
i i
i
H
P
P
(1)Entropy reflects the amount of information in an image. Complex image has big amount of entropy while simple image has small one.
B. Image subblock entropy matrix
Automatic image segmentation is a difficult task. A variety of techniques have been proposed during the past years, such as curve evolution, energy diffusion and graph partitioning[9][10].
Calculating image entropy in overall situation can just show global statistical features. It will lose information of spatial relationship. Hence, partition processing was chosen to preprocess Thangka at first. And then, the image entropy inside each block[11] can be calculated meanwhile the entropy matrix according to spatial relationship of all blocks can be made. Thereby, the spatial information was merged into image entropy preferably.
C. Entropy template training and similarity measurement
To measure similarity distance between the subblock entropy matrix of two images, this paper designed statistic works to build entropy histogram, and then, to obtained the
Study on How to Distinguish Thangka and
Non-Thangka Image
template of entropy matrix through training. At last, the methods of histogram sort and histogram intersection distance was combined together to fulfill similarity measurement.
The specific process can be completed through the following four steps:
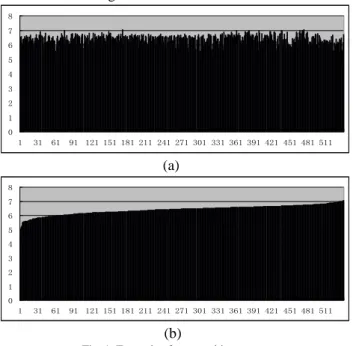
1) Calculating subblock entropy matrix for each training Thangka image, and using histogram to complete statistics. The horizontal axis denotes subblock labels and the vertical axis denotes entropy.
2) Using histogram sort method to range entropy of all blocks in ascending order.
0 1 2 3 4 5 6 7 8
1 31 61 91 121 151 181 211 241 271 301 331 361 391 421 451 481 511
(a)
0 1 2 3 4 5 6 7 8
1 31 61 91 121 151 181 211 241 271 301 331 361 391 421 451 481 511
(b)
Fig. 1 Example of entropy histogram
As shown in Fig 1, (a) is an entropy histogram of a Thangka image, (b) is the sorting result of (a).
3) Using formula (2) to train all statistical Thangka images after sorting:
0
(
) /
N
ij j
B
N
( j = 0,1,2…N ; i= 0,1,2…M) (2) Where, N indicates the number of training images, and M indicates the number of gray levels in every image. After sorting,B
ij represents that the entropy of the i-th place in thej-th image entropy histogram. Using every gray level as a unit to compute the average entropy of all images in same position. It can obtain the average entropy on one position when we calculate formula(2) once. After finishing training for all gray levels, the Thangka image template T of entropy histogram is obtained. It is an useful standard of similarity measurement for the following calculation.
4) The definition of traditional histogram intersection distance.
( , ) 0
0
min[
( ),
( )]
( )
M
Q Q
k
Q D M
Q k
H
k H
k
P
H
k
(3)Where, HQ(k) and HD(k) are the statistics histogram of
image Q and image D respectively. M expresses the number of gray levels.
However, because Thangka image template T of entropy histogram is a set of the average entropy in each position of all
images. Thus, during the process of similarity measurement, it is not reasonable to calculate the minimum value only, it will lose measured information. Hence, we use formula(4) to measure similarity distance:
( , ) 0
( )
( )
M
Q D Q D
i
P
H
i
H
i
(4)
P
(Q D, ) is the result of similarity distance between image Q and image D.D. Similarity measurement of image entropy method
Image entropy was applied to proceed similarity measurement. Algorithm 1 is designed as following.
Algorithm 1:
Step 1: Preprocessing the image by gray processing method.
Step 2: Blocking image, and calculate entropy inside each block by formula(1).
Step 3: Changing entropy matrix into entropy histogram and sorting the histogram.
Step 4: Calculating measurement distance between the sorting histogram in step 3 and Thangka template T of entropy histogram. Then, the result of similarity distance is obtained.
III. FEATURE EXTRACTION BASED ON IMAGE COLOR CHANGE RATE(ICCR)
Through observation, we can found that Thangka image are obviously different from other kinds of images. It has vivid color, complicated texture, and rich in content. Especially, the color change is particularly evident. Enlarging the image, we can see the color change rate of the adjacent pixels in Thangka image is greater than natural image significantly. Thereby, we chose ICCR as method to distinguish Thangka and non-Thangka image.
A. Calculation of ICCR
In this paper, RGB color space was chosen to carry on the point operation. And the feature extraction is focus on how to calculate ICCR between the adjacent pixels. The specific process is described as the following algorithm 2.
Algorithm 2:
Step 1: Choosing the lower-left pixel of image pixel matrix as the original of coordinate to establish coordinate system.
Step 2: Using Euclidean distance to calculate ICCR between two pixels:
2 2 2
1 2
(
1 2)
(
1 2)
(
1 2)
P
P
R
R
G
G
B
B
Where,
(
R G B
1,
1,
1)
and(
R G B
2,
2,
2)
are the color values of adjacent pixelP
1andP
2.Step 3: Calculating ICCR according to two directions which include horizontal and vertical way both.
Horizontal direction:
1 , 1 1 1
n m
i j ij i j
P
P
Vertical direction:
1 1, 1 1
m n
i j ij j i
P
P
Step 4: Summing the result from two directions of ICCR and divide by the total number of image pixels.
ICCR=[(
1 , 1 1 1
n m
i j ij i j
P
P
)+(1 1, 1 1
m n
i j ij j i
P
P
)] /(n m
)Then, the parameter of ICCR is obtained.
Experiments showed that the ICCR parameter of images with vivid color and complex content is much greater than the images with simple content and gentle color change. It has been proven that this method is effective.
B. ICCR matrix
It will lose spatial information if we just take into account the overall situation of ICCR. Thus, partition processing is necessary for ICCR feature extraction. This paper calculated ICCR inside each block of image and composed ICCR matrix according to the spatial relationship of all blocks. The effect picture is shown below:
(a) (b) Fig. 2 Image and its corresponding ICCR matrix
After partition processing, it is obvious that the ICCR parameter of blocks of the two buildings is bigger. Accordingly, in the sky area around the buildings, the color change is gentler and the corresponding ICCR parameter is smaller in picture (b). Hence, by comparing the two pictures, we can see the outline of two buildings in the ICCR matrix. In this way, the spatial information appeared.
C. The further application of ICCR matrix
Through experiments, the paper counted the ICCR parameter of blocks by doing statistics. We defined the block whose ICCR parameter is lower than 50 as Low Threshold Block(LTB). By counting LTB, we can find the LTB number of Thangka is relatively smaller than natural image.
Through research, we can see a large number of Thangka images have visual symmetry. Thus, we draw an effect picture by painting LTB in ICCR matrix and make contrast with actual image:
(a) (b) Fig. 3 Thangka image and its effect picture of LTB
Where, Fig 3(a) is a Thangka image. It has obvious visual
symmetry. Fig 3(b) is the effect picture of (a) and the LTB is painted by blue. Through the contrast of Fig 3, we can see the ICCR matrix has the same symmetric feature. Hence, this paper makes conclusion that if an image has symmetry feature, its ICCR matrix will express the symmetry feature at the same time. Thereby, we design algorithm to calculate the symmetry feature of ICCR matrix.
Algorithm 3:
Step 1: Making normalization process and calculating ICCR matrix.
Step 2: Assigning a flag for each block. And, if one block is LTB, set its flag to 1, otherwise, set its flag to 0.
Step 3: Traversing each block of the left half image(left side of red center axis in picture (b)), and making each block compare with its symmetrical position in the right area. If they have the same flag, it means they both are LTB or both not, parameter P(used to count symmetry feature) add 1, otherwise, P minus 1. Location of symmetrical relation is calculated as follow:
In matrix, the symmetrical position of
S
ij is position:,10 11
i j
S
(1
i
27,1
j
20
). Through experiments, we can see:1) Generally, the symmetry parameter P of Thangka image which has symmetry feature is bigger than the natural image which has not symmetry feature.
2) The rate of Thangka image which has symmetry feature is much greater than natural image.
IV. INTERVAL THRESHOLD ASYMPTOTIC ALGORITHM (ITAA)
According to research and statistics result, this paper proposed a method named Interval Threshold Asymptotic Algorithm which is appropriate for the Thangka image discrimination. Its basic idea is to distinguish an image based on multiple features extraction layer by layer, until it reaches the final conclusion. For example, there is an image “I” to be recognized. To assign it into two categories, A and B, there are two kinds of feature extraction methods can be used , method X and method Y. More precisely, the process of ITAA is described as follow.
Algorithm 4:
Step 1: Using method X to extract feature from image I and doing similarity measurement to calculate Parameter 1.
Step 2: Setting a high threshold HT and a low threshold LT. If Parameter 1 is higher than HT, then judge image as category A. If Parameter 1 is lower than LT, then judge image as category B. If Parameter 1 is between LT and HT, enter Step 3.
Step 3: Using method Y to extract feature from image I and doing similarity measurement to calculate Parameter 2.
Step 4:Setting threshold to distinguish image by Parameter 2.
V. FINAL DISTINGUISH METHOD FOR THANGKA AND NON-THANGKA IMAGE
This paper proposed ITAA as framework and combined image entropy and ICCR as feature extraction methods to distinguish Thangka image. The specific realization is shown in algorithm 5.
Algorithm 5:
Step 1: Preprocessing image I by gray processing and partition processing.
Step 2: Applying Algorithm 1 to obtain parameter P1 by calculating similarity distance between image I and Thangka image template T of entropy histogram.
Step 3: If P1<=Entropy_LT, then judge image I is Thangka. If P1>= Entropy_HT, then judge image I is non-Thangka. If Entropy_LT <P1< Entropy_HT, enter Step 4.
Step 4: Applying Algorithm 2 to obtain parameter by calculating ICCR matrix of image I (color image before gray processing). And then, counting the number of LTB and named it parameter P2. If P2<=Color_LT, then judge image I is Thangka. If P2>=Color_HT, then judge image I is non-thangka. If Color_HT <P2< Color_HT, enter Step 5.
Step 5: Applying Algorithm 3 to calculate symmetry feature of image I and obtain the symmetrical parameter P3. If P3>P_Symmetry, then judge image I is Thangka. If P3<=P_Symmetry, then judge image I is non-thangka.
VI. EXPERIMENT RESULT AND ANALYSIS
This paper built an image database including 200 images. Among them, there are 100 Thangka images with high quality and 100 natural images (include 50 landscape images, 20 building images, 10 people images and 20 miscellaneous images). In order to implement parameter statistics better, preprocessing should be involved to all images. Firstly , the size of images are all normalized to 400*540; Secondly, the size of each subblock is defined as 20*20, thus, the normalized image is divided into 540 blocks.(Width is divided into 20 blocks and height is divided into 27 blocks). This is the basic process for following calculation of image entropy and ICCR matrix.
A. Experiment analysis of image entropy
1) Calculating image entropy for the 100 Thangka images and 100 natural images and making entropy histogram template respectively. The two templates are shown below:
TK
0 1 2 3 4 5 6 7 8
1 28 55 82 109 136 163 190 217 244 271 298 325 352 379 406 433 460 487 514 (a)
ZR
0 1 2 3 4 5 6 7 8
1 28 55 82 109 136 163 190 217 244 271 298 325 352 379 406 433 460 487 514 (b)
Fig. 4 Template of entropy histogram
Where, Fig 4(a) is template of 100 Thangka images, (b) is template of 100 natural images. From the statistical entropy histogram template, we can see the subblock entropy of Thangka images are overall bigger and the change trend is gentle. But, the subblock entropy of natural images is smaller and has cliffy change trend. (a) is the template T we need.
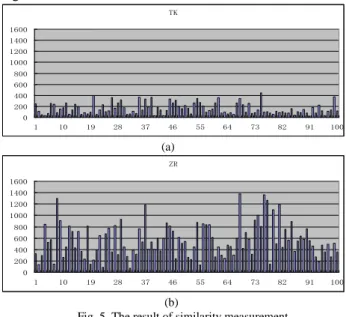
2) Applying Algorithm 1 to calculate the similarity distance between 200 images and template T respectively. Doing statistics to make similarity distance histogram as shown in Fig 5:
TK
0 200 400 600 800 1000 1200 1400 1600
1 10 19 28 37 46 55 64 73 82 91 100
(a)
ZR
0 200 400 600 800 1000 1200 1400 1600
1 10 19 28 37 46 55 64 73 82 91 100
(b)
Fig. 5 The result of similarity measurement
Where, Fig 5(a) is the similarity distance result of 100 Thangka images. (b) is the result of 100 natural images. Obviously, Thangka images are more close to the template T.
B. Experiment analysis of ICCR
Through counting the number of LTB for each image and doing statistic works, the comprehensive result is showed in Fig.6 :
0 100 200 300 400 500 600
1 10 19 28 37 46 55 64 73 82 91 100 TK NI
Fig. 6 Statistical picture of LTB number of 200 images
Horizontal axis denotes the image number, vertical axis denotes the LTB number. Blue line represents Thangka and red line represents natural images. Evidently, the LTB number of Thangka is less than natural images.
C. Determination of relevant threshold
By a large number of experiments and data training, finally, the relevant threshold above the paper is obtained and is shown in Table I.
TABLEⅠ:THRESHOLD TABLE
Entropy_LT Entropy_HT Color_LT Color_HT P_Symmetry Final
D. Detection of the final algorithm
We select 200 natural images and 100 Thangka to extend the original database, and apply Algorithm 5 to distinguish all the 500 images. Eventually, 461 images are detected correctly. The correct rate is 92.2%.
VII. CONCLUSION
Based on the features of Thangka image itself, this paper chooses two kinds of feature extraction methods to research Thangka. ICCR matrix takes full use of the visual features of Thangka images, especially the complex and changeable color. Image entropy calculates the quantity of information of Thangka image pixels. The final algorithm ITAA adopts the hierarchical method to distinguish Thangka, which means it only takes into account one feature extraction method on each layer. It is a kind of thinking for dimension reduction in multiple feature extraction of image. And, the experiment result is close to our purpose.
In future research, we will try to attempt more methods to improve the feature extraction algorithm. Trying a variety of points to research the features of Thangka image as far as possible, the aim of us at further is to enhance distinguish correct rate of Thangka and non-thangka image.
REFERENCES
[1] Huaming Liu, Weilan Wang and Hui Xie. “Thangka Image Inpainting Using Adjacent Information of Broken Area”. International Multi Conference of Engineers and Computer Scientists 2008. Hong Kong, March, 2008. pp.646-649.
[2] Weilan Wang, Huaming Liu. “Study on Thangka Image Inpainting Based on Damaged Area Classification”. International Conference on Information Technology and Environmental System Sciences 2008.pp.474-480
[3] Weilan Wang, Shixi Tang. “Tibetan TangKa Image Inpainting in Intricate Disrepaired Region”.Computer Engineering and Design. 2007,(2).pp.703-705. (In Chinese).
[4] Weilan Wang. “Study of Thangka Image Retrieval and Multimedia Presentation Management System”. Fifth International Conference on Intelligent Information Hiding and Multimedia Signal Processing, Japan 12-14 September 2009, pp.981-984.
[5] Jianjun Qian, Weilan Wang. “Main Feature Extraction and Expression for Religious Portraint Thangka Image”. The 9th International Conference for Young Computer Scientists, 18-21 Nov,2008, pp.803-807.
[6] JianjunQian, Weilan Wang. “Religious portrait Thangka image retrieval based on gesture feature”. Chinese Conference on Pattern Recognition, 4-6 Nov,2009, pp.568-572.
[7] John Z M.. “An Information Theoretic Approach to Content Based Image Retrieval”. Louisiana State University and Agricultural and Mechanical College,Phd.Thesis,2000,pp.45~62.
[8] Lu Wei,Ni Lin.Kansei. “Image Rerieval Based on ROI Exracted by Color and Entropy”. Journal of Image and Graphics. 2006, pp.492-497(In Chinese).
[9] Ying Liu,Deng sheng Zhang,Guojun Lu,Weiying. “Ma. A survey of content –based image retrieval with high-level semantics”.Pattern Recognition 40 (2007),pp.262-282.
[10] J.Shi,J.Malik. “Normalized cuts and image segmentation”,IEEE Trans.Pattern Anal. Mach. Intell. (PAMI) 22(8)(2000),pp.888-905. [11] Yujin Zhang. “Retrieval of visual information based on content”.