SED
3, 105–147, 20113-D
thermo-mechanical modelling
D. Boutelier and O. Oncken
Title Page
Abstract Introduction
Conclusions References
Tables Figures
◭ ◮
◭ ◮
Back Close
Full Screen / Esc
Printer-friendly Version Interactive Discussion
Discussion
P
a
per
|
Dis
cussion
P
a
per
|
Discussion
P
a
per
|
Discussio
n
P
a
per
|
Solid Earth Discuss., 3, 105–147, 2011 www.solid-earth-discuss.net/3/105/2011/ doi:10.5194/sed-3-105-2011
© Author(s) 2011. CC Attribution 3.0 License.
Solid Earth Discussions
This discussion paper is/has been under review for the journal Solid Earth (SE). Please refer to the corresponding final paper in SE if available.
3-D thermo-mechanical laboratory
modelling of plate-tectonics
D. Boutelier1,2and O. Oncken1
1
Helmholtz Centre Potsdam, GFZ German Research Centre for Geosciences, Telegrafenberg, 14473 Potsdam, Germany
2
School of Geosciences, Monash University, Melbourne, VIC 3800, Australia
Received: 7 February 2011 – Accepted: 12 February 2011 – Published: 18 February 2011 Correspondence to: D. Boutelier ([email protected])
SED
3, 105–147, 20113-D
thermo-mechanical modelling
D. Boutelier and O. Oncken
Title Page
Abstract Introduction
Conclusions References
Tables Figures
◭ ◮
◭ ◮
Back Close
Full Screen / Esc
Printer-friendly Version Interactive Discussion
Discussion
P
a
per
|
Dis
cussion
P
a
per
|
Discussion
P
a
per
|
Discussio
n
P
a
per
|
Abstract
We present an experimental apparatus for 3-D thermo-mechanical analogue mod-elling of plate-tectonics processes such as oceanic and continental subductions, arc-continent or arc-continental collisions. The model lithosphere, made of temperature-sensitive elasto-plastic with softening analogue materials, is submitted to a constant
5
temperature gradient producing a strength reduction with depth in each layer. The surface temperature is imposed using infrared emitters, which allows maintaining an unobstructed view of the model surface and the use of a high resolution optical strain monitoring technique (Particle Imaging Velocimetry). Subduction experiments illustrate how the stress conditions on the interplate zone can be estimated using a force
sen-10
sor attached to the back of the upper plate and changed because of the density and strength of the subducting lithosphere or the lubrication of the plate boundary. The first experimental results reveal the potential of the experimental set-up to investigate the three-dimensional solid-mechanics interactions of lithospheric plates in multiple natural situations.
15
1 Introduction
Plate tectonic processes are characterized by very large spatial and temporal scales. Consequently, geological data often provide partial insights into their mechanics, and geodynamic modeling, using either experimental or numerical techniques, is routinely employed to better understand their development in space and time. The
experimen-20
tal modeling technique is particularly efficient to investigate three-dimensional phe-nomenon (Davy and Cobbold, 1991; Bellahsen et al., 2003; Funiciello et al., 2003; Schellart et al., 2003; Cruden et al., 2006; Luth et al., 2010). However, in multiple experimental models, the rheological stratification of the lithosphere is simplified and the strength variations induced by the temperature gradient through the lithosphere are
25
SED
3, 105–147, 20113-D
thermo-mechanical modelling
D. Boutelier and O. Oncken
Title Page
Abstract Introduction
Conclusions References
Tables Figures
◭ ◮
◭ ◮
Back Close
Full Screen / Esc
Printer-friendly Version Interactive Discussion
Discussion
P
a
per
|
Dis
cussion
P
a
per
|
Discussion
P
a
per
|
Discussio
n
P
a
per
|
Cobbold, 1991; Schellart et al., 2003; Cruden et al., 2006; Luth et al., 2010). A draw-back of this simplification is that the mechanical properties are retained throughout the entire experiment regardless of temporal temperature variations associated with vertical displacement.
Experimental modeling with temperature-sensitive analogue materials allows
incor-5
porating these temporal temperature variations and their mechanical consequences (Chemenda et al., 2000; Rossetti et al., 2000, 2001, 2002; Wosnitza et al., 2001; Boute-lier et al., 2002, 2003, 2004; BouteBoute-lier and Chemenda, 2008; Luj ´an et al., 2010). A con-ductive temperature gradient imposed in the model lithosphere controls the rheological stratification prior to deformation (Boutelier et al., 2002, 2003, 2004). During
deforma-10
tion heat is naturally advected and diffused. Consequently, the temperature changes in various parts of the model lithosphere (e.g. in subducted lithosphere) and strength then changes accordingly (i.e. strength decreases when temperature increases and in-creases when temperature dein-creases). However, due to the complexity of the thermo-mechanical analogue modeling technique, most thermo-thermo-mechanical models used a
15
2-D approximation.
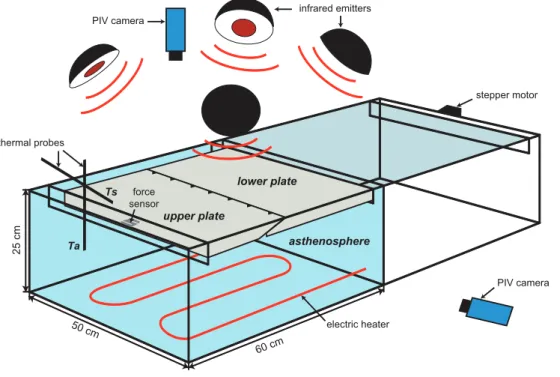
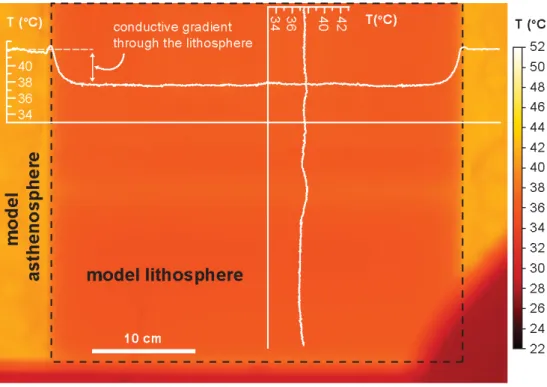
We developed a new apparatus allowing the implementation of 3-D thermo-mechanical lithospheric-scale models (Fig. 1). In this study, we describe the new temperature-sensitive analogue materials, the advantages of the experimental set-up and the necessary assumptions. We then present experiments illustrating two major
20
features of the apparatus. The first one is the incorporation of a force sensor recording the horizontal convergence-parallel tension or compression in the model lithophere (Fig. 1) and allowing identification of some key parameters that control the stress regime in the arc and back-arc area during oceanic subduction. The second major feature is that the temperature at the surface of the model lithosphere is controlled and
25
SED
3, 105–147, 20113-D
thermo-mechanical modelling
D. Boutelier and O. Oncken
Title Page
Abstract Introduction
Conclusions References
Tables Figures
◭ ◮
◭ ◮
Back Close
Full Screen / Esc
Printer-friendly Version Interactive Discussion
Discussion
P
a
per
|
Dis
cussion
P
a
per
|
Discussion
P
a
per
|
Discussio
n
P
a
per
|
2 General modeling scheme
The lithosphere is the superficial shell of the Earth capable of undergoing large quasi-rigid horizontal displacements with strain-rates far lower than those experienced by the underlying asthenosphere (Anderson, 1995). This definition provides the general framework for our modeling. Since the viscosity of the asthenosphere is several orders
5
of magnitude lower than the effective viscosity of the lithosphere (Mitrovica and Forte, 2004; James et al., 2009), it can only exert a small shear traction on the base of the lithosphere (Bokelmann and Silver, 2002; Bird et al., 2008), which can be neglected if we focus our interest on the solid-mechanics interaction of the plates in the subduction zone. Consequently the asthenosphere can be modeled with a low-viscosity fluid
(wa-10
ter) whose unique role is to provide hydrostatic equilibrium below the lithosphere. We acknowledge that the role of the asthenosphere is currently underplayed (Bonnardot et al., 2008a), however this role can be later investigated when replacing water used for the asthenosphere by another low-viscosity fluid with the proper scaled viscosity.
If it is clear that the asthenosphere can be modeled with a fluid, the mechanical
15
behavior of the lithosphere is more complicated. Laboratory measurements of rock strength extrapolated to the conditions of pressure, temperature and strain-rates char-acteristic of plate tectonics led to the development of the Brace-Goetze strength profile for the rheological stratification of the lithosphere (Goetze and Evans, 1979; Brace and Kohlstedt, 1980; Evans and Kohlstedt, 1995; Kohlstedt et al., 1995). The mechanical
20
behavior of the lithosphere is brittle near the surface and is mainly controlled by fric-tional sliding (Byerlee, 1978). However at greater depth the lithosphere becomes more ductile, and with further increase of temperature and pressure with depth, the litho-spheric behavior becomes more viscous (Ranalli and Murphy, 1987; Ranalli, 1997). One could then represent the oceanic lithosphere with a 3-layers model in which the
25
SED
3, 105–147, 20113-D
thermo-mechanical modelling
D. Boutelier and O. Oncken
Title Page
Abstract Introduction
Conclusions References
Tables Figures
◭ ◮
◭ ◮
Back Close
Full Screen / Esc
Printer-friendly Version Interactive Discussion
Discussion
P
a
per
|
Dis
cussion
P
a
per
|
Discussion
P
a
per
|
Discussio
n
P
a
per
|
Finally, since we are interested in the large deformation of the lithosphere we must also consider the material strain softening behavior, required in order to produce and maintain lithospheric-scale shear zones. In the brittle layers of the lithosphere the lo-calization is a natural consequence of the deformation mechanism, however, strain localization in the ductile regime is not fully understood. It may be promoted by strain
5
softening mechanisms such as dynamic recrystallization and shear heating (Poirier, 1980; White et al., 1980; Rutter and Brodie, 1988; Mont ´esi and Zuber, 2002; Hartz and Podladchikov, 2008), but the softening functions associated with these mechanisms are still debated. An equivalent efficient strain localization process (up to 50% soft-ening) is obtained in our model lithosphere using specially designed strain-softening
10
elasto-plastic materials.
3 Scaling requirements
The principle of analogue modeling is based on scaling laws, in which geometric, kine-matic and dynamic similarity between the natural prototype and the model are achieved by scaling-down lengths, time and forces (Buckingham, 1914; Ramberg, 1967; Davy
15
and Cobbold, 1991; Shemenda, 1994). When scaling relationships are fulfilled, the model behaves mechanically like the prototype but is manageable in a laboratory, and the effects of various key parameters can then be tested using multiple carefully de-signed, built and monitored experiments.
For conveniency the model lithosphere must be relatively small. Hence, we chose
20
a length scaling factorL∗=L
m/Ln=2.86×10− 7
, which yields that 1 cm in the model represents 35 km in nature.
The scaling of the all densities the model is already set by our choice of using wa-ter to represent the asthenosphere. The scaling factor for densities isρ∗=ρ
m/ρn= 3.08×10⁻¹ as 1000 kg m−3 represents 3250 kg m−3. Consequently an old, dense
25
SED
3, 105–147, 20113-D
thermo-mechanical modelling
D. Boutelier and O. Oncken
Title Page
Abstract Introduction
Conclusions References
Tables Figures
◭ ◮
◭ ◮
Back Close
Full Screen / Esc
Printer-friendly Version Interactive Discussion
Discussion
P
a
per
|
Dis
cussion
P
a
per
|
Discussion
P
a
per
|
Discussio
n
P
a
per
|
the low-density continental crust can be modeled with a material having a density of 860 kg m−3representing 2750 kg m−3in nature.
The scaling of stress is already set by the scaling of hydrostatic pressure ρ g z where depthz scales with length. Since the experiments are produced with normal gravitational acceleration (i.e. g∗=1 or gm=gn=9.81 m s−
2
), σ∗=σm/σn=ρ∗×L∗=
5
8.79×10⁻⁸ and a flow stress of ∼10 MPa at the bottom of the lithosphere must be ∼1 Pa in the model, while a flow stress of∼500 to 1000 MPa in the stronger part of the lithosphere must be∼45 to 90 Pa in the model. Therefore the analogue material employed to model the oceanic lithosphere should have a strength∼1 to∼100 Pa from the bottom to the top.
10
Before plastic failure, the lithosphere deforms elastically with a shear modulus Gn of ∼1–10×1010Pa (Dziewoski and Anderson, 1981). Since the dimension of G is that of a stress, it must be scaled by the same ratio: σ∗. Therefore the model shear modulus should be of the order of∼1 to 10×103Pa. However, measuring the shear modulus of a very weak material proved to be challenging and therefore the shear
15
modulus could only be measured for low temperatures corresponding to the surface of the model lithosphere. We must therefore acknowledge that the elastic properties are only approximately scaled.
The scaling of time is chosen in order to properly scale the temperature variations associated with deformation. The imposed velocity controls the advection of heat in
20
the model, which must be properly balanced with diffusion. In order to maintain this balance, the dimensionless ratio VL/κ, with V being the velocity, L the length, andκ the thermal diffusivity, must be the same in the model and nature (Chemenda et al., 2000). Since the scaling of length has been set already, the thermal diffusivity of the analogue materials controls the scaling of velocity and therefore of time. The later is
25
SED
3, 105–147, 20113-D
thermo-mechanical modelling
D. Boutelier and O. Oncken
Title Page
Abstract Introduction
Conclusions References
Tables Figures
◭ ◮
◭ ◮
Back Close
Full Screen / Esc
Printer-friendly Version Interactive Discussion
Discussion
P
a
per
|
Dis
cussion
P
a
per
|
Discussion
P
a
per
|
Discussio
n
P
a
per
|
4 Analogue materials
The employed analogue materials are thixotropic dispersions of solid hydrocarbons and powders in oil possessing elasto-visco-plastic properties that are strongly depen-dent on temperature. Like real rocks, the analogue materials exhibit various rheological behaviors for various temperatures and strain-rates, from linear viscous to non-linear
5
viscous to plastic and brittle dilatant properties. The temperature and strain rates of the model lithosphere are chosen such that the materials can be considered purely elasto-plastic (i.e., not sensitive to strain rate) with softening and satisfy the scaling requirements presented above.
4.1 Composition
10
The materials are composed of various quantities of paraffin and microcrystalline waxes, Vaseline, and paraffin oil held together with a highly branched alphaolefin poly-mer. The density is adjusted with the addition of a clay powder, which binds with the oil-based matrix via a water-in-oil surfactant (phosphatidylcholine). The material em-ployed for the neutrally-buoyant mantle lithosphere of Experiment 1 has the following
15
proportions: Vaseline (32.2%), mineral oil (32.2%), clay powder (23%), paraffin wax (6.3%), alpha-olefin polymer (4.5%), microcrystalline paraffin wax (1.5%) and phos-phatidylcholine (0.3%).
4.2 Mechanical testing
The mechanical properties of the materials have been measured at the
Helmholtz-20
Zentrum Potsdam (GFZ) using a Rheotec RC20 CPS rheometer with a cone-and-plate geometry. The materials are liquid at temperature greater than or equal to the melting point (45–50◦C). To measure the mechanical properties of the materials at tempera-tures within the range 37–43◦C used in the experiments, the sample is first melted on the heating bottom plate of the rheometer and the rheometer head is slowly lowered
SED
3, 105–147, 20113-D
thermo-mechanical modelling
D. Boutelier and O. Oncken
Title Page
Abstract Introduction
Conclusions References
Tables Figures
◭ ◮
◭ ◮
Back Close
Full Screen / Esc
Printer-friendly Version Interactive Discussion
Discussion
P
a
per
|
Dis
cussion
P
a
per
|
Discussion
P
a
per
|
Discussio
n
P
a
per
|
into the sample. The temperature is then slowly lowered to 20◦C and the sample is kept at ambient temperature until full strength is developed. The temperature is finally slowly increased to, and maintained at, the desired temperature of measurement. This protocol allows having full coupling between the sample and both the bottom plate and rheometer head.
5
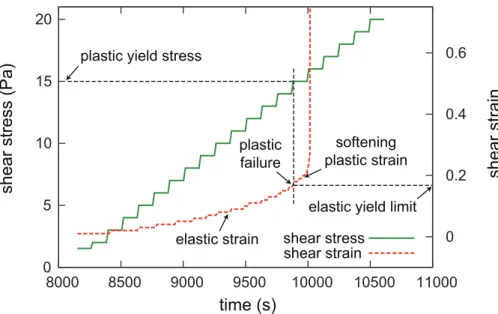
The material mechanical behavior at a specific temperature is characterized in pure shear using a series of successive creep tests. A constant stress is imposed on the sample for 120 s and then the shear stress is ramped up. For low stresses the materials behave elastically and strain increases with stress (Fig. 2). When the yield stress is reached, strain rapidly increases while the shear stress is maintained constant (Fig. 2).
10
This type of test allows characterizing quantitatively the elastic shear modulus, the plastic yield stress and qualitatively the softening/hardening behavior.
4.3 Elastic properties
The hydrocarbon systems behave elastically for low stresses and the shear strain in-creases instantaneously each time the shear stress is incremented (Fig. 2). Therefore,
15
using the creep tests before failure only, a linear regression of the stress-strain curve provides the elastic shear modulus G, (τ=G×γ). However, to be measurable the shear strain increase must be sufficiently large. Large stress steps (i.e.≥∼5 Pa) are therefore more suitable for quantifying the elastic properties but if the shear stress is increased in too large steps, the precision on the yield stress is not satisfactory. Finally
20
another restriction on the measurement of the elastic properties arise when the plastic yield stress is small. Then only a few data points can be collected, which is insufficient to derive a meaningful linear regression and thus elastic shear modulus. Consequently, we adopted the following strategy:
– For high temperatures (≥39◦C), when the material is weak, the mechanical test
25
SED
3, 105–147, 20113-D
thermo-mechanical modelling
D. Boutelier and O. Oncken
Title Page
Abstract Introduction
Conclusions References
Tables Figures
◭ ◮
◭ ◮
Back Close
Full Screen / Esc
Printer-friendly Version Interactive Discussion
Discussion
P
a
per
|
Dis
cussion
P
a
per
|
Discussion
P
a
per
|
Discussio
n
P
a
per
|
– For low temperatures (≤39◦C) the tests are conducted with larger stress steps allowing measurement of the elastic properties.
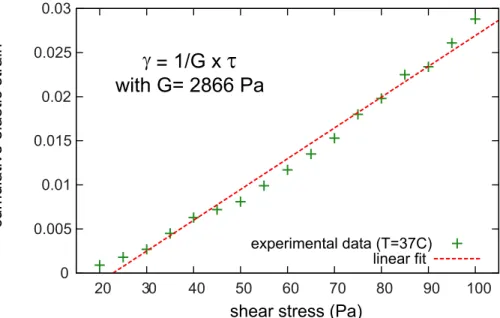
The results reveal that the shear modulus decreases with temperature increase but remains in the range 1000 to 3000 Pa, which scales to 1.14 to 3.4×10¹⁰Pa in na-ture (Fig. 3). Characterisation of the elastic properties thus remains incomplete,
how-5
ever, the presented values of the shear modulus are robust since oscillatory tests (see Boutelier et al., 2008, for precisions on oscillatory tests) also showed a dynamic storage modulusG′ (equivalent toGin dynamic tests) with the same magnitude (
∼1500 Pa).
4.4 Plastic yield stress
The plastic yield stress is measured using the same series of successive creep tests
10
used to characterize the elastic shear modulus. When the imposed shear stress reaches or overcomes the plastic yield stress, deformation becomes rapidly much larger and it continues during the entire creep step, allowing the rheometer to mea-sure a shear rate.
We qualitatively characterized the softening/hardening behavior using the creep test
15
during which failure occurred. In this creep test, the shear stress is constant and is equal to the yield stress. We observed that the strain increase upon failure is best fitted with a degree-3 polynomial function (i.e. constant acceleration) which is characteristic of plastic softening (Shemenda, 1992). This allows us to affirm that our materials are softening and comparable to the materials developed by A. Chemenda employed in
20
earlier 2-D thermo-mechanical experiments (Chemenda et al., 2000; Boutelier et al., 2002, 2003, 2004; Boutelier and Chemenda, 2008). These materials have been shown to soften by 20 to 50% depending on temperature (Shemenda, 1992, 1993, 1994; Boutelier, 2004).
The rheological stratification of the model lithosphere prior to deformation is
ob-25
SED
3, 105–147, 20113-D
thermo-mechanical modelling
D. Boutelier and O. Oncken
Title Page
Abstract Introduction
Conclusions References
Tables Figures
◭ ◮
◭ ◮
Back Close
Full Screen / Esc
Printer-friendly Version Interactive Discussion
Discussion
P
a
per
|
Dis
cussion
P
a
per
|
Discussion
P
a
per
|
Discussio
n
P
a
per
|
presented experiments the lithosphere is made of one single mantle layer and there-fore the strength of one single material must be known. Figure 4 shows the variations of the plastic yield stress of our material for the temperatures 38 to 43◦C. However, in the presented experiments the surface temperature was 39◦C and the temperature of the asthenosphere was 42◦C. Within this temperature range the strength decreases
5
from 50 to 6 Pa (see inset in Fig. 4), which corresponds to a decrease from 5.7×10⁸to 6.8×10⁷Pa in nature.
4.5 Thermal diffusivity
The determination of the materials thermal diffusivity is fundamental since it condi-tioned the scaling of rate and time in the experiments. This parameter is measured
10
using a 1-D cooling approximation. A large sample is brought to a high temperature above the melting point and let to cool down. The heat loss is restricted to the upper surface only and the temperature is monitored at a known depth below the centre of the upper surface. In these conditions, a 1-D half-space cooling approximation is rea-sonable and the data can be fitted with the analytical solution (Turcotte and Schubert,
15
1982):
T(z,t)=Te+(Ti−Te)×erf
z
2√κt
(1)
whereT(z,t) is the temperature at depth z and time t,Te is the external temperature, Ti is the initial temperature and κ is the thermal diffusivity. For our compounds, the best fit is obtained with a thermal diffusivity of 2.8×10⁻⁸m2s−1(Fig. 5). Assuming that
20
the modeled rocks have a thermal diffusivity of 1×10⁻⁶m2s−1(Turcotte and Schubert, 1982), thenκ∗=2.8×10⁻²and a scaling factor for velocityV∗=Vm/Vn=κ∗/L∗=9.8× 104can be derived from the dimensionless ratio VL/κ. This scaling factor means that a natural subduction velocity of 8 cm yr−1 (i.e. 2.54×10⁻⁹m s−1) is 0.25 mm s−1 in the model. The scaling factor for time is thereforet∗=tm/tn=L∗/V∗=2.92×10−
12
, which
25
SED
3, 105–147, 20113-D
thermo-mechanical modelling
D. Boutelier and O. Oncken
Title Page
Abstract Introduction
Conclusions References
Tables Figures
◭ ◮
◭ ◮
Back Close
Full Screen / Esc
Printer-friendly Version Interactive Discussion
Discussion
P
a
per
|
Dis
cussion
P
a
per
|
Discussion
P
a
per
|
Discussio
n
P
a
per
|
5 Experimental apparatus
The experimental set-up comprises a polycarbonate tank 50×50×30 cm filled with wa-ter representing the asthenosphere (Fig. 1). The model lithospheric plates are built in a mold 40×40×6 cm. The experimental tank is sufficiently larger than the model plates (5 cm on each side) that the sides can be considered to be free. The experimental
5
set-up includes two new features that are presented here. The surface temperature is maintained without obstructing the view of the model surface for optical strain monitor-ing, and the horizontal convergence parallel force is measured at the back of the upper plate.
5.1 Particle imaging velocimetry and surface heating
10
A major difficulty with 3-D experimental models is monitoring the model deformation in its center. Because we wish to explore three-dimensional processes, the model is likely to include along-strike variations of the initial conditions which make the deformation process different in the center and along the sides. Therefore the model side views are not sufficient and it is necessary to monitor strain from the top. Precise spatio-temporal
15
strain monitoring is obtained using the Particle imaging velocimetry (PIV) technique (Hampel, 2004; Adam et al., 2005), a non-intrusive method for accurate measurement of instantaneous velocity/displacement field using an image correlation technique. Our PIV system is equipped with 10 megapixels cameras enabling a spatial resolution of the displacement below 0.1 mm while the temporal resolution is 0.1 s. However, in the
20
presented experiments the successive PIV images are taken at a time interval of 2 to 5 s, which is sufficient to monitor the slow model deformation (<0.25 mm s−1).
To obtain satisfactory measurements of the displacement, the PIV system requires an unobstructed view of the deforming surface and this surface must have a spe-cific pattern allowing small image sub-samples to be shifted incrementally in the
x-25
SED
3, 105–147, 20113-D
thermo-mechanical modelling
D. Boutelier and O. Oncken
Title Page
Abstract Introduction
Conclusions References
Tables Figures
◭ ◮
◭ ◮
Back Close
Full Screen / Esc
Printer-friendly Version Interactive Discussion
Discussion
P
a
per
|
Dis
cussion
P
a
per
|
Discussion
P
a
per
|
Discussio
n
P
a
per
|
the surface-area of the image sub-sample (Adam et al., 2005). To obtain this spe-cific pattern suitable for correlation technique, dark particles have been sifted on the model surface. The difficulty with the use of the PIV technique with thermo-mechanical models was to impose the surface temperatureTs while maintaining an unobstructed view of the model surface. We solved this problem using infrared emitters coupled to
5
a thermal probe and a thermo-regulator (Fig. 1). Four 250 V/250 W infrared emitters equipped with large diffusers are placed 60 cm above the 4 corners of the experimental tank and are oriented towards the center of the model surface. The infrared emitters do not produce any visible light and the PIV cameras do not see the emitted infrared waves. Therefore, the heating system is perfectly invisible to the PIV strain monitoring
10
system. The surface temperature is continuously measured by a thermal probe in one location and the temperature value is given to the thermo-regulator which, depending on the temperature difference between the set temperature and measured tempera-ture, adjusts the length of the pulses emitted by the infrared bulbs. This set-up allows having a surface temperature field that is relatively constant (±0.1◦C) in time and
homo-15
geneous (±0.2◦C) in space (Fig. 6). A similar system controls the temperature of the model asthenosphere, however the heating element is a simple 250 V/2000 W electric resistance placed at the bottom of the tank, as in previous thermo-mechanical exper-imental set-ups (Chemenda et al., 2000; Boutelier et al., 2002, 2003, 2004; Boutelier and Chemenda, 2008).
20
5.2 Force monitoring
In order to better understand the stress regime in the arc area during the processes of subduction and/or arc-continent collision, we placed a force sensor in the back of the upper plate. The upper plate rests against a vertical plate attached to the back-wall of the experimental tank via a 2.5 N force sensor. This set-up allows measuring
25
SED
3, 105–147, 20113-D
thermo-mechanical modelling
D. Boutelier and O. Oncken
Title Page
Abstract Introduction
Conclusions References
Tables Figures
◭ ◮
◭ ◮
Back Close
Full Screen / Esc
Printer-friendly Version Interactive Discussion
Discussion
P
a
per
|
Dis
cussion
P
a
per
|
Discussion
P
a
per
|
Discussio
n
P
a
per
|
during oceanic subduction. However, the measurement of the horizontal convergence-parallel stress is only really useful in a quantitative manner when the model is two-dimensional and the same process occurs at the same time across the width of the model. It is therefore best used in preliminary experiments such as presented in this study. The rational for placing this force measurement system is that the effects of some
5
parameter values (densities, temperatures) on the interplate stresses can be measured in two-dimensional experiments and then the same effects can be assumed in more complex three-dimensional models. Also since the force is measured by the same computer-controlled system that imposes the displacement, the system is technically capable of imposing a constant-force boundary condition as well. However, this feature
10
has not been fully tested yet and is therefore not further discussed in this study.
6 Results
6.1 Intra-oceanic subduction experiments
Intra-oceanic subduction experiments comprise two model lithospheric plates, each made of one single mantle layer. The overriding plate is 20×40×2 cm while the
sub-15
ducting plate is 25×40×2 cm. The plate boundary position and geometry are imposed and convergence is orthogonal to the direction of the trench. The experiments can thus be considered two-dimensional despite the relatively large model width. Sim-ple 2-D intra-oceanic experiments are performed for two principal reasons. First, the experiments are produced because the resulting scenarios are more predictable and
20
therefore these experiments allow testing the stress and strain monitoring capabilities of the experimental set-up. The second reason is that the normal stress measured at the back of the overriding plate can be more directly related to the stress conditions (σ and τ) exerted on the plate boundary, which depends on several parameters such as the density and flexural rigidity of the lower plate or the interplate friction. Here we
25
SED
3, 105–147, 20113-D
thermo-mechanical modelling
D. Boutelier and O. Oncken
Title Page
Abstract Introduction
Conclusions References
Tables Figures
◭ ◮
◭ ◮
Back Close
Full Screen / Esc
Printer-friendly Version Interactive Discussion
Discussion
P
a
per
|
Dis
cussion
P
a
per
|
Discussion
P
a
per
|
Discussio
n
P
a
per
|
In Experiment 1, the subducting lithophere is neutrally buoyant (ρl=ρa) and the plate boundary is lubricated (τ=0). Figure 7 shows the model surface photographs at various stages with the velocity vectors derived from the image correlation technique and the incremental (i.e. between 2 successive images) convergence-parallel normal strain (Exx). The PIV monitoring yields vectors that are very honogeneous in both
direc-5
tion and magnitude within the subducting plate (Fig. 7a–c). The model plate therefore moves as a quasi-rigid body. The upper plate does not move and is only slightly de-formed during subduction initiation (Fig. 7a). Therefore plate convergence is only acco-modated by sliding along the interplate zone. In the conditions of this experiment, the normal stress measured at the back of the upper plate is the horizontal compression
10
due to the flexural rigidity of the plate (Shemenda, 1993). During subduction initiation the stressσxx increases to a value of ∼12 Pa and then remains approximately at this level during the rest of the experiment (Fig. 8). This normal stress is due to the non-hydrostatic normal stressσn exerted on the plate boundary by the subducting plate
because it resists bending. Knowing the value of the normal stressσxxwithin the upper
15
plate we can estimate the horizontal component (Fp)hof the pressure forceFp. Since we also know the inclinationα, widthW and thicknessH of the plate, we can estimate the magnitude of the pressure forceFpand the depth-averaged non-hydrostatic normal stress ¯σn from which it derives (Fig. 10a):
(Fp)h=σxx×H×W =9.3×10⁻²N (2)
20
then
Fp=(Fp)h/cos(α)=1.08×10−1N (3)
and
¯ σn=
Fp×cos(α)
H×W =12 Pa (4)
Note that it is possible to increase or decrease the flexural rigidity of the subducting
25
SED
3, 105–147, 20113-D
thermo-mechanical modelling
D. Boutelier and O. Oncken
Title Page
Abstract Introduction
Conclusions References
Tables Figures
◭ ◮
◭ ◮
Back Close
Full Screen / Esc
Printer-friendly Version Interactive Discussion
Discussion
P
a
per
|
Dis
cussion
P
a
per
|
Discussion
P
a
per
|
Discussio
n
P
a
per
|
In Experiment 2, the subducting lithosphere is denser that the asthensphere by 4% Consequently, a slab pull force exerts a pull on the plate boundary which subtracts from the compression due the flexural rigidity. Also, since the viscosity of our model asthenosphere is very low and the trailing edge of the plate is fixed, the negative buoy-ancy of the subducting lithosphere leads to the formation of a very steep slab (Fig. 9).
5
In this experiment, we also increased the interplate friction by sifting a small amount of sand grains at the surface of the subducting plate. Therefore, the normal stress σxx recorded at the back of the upper plate reflects the sum of the compression due the flexural rigidity, the tension due to the slab pull and the compression due to the increased friction. Of these 3 key parameters, only one is known from Experiment 1.
10
However, the effects of the slab negative buoyancy and high interplate friction evolve differently in time. At the begining of the experiment, the effect of the slab pull force is minor because the slab is not developped yet. Consequently we recorded a normal stress σxx that is larger than that recorded in Experiment 1 (Fig. 8). Assuming that the effect of the sab pull force can be neglected at the begining of the experiment, the
15
stress difference between experiments 1 and 2 must be due to the increased friction. We can therefore estimate the horizontal component of the friction forceFf(Fig. 10c):
(Ff)h=σxx×H×W−(Fp)h (5)
then
Ff=(Ff)h/sin(α)=1.16×10−1N (6)
20
and finally the depth-averaged shear stress
¯
τ=Ff×cos(α)
W×H =13 Pa (7)
After a short plateau, the recorded normal stressσxx decreases and it keeps decreas-ing until the end of the experiment. The steep geometry of the subducted slab (Fig. 9) reveals that the decrease of the horizontal compression is due to the slab pull force
SED
3, 105–147, 20113-D
thermo-mechanical modelling
D. Boutelier and O. Oncken
Title Page
Abstract Introduction
Conclusions References
Tables Figures
◭ ◮
◭ ◮
Back Close
Full Screen / Esc
Printer-friendly Version Interactive Discussion
Discussion
P
a
per
|
Dis
cussion
P
a
per
|
Discussion
P
a
per
|
Discussio
n
P
a
per
|
exerted by the subducting slab on the interplate zone. In the presented experiment the horizontal stress becomes very close to zero near the end of the experiment. In other similar experiments it has been possible to obtain a tension. However, the magnitude of the tension cannot be very large because the plates are not strongly attached to the piston and back-wall and would, under the effect of a large tension, detach and move
5
towards the center of the experimental tank. σxx is due to the combined effects of the horizontal component of the pressure force due to the slab negative buoyancy (Fp2), the horizontal components of the pressure force due to flexural rigidity (Fp1) and the friction force (Ff):
σxx×H×W = (Fp1)h+(Ff)h−(Fp2)h (8)
10
We estimate the pressure force due to the slab negative buoyancyFp2 (Fig. 10b):
Fp2 = (Fp2)h/cos(α) = −2.24×10⁻¹N (9)
and the associated depth-averaged non-hydrostatic normal stress ¯σn
¯ σn=
Fp2×cos(α)
H×W =−25 Pa (10)
The presented data clearly show that (1) the experimental apparatus allows
model-15
ing plates which move with little/no internal deformation, (2) the monitoring technique allows precise spatial resolution of model deformation, and (3) the measured stress allows defining 3 end-member subduction regimes characterised respectively by com-pression due to the bending strength of the subducting plate, tension due to the nega-tive buoyancy of this plate and compression due to the interplate friction (Fig. 10).
20
6.2 Forced subduction initiation experiment
SED
3, 105–147, 20113-D
thermo-mechanical modelling
D. Boutelier and O. Oncken
Title Page
Abstract Introduction
Conclusions References
Tables Figures
◭ ◮
◭ ◮
Back Close
Full Screen / Esc
Printer-friendly Version Interactive Discussion
Discussion
P
a
per
|
Dis
cussion
P
a
per
|
Discussion
P
a
per
|
Discussio
n
P
a
per
|
length which runs across the entire plate’s width. In the notch the plate thickness is only 2 cm. It constitutes a weak zone in the model lithosphere because the thickness is reduced, and the thermal gradient is higher, which makes the model lithosphere at shallow depth above the notch weaker than elsewhere in the model. The model plate is shortened at the same constant rate as in Experiments 1 and 2, which results
5
in deformation of the plate near the notch and finally the formation of a subduction zone (Fig. 11). We do not pretend that the presented mechanism is at play in nature during subduction initiation. This experiment is realized in order to observe how strain localization due to plastic strain-softening can lead to the formation of a lithospheric-scale shear zone in our model lithosphere. Furthermore, we use this experiment to
10
illustrate how the PIV system allows having a precise monitoring of when the various deformation structures are active.
The experiment being two-dimensional is also monitored from the side. Successive side views revealed that shortening is accommodated by two conjugate shear zones nucleated from the roof of the notch and resulting in the formation of a pop-up above it
15
(Fig. 11a). With further shortening, the shear zone located left of the notch becomes dominant, accommodates most of the shortening and thus forms a new subduction zone (Fig. 11b–f). However, the side views also reveal that both plates underwent some shortening near both the piston and the back-wall (Fig. 11b).
The PIV monitoring of the model surface allows us to describe more precisely the
20
evolution of model deformation in space and time. Shortening indeed started with the formation of two oppositely dipping shear zones around the notch (Fig. 12a). However, before the shear zone on the left side of the notch became dominant, another shear zone is also created near the back-wall (Fig. 12a). At this point, none of the shear zones appear to run entirely across the width of the model plate. Shortening is
accom-25
SED
3, 105–147, 20113-D
thermo-mechanical modelling
D. Boutelier and O. Oncken
Title Page
Abstract Introduction
Conclusions References
Tables Figures
◭ ◮
◭ ◮
Back Close
Full Screen / Esc
Printer-friendly Version Interactive Discussion
Discussion
P
a
per
|
Dis
cussion
P
a
per
|
Discussion
P
a
per
|
Discussio
n
P
a
per
|
laterally (Fig. 12b). It is a biggest advantage of using the PIV technique to be able tell when, during the experiment, a structure becomes inactive and when another one be-comes active or more important. Shortening bebe-comes accommodated by fewer and fewer structures as strain weakens the material. Finally the shear zone located near the back-wall also becomes inactive (Fig. 12c) and shortening becomes solely
accom-5
modated by one shear zone which becomes a new subduction zone (Fig. 12c–d). The strain localization process is accompanied by a diminution of the stress recorded at the back of the upper plate once the main fault zone runs across the entire model width and has recorded sufficient strain to be significantly weakened (Fig. 13). The recorded diminution is also due to the fact that, since the mantle lithosphere material is slightly
10
denser than the asthenosphere, the formation of a slab leads to a slab pull force whose action diminishes the horizontal compression.
7 Discussion
7.1 A framework for modelling lithospheric plates interactions in convergent setting
15
The modelling framework presented in this study, with its set of simplifications and assumptions, is designed to investigate the three-dimensional thermo-mechanical in-teractions between lithospheric plates. Targeted geodynamic problems include the lateral (i.e. along trench) propagation of an arc-continent collision (e.g. Taiwan, Timor, Papua New Guinea) or the deformation of the fore-arc/arc/back-arc along a curved
20
plate boundary (e.g. Central Andes). In collision zones, the deformation of the litho-sphere is three-dimensional and controlled by the stress conditions exerted on the plate boundary (i.e. non-hydrostatic normal stress and shear traction). In order to bet-ter understand such complex three-dimensional situations, scaled three-dimensional modelling of the lithospheric plates interaction is required. Furthermore, since the
tar-25
SED
3, 105–147, 20113-D
thermo-mechanical modelling
D. Boutelier and O. Oncken
Title Page
Abstract Introduction
Conclusions References
Tables Figures
◭ ◮
◭ ◮
Back Close
Full Screen / Esc
Printer-friendly Version Interactive Discussion
Discussion
P
a
per
|
Dis
cussion
P
a
per
|
Discussion
P
a
per
|
Discussio
n
P
a
per
|
and/or lithosphere and hence significant temperature variations, it is important that the modelling framework includes the spatial and temporal strength variations associated with temperature changes.
The presented experiments are large but two-dimensional models since we did not implement any lateral (i.e. along-strike) variations of the model structure, mechanical
5
properties or any other initial or boundary conditions. We presented large 2-D mod-els because such simpler modmod-els allow us to introduce the key parameters controlling the solid-mechanics interaction of the lithospheric plates during the process of oceanic subduction. Furthermore, these simple experiments permit detailing the advantages and limitations of our approximations and modelling set-up. However, the new
appara-10
tus clearly has the potential for modelling the above mentioned 3-D geodynamic prob-lems.The present study should therefore be seen as a first step in a series designed to study such 3-D processes, rather than the final step.
7.2 Quantitative stress and strain monitoring
One key advantage of the employed experimental setup is the ability to precisely
moni-15
tor the model deformation from above using the 2-D PIV technique. Because we aim at producing complex 3-D models, we cannot rely of side observations of the model as in previous 2-D thermo-mechanical experiments (Boutelier et al., 2002, 2003, 2004). The high spatial and temporal resolution of the PIV technique allows more precise monitor-ing of the model deformation than conventional strain marker analysis (Boutelier and
20
Cruden, 2008). Theoretically it is also possible to monitor the vertical displacement of the model surface using 2 cameras providing a stereoscopic view of the model surface (Adam et al., 2005; Riller et al., 2010). This new advance in monitoring technique would be very advantageous because the vertical motion of the model surface can be linked to the distribution of stresses along the plate boundary (Shemenda, 1992), compared
25
SED
3, 105–147, 20113-D
thermo-mechanical modelling
D. Boutelier and O. Oncken
Title Page
Abstract Introduction
Conclusions References
Tables Figures
◭ ◮
◭ ◮
Back Close
Full Screen / Esc
Printer-friendly Version Interactive Discussion
Discussion
P
a
per
|
Dis
cussion
P
a
per
|
Discussion
P
a
per
|
Discussio
n
P
a
per
|
2010), short-term uplift/subsidence derived from GPS/Coral reefs dating (Taylor et al., 2005; Matsu’ura et al., 2008, 2009) or gravity anomalies (Shemenda, 1992; Song and Simons, 2003). However, the produced topography is very small (∼1–2 mm) and the distribution of passive markers is not sufficently large to permit reliable stereoscopic imaging and therefore vertical motions. A possible workaround would be to employ a
5
three-dimensional video laser to scan the model surface at regular time intervals dur-ing the experiment and convert the data to digital elevation models (Willdur-ingshofer et al., 2005; Willingshofer and Sokoutis, 2009; Cruden et al., 2006; Pysklywec and Cruden, 2004; Luth et al., 2010). The strain monitoring system in its present development al-lows precise spatio-temporal resolution of the 2-D deformation of the model surface.
10
This allows tracking when, during the experiment, the various deformation structures are active. Coupled with a stress monitoring and the ability to produce vertical sections through the frozen model in the end of the experiment (Boutelier et al., 2002, 2004; Boutelier and Chemenda, 2008), the strain monitoring system provides the required data to understand how stress and strain develop in the model.
15
Furthermore, the stress monitoring system allows investigating parameters that con-trol the subduction regime in two-dimensional experiments and then the same effects can be assumed in more complex three-dimensional models. For example, kinematic models of the Andes show that trench-parallel coaxial shortening existed in the center of the plate boundary curvature while the Andes were built (Kley, 1999; Hindle et al.,
20
2002, 2005; Oncken et al., 2006; Arriagada et al., 2008; Gotberg et al., 2009). Two-dimensional numerical simulations reveal that trench-parallel compression is produced near the symmetry axis of a seaward-concave plate boundary if interplate friction is high and/or the subducting lithosphere has a low flexural rigidity (Boutelier and Oncken, 2010). In contrast, trench-parallel compression is reduced along the oblique parts of
25
SED
3, 105–147, 20113-D
thermo-mechanical modelling
D. Boutelier and O. Oncken
Title Page
Abstract Introduction
Conclusions References
Tables Figures
◭ ◮
◭ ◮
Back Close
Full Screen / Esc
Printer-friendly Version Interactive Discussion
Discussion
P
a
per
|
Dis
cussion
P
a
per
|
Discussion
P
a
per
|
Discussio
n
P
a
per
|
develops in the centre of the curvature, it is necessary to produce 3-D modelling with the proper stress conditions along the plate boundary. In the experiments presented in this study, we have explored some parameters that control the stress conditions along the plate boundary. In experiment 1, the non-hydrostatic normal stress is high (12 Pa equivalent to∼120 MPa in Nature) because the subducted slab is neutrally buoyant.
5
To favor trench-parallel coaxial shortening in the centre of the curvature we should therefore rather use a denser material to model the subducted lithosphere. As pre-sented in Experiment 2, the effect of the slab pull force due to the negative buoyancy of the subducted lithosphere is to reduce the non-hydrostatic normal stress. However, the density should not be too high or trench-perpendicular tension would be produced.
10
Finally, we can increase the interplate friction and thus the shear traction acting on the interplate zone. In Experiment 2 the depth-averaged shear traction was 13 Pa (equiv-alent to∼130 MPa in Nature), which is very high and would therefore likely produce deformation of the thinner, hotter and hence weaker arc/back-arc (Currie and Hynd-man, 2006; Currie et al., 2008). However, the shear traction would have to be imposed
15
on the upper shallow part of the plate boundary where the contact between the plates is seismogenic and thus frictional. It is therefore possible, using simple two-dimensional experiments as presented in this study, to tune the value of some parameters such as the density or thickness of the subducted plate, or the interplate friction, in order to produce a specific subduction regime characterized by its stress conditions on the
20
interplate zone. The effect of a specific subduction regime can then be tested in 3-D experiments where the 3-D geometry of the plate boundary (i.e. dip angle and conver-gence obliquity angle) can be changed.
8 Conclusions
We demonstrated, in this study, the potential of a newly developed
three-25
SED
3, 105–147, 20113-D
thermo-mechanical modelling
D. Boutelier and O. Oncken
Title Page
Abstract Introduction
Conclusions References
Tables Figures
◭ ◮
◭ ◮
Back Close
Full Screen / Esc
Printer-friendly Version Interactive Discussion
Discussion
P
a
per
|
Dis
cussion
P
a
per
|
Discussion
P
a
per
|
Discussio
n
P
a
per
|
deformation of the fore-arc, arc and back-arc along a seaward-concave plate boundary such as in the central Andes. The deformation near the symmetry axis is fundamen-tal three-dimensional with both trench-parallel and trench-normal coaxial shortening (Kley, 1999; Hindle et al., 2002, 2005; Arriagada et al., 2008), and is most likely due to the stress conditions along the plate boundary. We have shown that we can, using
5
simple two-dimensional experiments, estimate these stress conditions in our analogue models. Furthermore, varying some parameter values such as bending strength, and relative buoyancy of the lower plate or the interplate friction, we can control these stress conditions along the plate boundary and impose them in three-dimensional models.
We also demonstrated that the deformation resulting from these imposed stress
con-10
ditions on the interplate zone can be precisely monitored using the PIV system. The strain monitoring system allows characterization and quantification of horizontal de-formation (i.e.Exx, Eyy, Exy and Eyx), while model sections after deformation provide access to the final vertical deformation (i.e. amount of thinning or thickening in vertical sectionEzz). Furthermore, the high spatial and temporal resolution of the PIV system
15
allows tracking the propagation of the deformation. Such feature is particularly useful for investigating arc-continent or continent-continent collisions, which generally initiate in one location and propagate laterally along the plate boundary, as in Taiwan (Suppe, 1984), Timor (Searle and Stevens, 1984; Harris, 2011), or the Urals (Puchkov, 2009).
The modelling framework presented in details in this study and including new
20
temperature-sensitive elasto-plastic analogue material as well as a new modelling ap-paratus with force monitoring and precise strain monitoring as the potential to be the foundation for multiple investigations into the complex 3-D interactions between litho-spheric plate.
Acknowledgements. We thank Matthias Rosenau, Frank Neumann and Thomas Ziegenhagen 25
SED
3, 105–147, 20113-D
thermo-mechanical modelling
D. Boutelier and O. Oncken
Title Page
Abstract Introduction
Conclusions References
Tables Figures
◭ ◮
◭ ◮
Back Close
Full Screen / Esc
Printer-friendly Version Interactive Discussion
Discussion
P
a
per
|
Dis
cussion
P
a
per
|
Discussion
P
a
per
|
Discussio
n
P
a
per
|
References
Adam, J., Urai, J. L., Wieneke, B., Oncken, O., Pfeiffer, K., Kukowski, N., Lohrmann, J., Hoth, S., Van Der Zee, W., and Schmatz, J.: Shear localisation and strain distribution during tec-tonic faulting, New insights from granular-flow experiments and high-resolution optical image correlation techniques, J. Struct. Geol., 27, 283–301, 2005. 107, 115, 116, 123
5
Anderson, D. L.: Lithosphere, asthenosphere, and perisphere, Rev. Geophys., 33, 125–149, doi:10.1029/94RG02785, 1995. 108
Arriagada, C., Roperch, P., Mpodozis, C., and Cobbold, P. R.: Paleogene building of the Bolivian Orocline: Tectonic restoration of the central Andes in 2-D map view, Tectonics, 27, TC6014, doi:10.1029/2008TC002269, 2008. 124, 126
10
Bellahsen, N., Faccenna, C., Funiciello, F., Daniel, J., and Jolivet, L.: Why did Arabia separate from Africa? Insights from 3-D laboratory experiments, Earth Planet. Sci. Lett., 216, 365– 381, doi:10.1016/S0012-821X(03)00516-8, 2003. 106
Bird, P., Liu, Z., and Rucker, W. K.: Stresses that drive the plates from below: Definitions, computational path, model optimization, and error analysis, J. Geophys. Res., 113, B11406, 15
doi:10.1029/2007JB005460, 2008. 108
Bokelmann, G. H. R. and Silver, P. G.: Shear stress at the base of shield lithosphere, Geophys. Res. Lett., 29(23), 6–9, doi:10.1029/2002GL015925, 2002. 108
Bonnardot, M., Hassani, R., and Tric, E.: Numerical modelling of lithosphereastheno-sphere interaction in a subduction zone, Earth Planet. Sci. Lett., 272, 698–708, 20
doi:10.1016/j.epsl.2008.06.009, 2008a. 108, 123
Bonnardot, M. A., Hassani, R., Tric, E., Ruellan, E., and R ´egnier, M.: Effect of margin curvature on plate deformation in a 3-D numerical model of subduction zones, Geophys. J. Int., 173, 1084–1094, 2008b. 123
Boutelier, D.: 3-D thermo-mechanical laboratory modelling of continental subduction and ex-25
humation of UHP/LT rocks, Ph.D. thesis, Universtite de Nice-Sophia Antipolis, Nice, France, 2004. 113
Boutelier, D. and Chemenda, A.: Exhumation of UHP/LT rocks due to the local reduction of the interplate pressure: Thermo-mechanical physical modelling, Earth Planet. Sci. Lett., 271, 226–232, doi:10.1016/j.epsl.2008.04.011, 2008. 107, 113, 116, 124
30
SED
3, 105–147, 20113-D
thermo-mechanical modelling
D. Boutelier and O. Oncken
Title Page
Abstract Introduction
Conclusions References
Tables Figures
◭ ◮
◭ ◮
Back Close
Full Screen / Esc
Printer-friendly Version Interactive Discussion
Discussion
P
a
per
|
Dis
cussion
P
a
per
|
Discussion
P
a
per
|
Discussio
n
P
a
per
|
113, 116, 123, 124
Boutelier, D., Chemenda, A., and Burg, J.-P.: Subduction versus accretion of intra-oceanic volcanic arcs: insight from thermo-mechanical analogue experiments, Earth Planet. Sci. Lett., 212, 31–45, doi:10.1016/S0012-821X(03)00239-5, 2003. 107, 113, 116, 123
Boutelier, D., Chemenda, A., and Jorand, C.: Continental subduction and exhumation of high-5
pressure rocks: insights from thermo-mechanical laboratory modelling, Earth Planet. Sci. Lett., 222, 209–216, doi:10.1016/j.epsl.2004.02.013, 2004. 107, 113, 116, 123, 124
Boutelier, D., Schrank, C., and Cruden, A.: Power-law viscous materials for analogue exper-iments: New data on the rheology of highly-filled silicone polymers, J. Struct. Geol., 30, 341–353, doi:10.1016/j.jsg.2007.10.009, 2008. 113
10
Boutelier, D. A. and Cruden, A. R.: Impact of regional mantle flow on subducting plate geom-etry and interplate stress: insights from physical modelling, Geophys. J. Int., 174, 719–732, doi:10.1111/j.1365-246X.2008.03826.x, 2008. 123
Boutelier, D. A. and Oncken, O.: Role of the plate margin curvature in the plateau buildup: Con-sequences for the central Andes, J. Geophys. Res., 115, 1–17, doi:10.1029/2009JB006296, 15
2010. 124
Brace, W. F. and Kohlstedt, D. L.: Limits on Lithospheric Stress Imposed by Laboratory Experi-ments, J. Geophys. Res., 85, 6248–6252, doi:10.1029/JB085iB11p06248, 1980. 108 Buckingham, E.: On physically similar systems; Illustrations of the use of dimensional
equa-tions, Phys. Rev., 4, 345–376, 1914. 109 20
Byerlee, J.: Friction of rocks, Pure Appl. Geophys., 116, 615–626, 1978. 108
Chemenda, A., Burg, J.-P., and Mattauer, M.: Evolutionary model of the Himalaya Tibet system: geopoem based on new modelling, geological and geophysical data, Earth Planet. Sci. Lett., 174, 397–409, doi:10.1016/S0012-821X(99)00277-0, 2000. 107, 110, 113, 116
Cruden, A. R., Nasseri, M. H. B., and Pysklywec, R.: Surface topography and internal strain 25
variation in wide hot orogens from three-dimensional analogue and two-dimensional numer-ical vice models, Geolognumer-ical Society of London Special Publications 253, London, 79–104, 2006. 106, 107, 124
Currie, C. A. and Hyndman, R. D.: The thermal structure of subduction zone back arcs, J. Geophys. Res., 111, B08404, doi:10.1029/2005JB004024, 2006. 125
30
SED
3, 105–147, 20113-D
thermo-mechanical modelling
D. Boutelier and O. Oncken
Title Page
Abstract Introduction
Conclusions References
Tables Figures
◭ ◮
◭ ◮
Back Close
Full Screen / Esc
Printer-friendly Version Interactive Discussion
Discussion
P
a
per
|
Dis
cussion
P
a
per
|
Discussion
P
a
per
|
Discussio
n
P
a
per
|
Davy, P. and Cobbold, P. R.: Experiments on shortening of a 4-layer model of the continental lithosphere, Tectonophysics, 188, 1–25, 1991. 106, 109
Dziewoski, A. M. and Anderson, D. L.: Preliminary reference Earth model*, Phys. Earth Planet. Int., 25, 297–356, 1981. 110
Evans, B. and Kohlstedt, D.: Rheology of rocks, AGU, Washington, DC, 2139, 148–165, 1995. 5
108
Funiciello, F., Faccenna, C., Giardini, D., and Regenauer-Lieb, K.: Dynamics of retreating slabs: 2. Insights from three-dimensional laboratory experiments, J. Geophys. Res., 108, 2207, doi:10.1029/2001JB000896, 2003. 106
Goetze, C. and Evans, B.: Stress and temperature in the bending lithosphere as constrained 10
by experimental rock mechanics, Geophys. J. Roy. Astr. S., 59, 463–478, doi:10.1016/0148-9062(80)91167-5, 1979. 108
Gotberg, N., McQuarrie, N., and Caillaux, V. C.: Comparison of crustal thickening budget and shortening estimates in southern Peru (12–14◦S): Implications for mass balance and
rota-tions in the “Bolivian orocline”, Geol. Soc. Am. Bull., 122, 727–742, doi:10.1130/B26477.1, 15
2009. 124
Hampel, A.: Response of the tectonically erosive south Peruvian forearc to subduction of the Nazca Ridge: Analysis of three-dimensional analogue experiments, Tectonics, 23, 1–22, doi:10.1029/2003TC001585, 2004. 107, 115
Harris, R.: The Nature of the Banda Continent Collision in the Timor Region, in: Arc-20
continent collision: The making of an orogen, edited by: Brown, D. and Ryan, P., Front. Earth Sci., Springer, 2011. 126
Hartley, A. J. and Evenstar, L.: Cenozoic stratigraphic development in the north Chilean fore-arc : Implications for basin development and uplift history of the Central Andean margin, Tectonophysics, 495, 67–77, doi:10.1016/j.tecto.2009.05.013, 2010. 123
25
Hartz, E. and Podladchikov, Y.: Toasting the jelly sandwich: The effect of shear heating on lithospheric geotherms and strength, Geology, 36, 331–334, doi:10.1130/G24424A.1, 2008. 109
Hassani, R., Jongmans, D., and Ch ´ery, J.: Study of plate deformation and stress in subduction processes using two-dimensional numerical models, J. Geophys. Res., 102, 17951–17965, 30
1997. 123
SED
3, 105–147, 20113-D
thermo-mechanical modelling
D. Boutelier and O. Oncken
Title Page
Abstract Introduction
Conclusions References
Tables Figures
◭ ◮
◭ ◮
Back Close
Full Screen / Esc
Printer-friendly Version Interactive Discussion
Discussion
P
a
per
|
Dis
cussion
P
a
per
|
Discussion
P
a
per
|
Discussio
n
P
a
per
|
doi:10.1029/2001GL013757, 2002. 124, 126
Hindle, D., Kley, J., Oncken, O., and Sobolev, S.: Crustal balance and crustal flux from shortening estimates in the Central Andes, Earth Planet. Sci. Lett., 230, 113–124, doi:10.1016/j.epsl.2004.11.004, 2005. 124, 126
Hoth, S., Adam, J., Kukowski, N., and Oncken, O.: Influence of erosion on the kinematics 5
of bivergent orogens: Results from scaled sandbox simulations, Geol. S. Am. S. 398, 303, 201–225, doi:10.1130/2006.2398(12), 2006. 107
Hoth, S., Hoffmann-Rothe, A., and Kukowski, N.: Frontal accretion: An internal clock for bivergent wedge deformation and surface uplift, J. Geophys. Res., 112, 1–17, doi:10.1029/2006JB004357, 2007. 107
10
Hoth, S., Kukowski, N., and Oncken, O.: Distant effects in bivergent orogenic belts, How retro-wedge erosion triggers resource formation in pro-foreland basins, Earth Planet. Sci. Lett., 273, 28–37, doi:10.1016/j.epsl.2008.05.033, 2008. 107
James, T. S., Gowan, E. J., Wada, I., and Wang, K.: Viscosity of the asthenosphere from glacial isostatic adjustment and subduction dynamics at the northern Cascadia subduction 15
zone, British Columbia, Canada, J. Geophys. Res., 114, 1–13, doi:10.1029/2008JB006077, 2009. 108
Kley, J.: Geologic and geometric constraints on a kinematic model of the Bolivian orocline, J. S. Am. Earth Sci., 12, 221–235, doi:10.1016/S0895-9811(99)00015-2, 1999. 124, 126 Kohlstedt, D., Evans, B., and Mackwell, S.: Strength of the lithosphere: Constraints imposed 20
by laboratory experiments, J. Geophys. Res, 100, 17587–17602, 1995. 108
Luj ´an, M., Rossetti, F., Storti, F., and Ranalli, G.: Flow trajectories in analogue vis-cous orogenic wedges: Insights on natural orogens, Tectonophysics, 484, 119–126, doi:10.1016/j.tecto.2009.09.009, 2010. 107
Luth, S., Willingshofer, E., Sokoutis, D., and Cloetingh, S.: Analogue modelling of continen-25
tal collision: Influence of plate coupling on mantle lithosphere subduction, crustal deforma-tion and surface topography, Tectonophysics, 484, 87–102, doi:10.1016/j.tecto.2009.08.043, 2010. 106, 107, 124
Matsu’ura, T., Furusawa, A., and Saomoto, H.: Late Quaternary uplift rate of the northeastern Japan arc inferred from fluvial terraces, Geomorphology, 95, 384–397, 30
doi:10.1016/j.geomorph.2007.06.011, 2008. 123, 124
SED
3, 105–147, 20113-D
thermo-mechanical modelling
D. Boutelier and O. Oncken
Title Page
Abstract Introduction
Conclusions References
Tables Figures
◭ ◮
◭ ◮
Back Close
Full Screen / Esc
Printer-friendly Version Interactive Discussion
Discussion
P
a
per
|
Dis
cussion
P
a
per
|
Discussion
P
a
per
|
Discussio
n
P
a
per
|
doi:10.1016/j.yqres.2008.12.005, 2009. 123, 124
Mitrovica, J. and Forte, A.: A new inference of mantle viscosity based upon joint inversion of convection and glacial isostatic adjustment data, Earth Planet. Sci. Lett., 225, 177–189, doi:10.1016/j.epsl.2004.06.005, 2004. 108
Mont ´esi, L. and Zuber, M.: A unified description of localization for application to large-scale 5
tectonics, J. Geophys. Res., 107, B3, doi:10.1029/2001JB000465, 2002. 109
Oncken, O., Hindle, D., Kley, J., Elger, K., Victor, P., and Schemmann, K.: Deformation of the Central Andean Upper Plate System, Facts, Fiction, and Constraints for Plateau Models, in: The Andes – Active Subduction Orogeny, edited by: Oncken, O., Chong, G., Franz, G., Giese, P., G ¨otze, H.-J., Ramos, V., Strecker, M., and Wigger, P., Springer, Frontiers in Earth 10
Sciences, 1–23, 2006. 124
Poirier, J. P.: Shear localization and shear instability in materials in the ductile field, J. Struct. Geol., 2, 135–142, 1980. 109
Puchkov, V. N.: The diachronous (step-wise) arccontinent collision in the Urals, Tectonophysics, 479, 175–184, doi:10.1016/j.tecto.2009.01.014, 2009. 126
15
Pysklywec, R. N. and Cruden, A.: Coupled crust-mantle dynamics and intraplate tectonics: Two-dimensional numerical and three-dimensional analogue modeling, Geochem. Geophys. Geosys., 5, Q10003, doi:10.1029/2004GC000748, 2004. 124
Ramberg, H.: Gravity, deformation and the earth’s crust: as studied by centrifuged models, Academic P., London, New York, 1967. 109
20
Ranalli, G.: Rheology of the lithosphere in space and time, Geological Society, London, Special Publications, 121, 19–37, doi:10.1144/GSL.SP.1997.121.01.02, 1997. 108
Ranalli, G. and Murphy, D. C.: Rheological stratification of the lithosphere, Tectonophysics, 132, 281–295, 1987. 108
Riller, U., Boutelier, D., Schrank, C., and Cruden, A. R.: Role of kilometer-scale weak cir-25
cular heterogeneities on upper crustal deformation patterns: Evidence from scaled ana-logue modeling and the Sudbury Basin, Canada, Earth Planet. Sci. Lett., 297, 587–597, doi:10.1016/j.epsl.2010.07.009, 2010. 123
Rossetti, F., Faccenna, C., Ranalli, G., and Storti, F.: Convergence rate-dependent growth of experimental viscous orogenic wedges, Earth Planet. Sci. Lett., 178, 367–372, 2000. 107 30