Angular-planar CMB power spectrum
Thiago S. Pereira*Instituto de Fı´sica Teo´rica, UNESP-Universidade Estadual Paulista, Caixa Postal 70532-2, 01140-070, Sa˜o Paulo, Brasil
L. Raul Abramo†
Instituto de Fı´sica, Universidade de Sa˜o Paulo, CP 66318, 05314-970, Sa˜o Paulo, Brasil (Received 15 July 2009; published 18 September 2009)
Gaussianity and statistical isotropy of the Universe are modern cosmology’s minimal set of hypotheses. In this work we introduce a new statistical test to detect observational deviations from this minimal set. By defining the temperature correlation function over the whole celestial sphere, we are able to independently quantify bothangularandplanardependence (modulations) of the CMB temperature power spectrum over different slices of this sphere. Given that planar dependence leads to further modulations of the usual angular power spectrumC‘, this test can potentially reveal richer structures in the morphology of the primordial temperature field. We have also constructed an unbiased estimator for this angular-planar power spectrum which naturally generalizes the estimator for the usualC‘’s. With the help of a chi-square analysis, we have used this estimator to search for observational deviations of statistical isotropy in WMAP’s 5 year release data set (ILC5), where we found only slight anomalies on the angular scales‘¼7 and‘¼8. Since this angular-planar statistic is model-independent, it is ideal to employ in searches of statistical anisotropy (e.g., contaminations from the galactic plane) and to characterize non-Gaussianities.
DOI:10.1103/PhysRevD.80.063525 PACS numbers: 98.80. k, 98.70.Vc, 98.80.Es
I. INTRODUCTION
Many efforts have been made toward understanding the statistical properties of the cosmic microwave background (CMB) temperature field in the past few years. The main motivation behind these efforts is that, in a homogeneous and isotropic universe in which inflation is driven by a single canonical scalar field, the primordial temperature field is set by Gaussian and statistically isotropic physical processes. Since nonlinear evolution destroys all these putative initial Gaussianities, we must search for any fun-damental deviations from these statistical properties at early epochs and as close as possible to the linear regime. This makes the CMB the ideal physical observable to employ in searches of statistical anisotropies and non-Gaussianities. Any significant observational deviation from this picture could reveal something as yet unsus-pected about the basic nature of our Universe.
While this program seems to be well motivated by itself, careful analysis of recent temperature maps obtained by the WMAP team [1–3] have hinted at some apparent anomalies—mainly in the low multipoles sector [4–8]. If one leaves aside for a moment the perennial problem ofa posterioristatistics [9], these findings raise the possibility that the anomalies could be a first hint toward some new physics. Theoretical attempts to explain their origin in-clude primordial magnetic fields [10], nontrivial cosmic topologies [11,12], globally anisotropic models of the early
Universe [13–16] as well as local manifestations of cosmic anisotropy [17], and even anisotropic models of dark en-ergy [18,19]. Of course, there is a good chance that these anomalies are due to astrophysical effects [20] or even some residual instrumental cross-contamination, in which case our Universe can still be easily accommodated in the standard scenario. It is a question of utmost concern to decide whether these known anomalies (as well as others which may be found in the future) are isolated statistical flukes, or if they are due to new physical/astrophysical effects.
Despite its importance and the efforts spent on it, we still have no compelling explanation for the nature of the low-‘ anomalies. The main difficulty is twofold: first, we still do not know how to optimally separate the question of Gaussianity from that of statistical isotropy (see however [21] for a first step in this direction.) It is thus possible that our Universe is Gaussian but statistically anisotropic, sta-tistically isotropic but non-Gaussian, or even non-Gaussian and anisotropic. Second, if the Universe is neither Gaussian nor statistically isotropic, then it can be—from a statistical point of view—virtually anything: there is only one kind of Gaussianity and isotropy, but there are infinite ways to brake either one. The absence of theoretical guide-lines will inevitably lead to an infinite number of models and no underlying symmetries, which still would mean that we could not account for confirmed anomalies.
This means we must analyze the problem in as much a model-independent manner as possible. We can, for ex-ample, start from the very basic definition of our statistical quantities (such as the two-point correlation function)
and check whether they can be modified in a model-independent manner, basing our reasoning solely on physi-cal symmetries and observational hints.
One such possibility is to consider the two-point tem-perature correlation function, Cðn^1;n^2Þ, without some
of the symmetries of the underlying space-time. Attempts in this direction have been made by Pullen and Kamionkowski [22], where the temperature correlation function is assumed to depend on the direction of any given unit vector in the celestial sphere, in such a way that one can search for power multipole moments in tem-perature maps. However, that approach consists of consid-ering the temperature correlation function at zero lag, and thus it does not allow us to consider correlations between two different points in the sky.
Another possibility is to consider the correlation func-tion in its full form, i.e., a funcfunc-tion that depends on all pairs of independent unit vectors in the sphere S2. This idea,
which was introduced by Hajian and Souradeep [23–25], consists in expanding the temperature correlation function in abipolarspherical harmonic series in order to take into account its functional dependence. The authors then con-struct a bipolar power spectrum‘ which can account for deviations from statistical anisotropy if observations give us‘>0at a statistically significant level. Unfortunately, that approach is too generic: it is not clear what the associated statistical test is measuring, nor how one can motivate it in the absence of an underlying theoretical or phenomenological model.
In this work we also go back to the two-point correlation functionCðn^1;n^2Þ, but instead ask whether it can depend
not only on the separation angle between two given unit vectors,cos# ¼n^1n^2, but also on the orientation of the
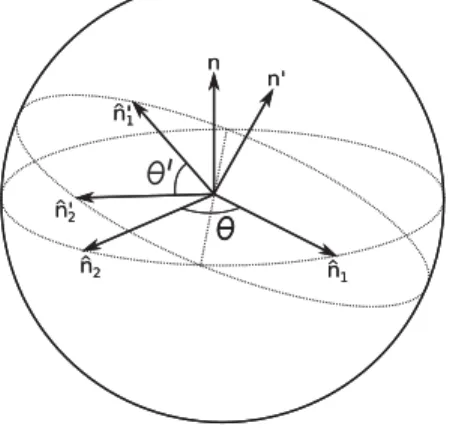
plane of the great circle defined by the unit vectors. Such a functional dependence can be unambiguously constructed once we realize that for any two unit vectors in the CMB sky, their angular separation and their associated plane are uniquely defined by their dot and cross products, respec-tively. The new planar dependence (on the direction de-fined by the normal to the planes of the two unit vectors) codifies modulations of the usual two-point correlation function as we rotate these planes while keeping the sepa-ration angles# fixed.
We have also constructed, in a completely model-independent way, an angular-planar power spectrum and its associated unbiased estimator, which naturally general-izes the usual angular power spectrumC‘, and for which we recover the known results in the limit of statistical isotropy.
Our approach has a strong observational motivation, which lies in the fact that some astrophysical planes, like the galactic and ecliptic ones, play an important role in CMB measurements and could still be manifested in the data if the foregrounds were improperly removed. One such example was possibly found in [26] where, besides
the alignment of the multipoles ‘¼2 and ‘¼3, the authors detected a strong correlation between these two and the ecliptic plane. The existence of a preferential plane could also be related to the so-called north-south asymme-try [5,8,27], in which case a plane could naturally separate regions of maximum and minimum temperature power. There exists also a third situation in which a physical plane can play an important role in cosmology, namely, the unavoidable presence of our galactic plane in all CMB measurements acts as an important source of astrophysical and foreground contamination. All these facts lead us to believe that a planar signature on the correlation function would be an important statistical property of the CMB, and is a potential test of its nature.
We have organized this work in the following way: we begin Sec. II with a brief description of the two-point correlation function and its general properties. After dis-cussing some of its known generalizations, we extend our argument to include a planar dependence. In Sec. III we carry a multipolar decomposition of the correlation func-tion with planar dependence and show how the resulting coefficients (i.e., the angular-planar power spectrum) are related to the usual temperature multipolar coefficients a‘m’s. This leads us to the question of how to build an unbiased estimator to measure planar signatures in tem-perature maps and, in particular, how this can be imple-mented with the help of a simple chi-square analysis. We illustrate, still in this section, the application of our statis-tics to the well-knownCDMconcordance model, where we present some figures for the ‘‘best-fit’’CDM angular-planar power spectrum. In Sec.IVwe use a chi-square test to search for planar signatures in the WMAP full-sky temperature maps, and show that the angular scales ‘¼ 7and‘¼8seem to be slightly anomalous for a particular range of planar separationl. We conclude in Sec.V, where we also give some perspective of further developments.
II. TEMPERATURE CORRELATION FUNCTION
The main observable in the CMB is the temperature fluctuation field, T. In its full generality, this field is a function of a position vectorn^ and of the time interval in which we measure this temperature—but in practice our measurements are made in time intervals which are negli-gible compared with the cosmological time scales. The fieldTis a scalar, continuous function on the unit sphere, which means we can decompose it in the usual fashion, in terms of spherical harmonics:
Tðn^Þ ¼X ‘;m
a‘mY‘mðn^Þ: (1)
statistical properties. Since, by construction, this field has zero expectation value, hTi ¼0, the two-point correla-tion funccorrela-tion expresses the first nontrivial momenta of the underlying statistical properties of the physical field, and is given by
Cðn^1;n^2Þ hTðn^1ÞTðn^2Þi
¼ X
‘1;m1 X
‘2;m2
ha‘1m1a‘2m2iY‘1m1ðn^1ÞY‘2m2ðn^2Þ:
(2) Alternatively, the covariance matrix above, ha‘1m1a
‘2m2i, gives all the information about the quadratic momenta of the underlying distribution. If the field T is Gaussian, then this covariance matrix encloses all the information that is needed to describe the nature of the fluctuation field (1). In this work we shall restrict ourselves to a fiducial Gaussian model, for simplicity.
We note also that the separable nature of the definition (2) implies a reciprocity relation for the correlation func-tion:
Cðn^1;n^2Þ ¼Cðn^2;n^1Þ: (3)
This symmetry must always be satisfied, regardless of the underlying physics.
A. Isotropic case
In a globally homogeneous and isotropic universe, the two-point correlation function of the temperature can only depend on the separation angle between the vectorsn^1and
^
n2, that is
Cðn^1;n^2Þ ¼Cðn^1n^2Þ ¼
X
‘
2‘þ1
4 C‘P‘ðn^1n^2Þ: (4)
Comparing this expression with Eq. (2), we notice that the covariance matrix becomes diagonal
ha‘1m1a
‘2m2i ¼C‘1‘1‘2m1m2; (5) with the diagonal terms given by theangular power spec-trum,C‘. In principle the angular power spectrum suffices to describe the statistical properties of the temperature field (1). However, since we have only one universe to measure, and therefore only one set ofa‘m’s, the average in (5) is poorly determined. The best we can do then is to take advantage of the ergodic hypothesis, which states that averaging over an ensemble can be treated as averaging over space, and hence to consider each of the2‘þ1real numbers ina‘mas statistically independent, in such a way as to build a statistical estimator for theC‘’s:
^ C‘
1 2‘þ1
X‘
m¼ ‘
ja‘mj2:
SincehC^‘i ¼C‘, this estimator is said to be unbiased. Also, because for a Gaussian field hðC^‘ C‘Þ
ðC^‘0 C‘0Þi /‘‘0, this estimator has the least ‘‘cosmic
variance.’’ C^‘ is, therefore, the best estimator that can measure the statistical properties of the multipolar coeffi-cients a‘m when both statistical isotropy and Gaussianity hold.
B. Some anisotropic cases
The first line in Eq. (4) for the temperature two-point correlation function is valid if and only if the Universe is statistically isotropic. This means that any functional de-pendence that does not reduce to a dede-pendence oncos# ¼
^
n1n^2 will measure some deviation from statistical
iso-tropy. There are infinite possible combinations of n^1 and
^
n2 that violate statistical isotropy. However, since the
vectorsn^1andn^2are constrained to have a common origin
and size, symmetry and simplicity does not leave us many choices. One possibility is to consider these two vectors as being the same, in which case we are left with a correlation function of the form
C: S2 !R; (6)
and for which a decomposition similar to (1) exists. This form of the correlation function makes it suitable for searching for power multipole moments in CMB tempera-ture and polarization maps, once we define a power multi-pole moment estimator [22]. On the other hand, this is also a correlation function at zero lag, so by construction it does not allow us to consider anisotropic correlations between different points in the sky.
A second possibility is to consider the correlation func-tion as being the most general (but separable) funcfunc-tion of two unit vectors that one can possibly have [23]:
C:S2S2!R: (7)
This function admits a decomposition in terms of the bipolar spherical harmonics [23] which has the nice prop-erty of behaving—in many mathematical aspects—as the usual spherical harmonics. The main drawback of the decomposition (7), however, is that it carries too many degrees of freedom which, in the absence of a specific cosmological model, cannot be resolved with simple esti-mators. Therefore, these two approaches are either too simple or too generic to reveal deviations from statistical isotropy in a more model-independent way.
C. Anisotropy through planar dependence
north-south anomalies [4–8], not to mention the impor-tance of our galactic plane as a source of foreground contamination in the construction of cleaned CMB maps. The existence of a cosmic plane might even be a manifes-tation of some mirror symmetry [28]
In general, the simple fact that we are bound to make all our measurements inside our galactic plane suggests that the correlation between fields at two positionsn^1 andn^2
might be sensitive not only to their separation angle but also to the orientation of the plane they live in, as is shown in Fig.1.
Such a planar dependence can be included in the corre-lation function if we realize that two unit vectors on the sphereS2 uniquely define both a separation angle# and a
direction n^ perpendicular to the great circle (or plane) where they live. We are then left with a new possibility for the functional dependence of the two-point correlation function:
Cðn^1;n^2Þ ¼Cðn^1n^2Þ; (8)
which corresponds formally to a function of the formC: D3 !R, whereD3is the set of all pointsðx; y; zÞsuch that
x2þy2þz21[29]. Definingn ^
n1n^2, the above
expression can be further decomposed in spherical coor-dinates as follows:
CðnÞ ¼X
‘
X
l;m 2‘þ1
ffiffiffiffiffiffiffi 4
p Clm
‘ P‘ðcos#ÞYlmðn^Þ; l22N;
(9)
where
jnj ¼sin#; n^ ¼ f; g:
Notice that
^
n1n^2 ¼cos#
¼cos1cos2þsin1sin2cosð1 2Þ;
(10) whereði; iÞare the angles defined by the vectorsn^i.
Some comments on the decomposition (9) are in order. First, we note that there is an intrinsic ambiguity in the sense of the vectorn(as we might as well have definedn
^
n2n^1), which is obviously inherited from the ambiguity
in the definition of the normal to a plane. This ambiguity can be avoided if we restrict the sum in lto even values, which is what we will do from now on. Note that such a restriction arises naturally as a consequence of the reci-procity relation, Eq. (3). Second, for‘¼0we recover (6) and therefore all the analysis made in [22] arises as a special case here.
III. ANGULAR-PLANAR POWER SPECTRUM
The multipolarClm
‘ coefficients in Eq. (9) correspond to a generalization of the usual angular power spectrumC‘’s. In fact, they can be seen as a spherical harmonic decom-position of the angular power spectrum, if it suffers mod-ulations as we sweep planes on the sphere. The function C‘ðn^Þfor a given‘is
C‘ðn^Þ ¼
ffiffiffiffiffiffiffi 4
p X
l;m
Clm
‘ Ylmðn^Þ; l22N:
Clearly, the monopole ofC‘ðn^Þ(the average over the whole sphere) is the usual angular power spectrum,C00
‘ ¼C‘, and the higher multipoles measure modulations of the spectrum.
Since we are restricting our analysis to the Gaussian case, the set of coefficients Clm
‘ completely characterizes the two-point correlation function. Still, what is accessible through observations are temperature maps which we can use to try to estimate the correlation function. In this respect the multipolar coefficientsClm
‘ would be of limited interest, unless we can relate them directly to our observ-ables. It would be interesting if we could, for example, relate these coefficients to the covariance matrix
ha‘1m1a‘2m2i by equating expressions (9) and (2), as is usually done. However, this procedure is far from being trivial, since the complicated coupling of the angles#,, and defined in (10) make it difficult to use the usual orthogonality relations to isolate theClm
‘ ’s.
Fortunately, as we show below, we can estimate theClm
‘ ’s if we use the invariance of the scalar product n^1n^2 and
choose our coordinate system in order to integrate out the # dependence. Once this is done, we make a passive rotation of the coordinate system and then we integrate over the remaining anglesand, which then are given precisely by the Euler angles used in the rotation. The details are rather technical and can be found in the Appendix. The final expression is
Clm ‘
ffiffiffiffiffiffiffiffiffiffiffiffiffiffi 2lþ1
p ¼2X
‘1;m1 X
‘2;m2
ha‘1m1a‘2m2i
l ‘1 ‘2
m m1 m2
I‘l;‘ 1‘2;
(11)
where the 6-index expression in parentheses is the Wigner 3J symbol, and
Il;‘‘ 1‘2
X
m
ð 1Þm ‘1m‘2m
l ‘1 ‘2
0 m m
Z
0
dð cos#ÞP‘ðcos#Þeim#; (12)
where ‘im are a set of coefficients resulting from the # integration, which vanish unless ‘iþm¼even (see the Appendix for more details.)
It is easy to show that expression (11) induces no cou-pling between the eigenvalues‘andl, as expected, since the length of the vectornis completely independent of its orientation. There are, however, subtle couplings present in (11) which do make a difference when we apply it to real data. This is due to the Legendre polynomial in the integral (12), which selects only those values of‘1 and‘2 which
have the same parity as the angular momentum ‘. Moreover, the 3J symbols appearing in (11) give different weights to the triple ðl; ‘1; ‘2Þdepending on the parity of
ð‘1; ‘2Þ and, as a consequence, we can expect typical
oscillations in any function of (11) that we may build when plotted as a function of ‘. This will be shown explicitly in the next section, when we apply these tools to the WMAP 5 year data.
Expression (11) does not take into account the fact that real data are not given exactly by (1), but rather by a pixelated temperature map which is a combination of the true cosmological signal, plus instrumental noise and re-sidual foreground contamination. Schematically, the tem-perature of the map in each pixeliis given by
Tmap
ðn^iÞ ¼TSðn^iÞ þTNðn^iÞ þTRðn^iÞ:
Typically, the cosmological signalTSis smoothed out by a Gaussian beamWðn^iÞof finite width which, in harmonic space, is given by W‘ ¼expð ‘22
bÞ, where b ¼ fwhm=pffiffiffiffiffiffiffiffiffiffi8 ln2 and fwhm is the beam full width at half maximum. For theV-band frequency map of the WMAP experiment, fwhm¼0:35, which implies a minimum
‘min*390 for which the effect of a beam smoothing
will be important, much higher than the low-‘ regions where known anomalies were reported. Thus, for the sake of simplicity we will neglect the effect of the beam in this work. Also, for the‘&390region, cosmic variance is known to dominate the source of error over instrumental noise, and therefore we can neglect the latter as well. On the other hand, the residual foreground can be an important source of contamination, and therefore deserves a careful analysis which is beyond the scope of the present work. In a companion paper we carry a more rigorous analysis of
planar signature in CMB data in which the effect of the residual foreground will be estimated [30].
A. Statistical estimators and2 analysis
We now would like to use expression (11) to examine the observed Universe. We start by noting that in the limit of statistical isotropy (SI), that is, when ha‘1m1a‘2m2i ¼ C‘1‘1‘2m1m2, expression (11) reduces to
Clm
‘ ¼
ðSIÞ
C‘l0m0: (13)
Conversely, if the only nonzeroClm
‘ ’s are given byl¼m¼ 0, thenC00
‘ ¼C‘. Therefore, statistical isotropy is achieved if and only if the Clm
‘ ’s are of the form (13), and any observational deviation from this relation would be an indication of statistical anisotropy.
However, we only get to observe one universe, and this makes the ‘‘cosmic sample variance’’ a severe restriction that we have to live with. This means that if we want to know, let us say, the mean value and variance of theClm‘ ’s, we will have to build statistical functions which can only estimate these properties, just like it is done with the fundamental quantities a‘m and the associated estimators
^
C‘ (see the discussion in Sec.II A).
In other words, in order to evaluate the statistical prop-erties of the Clm‘ ’s we will have to treat them as our new ‘‘fundamental’’ quantities, which will be determined ex-clusively as a function of thea‘m’s. As a consequence, we will redefine expression (11) as
Clm‘ !2pffiffiffiffiffiffiffiffiffiffiffiffiffi2lþ1X ‘1;m1
X
‘2;m2
a‘1m1a‘2m2 l ‘1 ‘2
m m1 m2
I‘l;‘ 1‘2;
(14)
and will treat the coefficients Clm
‘ as uniquely given once we have a map. Of course, expression (14) is nothing more than the unbiased estimator of the angular-planar power spectrum (11) and—as long as cosmic variance is an issue—this ‘‘second order’’ approach we are adopting here (i.e., the prescription of adopting this estimator of the correlation function as our fundamental quantity, rather than the temperature field) is the best we can do when searching for statistical deviations of isotropy. In theory, it is also possible to use the CMB polarization induced by galactic clusters to probe different surfaces where CMB photons last scattered, and to use such independent mea-surements as a way to alleviate cosmic variance [31,32]. However, the gain in terms of a reduced variance is still limited.
Having these limitations in mind, we can now ask: how good does a theoretical model of anisotropy, Cth;lm
‘ , fit the observational data once it is given by (14)? To answer this question we can use the well-known chi-square (2)
ð2
Þl
‘
Xl
m¼ l
jClm
‘ C
th;lm ‘ j2
ðlm ‘ Þ2
;
in which the scalesland‘are seem as independent degrees of freedom, and wherelm
‘ is just the standard deviation of the difference (Clm
‘ C
th;lm
‘ ). Although this expression can be readily applied to any theoretical model of anisotropy, in practice it is better to work with its reduced version
ð2
Þl‘ 1 2lþ1
Xl
m¼ l
jClm
‘ C
th;lm ‘ j2
ðlm ‘ Þ2
; (15)
which is just the chi-square function divided by the2lþ1 planar degrees of freedom.
Expression (15) will be the starting point of our statis-tical analysis, which we will pursue in detail in Sec. IV. Before we move on, it is important to choose a particular cosmological model of anisotropy against which we want to compare our estimator (14).
B.CDMmodel
The most important model to be analyzed using the estimator (14) is, of course, the concordanceCDMmodel which was confirmed with striking accuracy by the 5 year release data set of the WMAP team [2]. For this model, statistical isotropy holds and, as we have shown, any multi-polar coefficient Clm
‘ with nonzero planar dependence should be identically zero in this case [see expression (13)]. Therefore, for this model we can take
Cth;lm
‘ 0; (16)
where it should be clear that we are only considering the cases withl2(as we will do from now on). Now, if the data under analysis are really Gaussian and SI, then their
covariance matrix can be explicitly calculated:
Mll0mm0
‘ hðClm‘ C
th;lm ‘ ÞðCl
0m0
‘ C
th;l0m0
‘ Þi
¼ hðClm
‘ ÞCl
0m0
‘ i ¼82
X
‘1;‘2
C‘1C‘2ðIl;‘‘ 1‘2Þ
2
ll0mm0;
where we have used (5) and the null hypothesis (16). This covariance matrix has some interesting properties: first, we note that the planar degrees of freedom in (15) are really independent in this case. Moreover, the variance
ðlm
‘ Þ2¼Mllmm‘ becomesm-independent:
ðlm
‘ Þ2 ! ðl‘Þ2¼82
X
‘1;‘2
C‘1C‘2ðI l;‘ ‘1‘2Þ
2: (17)
Second, its diagonal terms (i.e.,l
‘) are completely deter-mined by the angular power spectrum C‘, up to some geometrical coefficients which arise as a consequence of the way in which we split our CMB sky. This makes it possible to give a visual interpretation of the angular-planar power spectrum Clm
‘ , similar to that of the C‘’s. For that, let us introduce thereduced angular-planar spec-trum:
Hl ‘
ffiffiffiffiffiffiffiffiffiffiffiffiffiffiffi 2‘þ1
2 s
l
‘; (18)
which has a simple interpretation when compared to the usual angular spectrum, because H0
‘ ¼
ffiffiffiffiffiffiffiffiffiffiffiffiffiffiffiffiffiffiffiffiffiffiffi
ð2‘þ1Þ=2 p
0
‘ ¼ C‘, as can be easily shown using Eqs. (17) and (A5).
In Fig.2we show some plots of the reduced spectrum Hl
‘, both as a function ofland‘. Notice that, as a result of our planar splitting of the CMB sky, the low-‘sector of the spectrumHl
‘ is suppressed when we consider planes sepa-rated by smaller angles (bigger values of l). This is a consequence of the nontrivial coupling of the momentsl,
5 10 50 100 500 1000
0 1000 2000 3000 4000 5000 6000
10.0 5.0
2.0 3.0 7.0 15.0 20.0
100 200 300 400 500 600 700
FIG. 2 (color online). Reduced angular-planar power spectrumHl
‘for a fiducialCDMmodel. The left panel shows the spectrum as a function of‘for the particular values (from top to bottom)l¼ ð0;2;4;6;12Þ; the casel¼0(dotted line) represents the standard angular power spectrum C‘. The right panel shows the same spectra, but now as a function of l, for the particular values ‘¼
‘1, and ‘2: since the C‘’s are roughly given by a mono-tonically decreasing sequence, and sincejl ‘1j ‘2
lþ‘1, bigger values of l make the moment ‘2 probe
deeper and deeper regions of the Sachs-Wolfe plateau. This suppression reaches cosmological scales up to the first acoustic peak, after which the planar dependence becomes negligible.
IV.2 TEST OF STATISTICAL ANISOTROPY
We now come back to the question of how the angular-planar power spectrumClm
‘ fits the observed Universe. We begin by showing that if we want to compare our data against the standardCDMuniverse, then the chi-square function (15) becomes a very simple expression. As we have shown in the preceding section, for this model,lm
‘ ¼
l ‘ andC
th;lm
‘ ¼0. Therefore (15) simplifies to
ð2
Þl‘¼ 1 2lþ1
Xl
m¼ l
jCobs;lm
‘ j2
ðl ‘Þ2
; (19)
whereCobs;lm
‘ is calculated by applying the estimator (14) to the data given byaobs
‘m. It is now clear that if the data under analysis are really Gaussian and statistically isotropic, then it should be true that
hð2
Þl‘i ¼ 1 2lþ1
Xl
m¼ l
hðCobs;lm
‘ ÞC
obs;lm
‘ i
ðl ‘Þ2
¼1:
This means that a positive test of planarity will be quanti-fied by how far our chi-square function deviates from unity. We can do even better and define a new function as
l
‘ ð2Þl‘ 1; (20)
which, if significantly different from zero, will point to-ward anisotropy.
It should be stressed that, for a given CMB map, the chi-square analysis must be done entirely in terms of that map’s data. Indeed, any arbitrary introduction of a fiducial bias in (19) (for example, by calculatingl
‘usingCCDM‘ ) would only include oura prioriprejudices about what the map’s anisotropies should look like. The angular spectrum C‘, being by construction a measure of statistical isotropy, can only be said to be small/big when compared to a particular cosmological model (for example, the CDM model). Consequently, an anomalous detection ofC‘is by no means a measure of statistical anisotropy, and it is this value that should be used to calculatel
‘if we want to find deviations of isotropy, regardless of how high/low it is. Note also that while the function l
‘ has some ‘‘isotropy variance’’ which could be computed for theCDMmodel from first principles, in practice it is much easier to simu-late many realizations of a Gaussian and isotropic random field to obtain that variance.
Finally, we would like to mention that although each number l
‘ is an individual measure of anisotropy (i.e., planarity), a consistently biased set of values over a range ofl’s or‘’s can also be seen as an indication of anisotropy, even if all individuall
‘’s in that range are well within their variance limits.
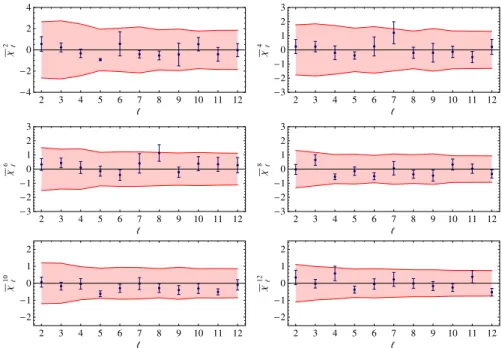
Following the prescription outlined above, we applied the estimator (20) to the 5 year WMAP full-sky data (also known as the ILC5 map) where, for practical reasons, we
2 3 4 5 6 7 8 9 10 11 12
−4 −2 0 2 4
2 3 4 5 6 7 8 9 10 11 12
−3 −2 −1 0 1 2 3
2 3 4 5 6 7 8 9 10 11 12
−3 −2 −1 0 1 2 3
2 3 4 5 6 7 8 9 10 11 12
−3 −2 −1 0 1 2 3
2 3 4 5 6 7 8 9 10 11 12
−2 −1 0 1 2
2 3 4 5 6 7 8 9 10 11 12
−2 −1 0 1 2
FIG. 3 (color online). Anisotropic angular-planar estimator applied to the WMAP ILC5 data. The panel showsl
have restricted our analysis to the range of values ‘2
½2;12 and l2 ½2;12 (notice that the momenta l can only assume even values). Our results are presented in Fig.3, where we keep the momentalfixed, and vary the momenta related to angular separation, ‘. As discussed
before, for this range of values cosmic variance dominates over other sources of noise. We estimated the effects of cosmic variance by running a simulation of 103
realiza-tions of this estimator, using the best-fit (theoretical) scalar C‘’s made available in [33]; this corresponds to the shaded area in Fig.3.
It is also important to explain that, while the data points in Fig. 3 were calculated using the ILC5 mapalone, we have also included in our analysis a rough estimate of the possible residual foreground contamination present in the data. This was done by computing the sample variances of the full-sky maps shown in TableI, which were then used as error bars. In other words, the error bars in Fig.3do not account for instrumental noise, which is believed to be under control at these angular scales.
Theses figures present some peculiarities: first, we no-tice that the magnitudes of the error bars oscillate for the smallest values of ‘. As we mentioned in Sec.III, this is
2 4 6 8 10 12
−4 −2 0 2 4
2 4 6 8 10 12
−4 −2 0 2 4
2 4 6 8 10 12
−4 −2 0 2 4
2 4 6 8 10 12
−3 −2 −1 0 1 2 3
2 4 6 8 10 12
−3 −2 −1 0 1 2 3
2 4 6 8 10 12
−3 −2 −1 0 1 2 3
2 4 6 8 10 12
−3 −2 −1 0 1 2 3
2 4 6 8 10 12
−3 −2 −1 0 1 2 3
2 4 6 8 10 12
−3 −2 −1 0 1 2 3
2 4 6 8 10 12
−3 −2 −1 0 1 2 3
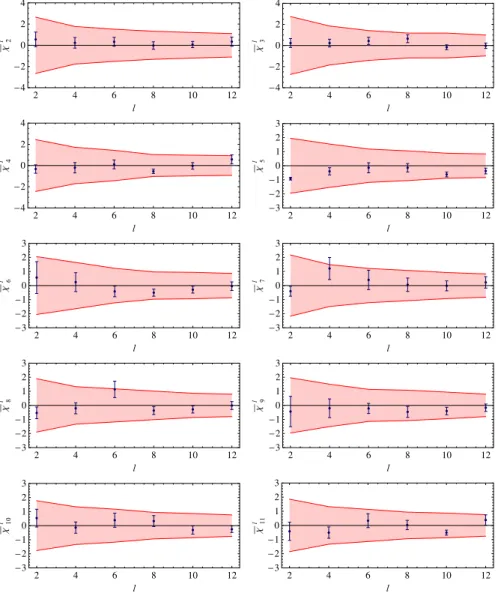
FIG. 4 (color online). Anisotropic angular-planar estimator applied to the WMAP ILC5 data. The panel showsl
‘as a function ofl, for the particular values‘¼ ð2;3;4;5;6;7;8;9;10;11Þ. Note that for fixedl, the error bars do not oscillate (see the text for more details).
TABLE I. Full-sky WMAP maps used in our analysis to esti-mate the error bars of Fig. 3. The data points in this (and subsequent) figure was calculated using only the ILC5 map [1,34].
Full-sky maps References
Hinshawet al. [1,34]
de Oliveira-Costaet al. [35]
Kimet al. [36]
Parket al. [37]
partially a consequence of the 3J symbols, which are weights appearing in the definition of the anisotropic power spectra and whose effect is to couple differently odd and even multipoles. The second peculiarity is that, in all these figures, the modulations of the quadrupolar mo-ment‘¼2 are entirely consistent with zero. This result suggests that the low value of the quadrupoleC2is perhaps
not a consequence of statistical anisotropy, at least for the test we are considering here. Note also that the octupole ‘¼3, which has been reported as unusually planar by some groups, grows slightly froml¼4tol¼8, although it is compatible with cosmic variance in all the planar range considered.
In what concerns deviations of isotropy, our analysis shows that the most ‘‘anomalous’’ scales are in the sectors
ðl; ‘Þ ¼ ð4;7Þand (6, 8), where we can see that the points
4
7 and68 are only marginally allowed by the2cosmic
variance area.
In order to make the visualization of the above figures easier, we repeat the analysis but now keeping the angular separation‘fixed and varying the planar separationl. The result is shown in Fig.4. Notice that the planar modulations of the quadrupole‘¼2are consistently positive, but al-ways compatible with zero. We can also see in these figures the growing behavior in the octupole‘¼3froml¼4to l¼8as mentioned before.
V. CONCLUSIONS
We have investigated the minimum statistical frame-work of modern cosmology by enlarging the domain of the two-point correlation function to admit not only the usual angular dependence, but a directional (planar) de-pendence as well. Our observable, the anisotropic angular-planar power spectrum, can account not only for the usual angular separation between any two spots in a CMB map, but also for any planar signature that this map might have. Besides having a strong observational motivation, an in-teresting feature of this approach is that it leads naturally to an unbiased estimator of statistical anisotropy, in the same spirit as is done with the multipolar temperature coeffi-cients a‘m’s and their associated estimator C^‘. As an example of its use, we have applied this estimator to a concrete model of cosmology, i.e., the CDM model, where we have shown that under the hypothesis of Gaussianity and statistical isotropy, the angular-planar power spectra have zero mean, but of course, nonzero covariance.
By means of a simple chi-square analysis, we have also applied our estimator of planar anisotropy to the WMAP ILC5 data, where we found that the planar modulations of the quadrupole ‘¼2 are compatible with the null hy-pothesis over the range of planar momental2 ½2;12we probed. Our results suggest that the low value of the quadrupoleC2 is perhaps due to some local physics, and
not to deviations of statistical isotropy, at least as far as planar modulations are concerned.
Our analysis has also shown that the angular scales‘¼ 7and‘¼8suffer some degree of modulation around the planar scalesl¼4andl¼6, respectively. This could be an indication of some foreground contamination coming from a planar region of typical sizel¼46. However, a complete treatment of the sources of errors and the effect of masks is needed before we can reach a more definitive conclusion—that analysis is under way [30].
From a theoretical perspective, our techniques can be readily applied to any particular model of inflation predict-ing a specific anisotropic shape for the matter power spec-trum. Because of the generality and simplicity of our formulas, the angular-planar power spectrum can also be used to analyze CMB polarization. Other possible appli-cations include stacked maps of cosmic structure, such as the galaxy cluster catalog 2Mass [39].
We finally mention that, although in this work we have focused on testing isotropy while keeping within the Gaussian framework, our tools can also be used to search for deviations from Gaussianity in a completely model-independent way.
ACKNOWLEDGMENTS
We would like to thank Armando Bernui for useful suggestions and for providing us with observational data in its final form. We also thank the anonymous referee for clarifying that our test reduces to the 2 statistics, which
led to substantial improvements in the presentation of our work. This work was supported by Fundac¸a˜o de Amparo a` Pesquisa do Estado de Sa˜o Paulo (FAPESP), and by Brazil’s Conselho Nacional de Desenvolvimento Cientı´fico e Tecnolo´gico (CNPq).
APPENDIX A
1. Derivation of (11)
We will present here the details of the derivation of expression (11). We start by equating expressions (9) and (2)
X
‘
X
l;m 2‘þ1
ffiffiffiffiffiffiffi 4
p Clm
‘ P‘ðcos#ÞYlmðn^Þ
¼ X
‘1;m1 X
‘2;m2
ha‘1m1a‘2m2iY‘1m1ðn^1ÞY‘2m2ðn^2Þ: (A1)
As mentioned in the main text, the inversion of Clm‘ as a function of thea‘m’s is not a trivial task, since the vectorn depends nonlinearly on the vectorsn^1 andn^2. The easiest
way to achieve this goal is to pick up a coordinate system where only the # dependence (i.e., the modulus of the vectorn) is present. After integrating it out, we rotate our coordinate system using three Euler angles to recover the
help of some Wigner matrices identities. We therefore start by positioning the vectorsn^1 andn^2in thexyplane, i.e., we
chosen^1 ¼ ð=2; 1Þ,n^2¼ ð=2; 2Þ. By (10) we then havecos#¼cosð1 2Þ. Using the relation [40]
Y‘mð=2; Þ ¼‘meim; where ‘m¼
ð 1Þð‘þmÞ=2 ffiffiffiffiffiffiffiffiffiffiffiffiffiffiffiffiffiffiffiffiffiffiffiffiffiffiffiffiffiffiffiffiffiffiffiffiffiffiffiffiffiffiffiffiffiffi2‘þ1 4 ð
‘þm 1Þ!!
ð‘þmÞ!! ð
‘ m 1Þ!!
ð‘ mÞ!!
q
if ‘þm22N
0 otherwise (A2)
andn¼ ðsin#;0;0Þ, we can integrate the#dependence on both sides of (A1). This gives us
1 ffiffiffiffi p X l;m Clm
‘ Ylmð0;0Þ ¼
X
‘1;m1 X
‘2;m2
ha‘1m1a ‘2m2iI
‘ ‘1m1‘2m2;
(A3) where we have introduced the following definition:
I‘
‘1m1‘2m2 ‘1m1‘2m2 Z
0
P‘ðcosð1 2ÞÞ
eiðm11 m22Þdðcosð
1 2ÞÞ: (A4)
We need now to integrate out theanddependence in the right-hand side of (A3) which was hidden due to our choice of a particular coordinate system. In order to do that, we keep the vectors n^1 and n^2 fixed and make a
rotation of our coordinate system using three Euler angles !¼ f; ; g. This rotation changes the coefficientsClm
‘ ’s anda‘m’s according to
a‘m¼X m0
D‘
mm0ð!Þa~‘m0; Clm‘ ¼
X
m0
Dl mm0ð!Þ~C
lm0
‘ ;
where C~lm‘ and a~lm are the multipolar coefficients in the
new coordinate system and where Dl
mm0ð!Þ are the
ele-ments of the Wigner rotation matrix. The advantage of positioning the vectors n^1 and n^2 in the planexy is that
now the angles and are given precisely by the Euler anglesand, regardless of the value of
X
l;m
Clm
‘ Ylmð0;0Þ ¼
X
l;m0
~ Clm‘ 0
X
m Dl
mm0ð; ; ÞYlmð0;0Þ
¼X
l;m0
~
Clm‘ 0Yl; mð; Þ;
where in the last step we have used Ylmð0;0Þ ¼
ffiffiffiffiffiffiffiffiffiffiffiffiffiffiffiffiffiffiffiffiffiffiffiffiffiffi
ð2lþ1Þ=4 p
m0. Therefore, in our new coordinate
sys-tem we have (dropping the ‘‘’’ in our notation)
1 2
X
l;m
Clm ‘ Dl0mð!Þ
ffiffiffiffiffiffiffiffiffiffiffiffiffiffi 2lþ1
p
¼ X
‘1;m1 X
‘2;m2
ha‘1m1a‘2m2i X
m0
1m02 I‘
‘1m01‘2m02D ‘1 m0
1m1ð!ÞD ‘2 m0
2m2ð!Þ:
We may now isolateClm
‘ using the identities [40]
Z
d!Dlm1 1m01ð
!ÞDl2 m2m02ð
!Þ ¼ 8
2
2l1þ1
l1l2m1m2m0
1m02
Z d!Dl1
m0
1m1ð!ÞD l2 m0
2m2ð!ÞD l3 m0
3m3ð!Þ ¼8
2 l1 l2 l3
m0
1 m02 m03
!
l1 l2 l3
m1 m2 m3 !
;
whered!¼sinddd, to obtain 1
ffiffiffiffiffiffiffiffiffiffiffiffiffiffi 2lþ1
p Clm
‘ ¼2
X
‘1;m1 X
‘2;m2
ha‘1m1a ‘2m2i
X
m0
1m02 I‘
‘1m01‘2m02ð 1Þ
m2þm02þm ‘1 ‘2 l
m0
1 m02 0
‘
1 ‘2 l
m1 m2 m
:
If we now do the redefinitions
m2 !m2; m!m; Clm‘ ! ð 1ÞmC l; m ‘
and note that the first 3J symbol above is identically zero unlessm0
1¼m02, we obtain finally (11).
2. Useful identities
We present here some useful identities related to the 3J symbols.
(i) Isotropic limit:
l1 l2 0
m1 m2 0
¼ð 1Þ
l2 m1
ffiffiffiffiffiffiffiffiffiffiffiffiffiffiffiffi 2l1þ1
p l1l2m1; m2:
(ii) Parity and permutations:
l1 l2 l
m1 m2 m
¼ l l1 l2
m m1 m2
¼ ð 1Þl1þl2þl l2 l1 l
m2 m1 m
¼ ð 1Þl1þl2þl l1 l2 l
m1 m2 m
(iii) Orthogonality:
Xl1
m1¼ l1 Xl2
m2¼ l2
l1 l2 l3
m1 m2 m3
!
l1 l2 l03
m1 m2 m03
!
¼l3l03m3m03 2l3þ1
X
l2þl3
l1¼jl2 l3j Xl1
m1¼ l1
ð2lþ1Þ l1 l2 l3 m1 m2 m3
!
l1 l2 l4
m1 m02 m03
!
¼m2m0
2m3m03
Xl
m¼ l
ð 1Þl m l l ‘
m m 0
!
¼pffiffiffiffiffiffiffiffiffiffiffiffiffiffi2lþ1‘;0:
The last expression is particularly useful in the derivation of (13).
3. Some properties of the integral (12)
The geometrical coefficientsI‘l;‘
1‘2 defined in (12) have many interesting properties which can be explored in order to speed up numerical computation of (11). First, we note that it is symmetric under permutation of‘1 and‘2
Il;‘‘ 1‘2 ¼
X
m I‘
‘1m‘2mð 1Þ
m ‘1 ‘2 l
m m 0
¼X
m I‘
‘2m‘1mð 1Þ
mþ‘1þ‘2þl ‘2 ‘1 l
m m 0
¼X
m I‘
‘2m‘1mð 1Þ
mþ2ð‘1þ‘2þlÞ ‘2 ‘1 l
m m 0
¼Il;‘‘ 2‘1:
Some of the other properties are a consequence of the integralI‘
‘1m‘2mdefined in (A4). We may note, for example, that, due to the symmetry of the‘mcoefficient defined in (A2), we will have
Il;‘‘
1‘2¼0; for anyfð‘1; ‘2Þ 2Nj‘1þ‘2 ¼oddg: Furthermore, the‘mcoefficients restrict them summa-tion above to their values which obey mþ‘1þ‘2 ¼
even. If we further notice that (A4) is proportional to the integral of an integral of the formR11P‘ðcosÞcosmd, and that this integral is zero unless ‘þm¼even, we conclude that
I‘l;‘
1‘2 ¼0; for any fð‘1; ‘2; ‘Þ 2Nj‘1þ‘2þ‘¼oddg: Besides, using the fact that the integralR11P‘ðcosÞ cosmdis zero for anym < ‘, we find
Il;‘‘
1‘2 ¼0; for anyfð‘1; ‘2; ‘Þ 2Nj‘1< ‘; ‘2< ‘g: We finally comment on the special case wherel¼0, for which we have
I0‘;‘ 1‘2 ¼
ð 1Þ‘1 ffiffiffiffiffiffiffiffiffiffiffiffiffiffiffiffiffi 2‘1þ1
p
X
m I‘
‘1m‘1m
‘1‘2:
However
X‘0
m¼ ‘0
I‘ ‘0m‘0m ¼
Z
0
P‘ðcos#Þ
X‘0
m¼ ‘0
ð2‘0þ1Þ 4
ð‘0þm 1Þ!!
ð‘0þmÞ!!
ð‘0 m 1Þ!!
ð‘0 mÞ!! eim#
dð cos#Þ;
‘0þm¼even¼2‘0þ1 4
Z1
1
P‘ðxÞP‘0ðxÞdx¼
1 2‘‘0:
where in the derivation above we have made use of the Fourier series expansion of the Legendre polynomial. So we conclude that
I0;‘ ‘1‘2 ¼
ð 1Þ‘1 2 ffiffiffiffiffiffiffiffiffiffiffiffiffiffiffiffiffi2‘1þ1
p ‘‘1‘1‘2; (A5)
[1] G. Hinshawet al. (WMAP Collaboration), Astrophys. J. Suppl. Ser.180, 225 (2009).
[2] E. Komatsu et al.(WMAP Collaboration), Astrophys. J. Suppl. Ser.180, 330 (2009).
[3] M. R. Nolta et al.(WMAP Collaboration), Astrophys. J. Suppl. Ser.180, 296 (2009).
[4] A. de Oliveira-Costa, M. Tegmark, M. Zaldarriaga, and A. Hamilton, Phys. Rev. D69, 063516 (2004).
[5] H. K. Eriksen, F. K. Hansen, A. J. Banday, K. M. Gorski, and P. B. Lilje, Astrophys. J.605, 14 (2004).
[6] D. J. Schwarz, G. D. Starkman, D. Huterer, and C. J. Copi, Phys. Rev. Lett.93, 221301 (2004).
[7] K. Land and J. Magueijo, Phys. Rev. Lett. 95, 071301 (2005).
[8] H. K. Eriksen, A. J. Banday, K. M. Gorski, F. K. Hansen, and P. B. Lilje, Astrophys. J.660, L81 (2007).
[9] L. R. Abramo, A. Bernui, I. S. Ferreira, T. Villela, and C. A. Wuensche, Phys. Rev. D74, 063506 (2006). [10] A. Bernui and W. S. Hipolito-Ricaldi, Mon. Not. R.
Astron. Soc.389, 1453 (2008).
[11] J. P. Luminet, J. Weeks, A. Riazuelo, R. Lehoucq, and J. P. Uzan, Nature (London)425, 593 (2003).
[12] A. Riazuelo, J. Weeks, J.-P. Uzan, R. Lehoucq, and J.-P. Luminet, Phys. Rev. D69, 103518 (2004).
[13] T. S. Pereira, C. Pitrou, and J.-P. Uzan, J. Cosmol. Astropart. Phys. 09 (2007) 006.
[14] C. Pitrou, T. S. Pereira, and J.-P. Uzan, J. Cosmol. Astropart. Phys. 04 (2008) 004.
[15] A. E. Gumrukcuoglu, C. R. Contaldi, and M. Peloso, J. Cosmol. Astropart. Phys. 11 (2007) 005.
[16] L. Ackerman, S. M. Carroll, and M. B. Wise, Phys. Rev. D
75, 083502 (2007).
[17] C. Gordon, W. Hu, D. Huterer, and T. M. Crawford, Phys. Rev. D72, 103002 (2005).
[18] R. A. Battye and A. Moss, Phys. Rev. D 74, 041301 (2006).
[19] T. Koivisto and D. F. Mota, Astrophys. J.679, 1 (2008). [20] L. R. Abramo, L. Sodre´, Jr., and C. A. Wuensche, Phys.
Rev. D74, 083515 (2006).
[21] K. Land and J. Magueijo, Mon. Not. R. Astron. Soc.362, 838 (2005).
[22] A. R. Pullen and M. Kamionkowski, Phys. Rev. D 76, 103529 (2007).
[23] A. Hajian and T. Souradeep, Astrophys. J.597, L5 (2003). [24] A. Hajian, T. Souradeep, and N. J. Cornish, Astrophys. J.
618, L63 (2005).
[25] A. Hajian and T. Souradeep, arXiv:astro-ph/0501001. [26] C. J. Copi, D. Huterer, D. J. Schwarz, and G. D. Starkman,
Mon. Not. R. Astron. Soc.367, 79 (2006). [27] A. Bernui, Phys. Rev. D78, 063531 (2008).
[28] K. Land and J. Magueijo, Phys. Rev. D72, 101302 (2005). [29] This is the three-dimensional version of the familiar two-dimensional disk, for which the quotient with the unit circle gives the 2-sphere:S2¼D2=S1.
[30] L. R. Abramo, A. Bernui, and T. S. Pereira (work in progress).
[31] M. Kamionkowski and A. Loeb, Phys. Rev. D56, 4511 (1997).
[32] L. R. Abramo and H. S. Xavier, Phys. Rev. D75, 101302 (2007).
[33] Legacy Archive for Microwave Background Data Analysis, http://lambda.gsfc.nasa.gov/.
[34] G. Hinshawet al.(WMAP Collaboration), Astrophys. J. Suppl. Ser.170, 288 (2007).
[35] A. de Oliveira-Costa and M. Tegmark, Phys. Rev. D74, 023005 (2006).
[36] J. Kim, P. Naselsky, and P. R. Christensen, Phys. Rev. D
77, 103002 (2008).
[37] C.-G. Park, C. Park, and J. R. I. Gott, Astrophys. J.660, 959 (2007).
[38] J. Delabrouilleet al., arXiv:0807.0773.
[39] The Two Micron All Sky Survey at IPAC, http://www. ipac.caltech.edu/2mass/.