Impact of Periodic Frequency Modulation on Power Quality of
Switching Power Converter
STEPINS Deniss
11Riga Technical University, Latvia,
Department of Radioelectronics, Faculty of Electronics and telecommunications, 16 Azenes street, LV-1048, Latvia, E-Mail1: [email protected]
Abstract – In this paper power quality of switching frequency modulated (SFM) power converters is analyzed in details. Careful attention is paid on the effect of SFM parameters on switching power converter input current total harmonic distortion (THD) and power factor. Theoretical analysis, simulations and experiments show that SFM used for electromagnetic interference reduction in switching power converters has almost invisible impact on input current THD and power factor of conventional switching power converters.
Keywords: frequency modulation; power converter; electromagnetic interference; power quality.
I. INTRODUCTION
Switching power converters (SPC) are widely used for electric power conversion in modern electronic equipment. Conventional AC-mains-connected SPC usually consists of diode bridge rectifier, large capacitance filtering capacitor Cin and DC/DC SPC (Fig.1.). Input current of conventional AC-mains-connected SPC is usually highly distorted and therefore the input power quality (PQ) is bad.
Input PQ of SPC is characterized by power factor (PF) and input current total harmonic distortion (THD) [1]. PF by definition is the real power Preal ratio to apparent power Papp [1], [2]. Input current THD is directly related to PF as follows [2]
/
) cos(
/P 1 THD2
Preal app
PF
M
, (1)where φ is phase angle between input voltage and current fundamental harmonics. The higher THD of SPC input current is, the lower PF is and the worse PQ is. In an ideal case AC line current is purely sinusoidal, so it has only one spectrum component at mains frequency (fmains). In a real case of course AC line current is distorted and harmonics of fmains appear in its spectrum.
SPC are major sources of electromagnetic interference (EMI). Various EMI suppression techniques have been proposed and used over the last decades including EMI filters, ferrite beads, etc [3] - [6]. One of the novel yet simple and cheap techniques known today
for EMI reduction in SPC is so called spread spectrum technique [4] – [8]. Spreading the spectrum of SPC voltages and currents and consequently noticeable peak EMI levels reduction can be easily achieved through the modulation of switching frequency fsw periodically, randomly or even chaotically [7], [8]. Periodic switching frequency modulation (SFM) is widely used in practice because it is very cheap and simple method. To implement periodic SFM usually simple periodic modulating waveforms (such as sine, triangle, sawtooth, etc) are often used. The main parameters of periodic SFM are switching frequency deviation Δfsw, modulation
frequency fmand modulating waveform.
Although SFM is very useful to reduce EMI, it is reported in several papers that the technique can increase THD of SPC input current and reduce PF [5], [6], [9]. For example in [6] and [9] it is experimentally verified that SFM can increase THD of power factor correctors (PFC) appreciably. Appearance of modulation frequency fm harmonics in the PFC input current spectrum was also observed in the papers. But in [5] experiments and simulations of resonant inverter for induction heating appliances show that mains input current THD increases by several %.
Despite the fact that the effect of SFM on AC-mains-connected SPC input current THD and PF was studied in [5], [6] and [9], clear and detailed explanation why SFM can degrade the input PQ and increase input current THD is not presented in the papers. Moreover the effect of SFM on PQ of conventional AC-mains-connected SPC with large capacitance filtering capacitor following diode bridge are not examined in the papers.
In this paper the effect of periodic SFM on PQ and THD of conventional AC-mains-connected flyback
AC mains 220V, 50Hz
Cin
iacin
DC/DC
converter
idcin
Load
Fig.1. Block diagram of a conventinal AC-mains-connected SPC.
_____________________________________________________________________________________________________________
converter will be studied in details theoretically, using SIMULINK simulations and experimentally.
II. ANALYSIS OF INPUT CURRENT SPECTRUM OF SPC
In this section spectrum of conventional AC-mains-connected SPC AC input current iacin will be analyzed with and without SFM. It is assumed in the paper that the DC/DC converter is flyback (Fig. 2).
A. Without SFM
As an example simulated iacin waveform and its spectrum without SFM depicted in Fig.3(a,b).When SFM disabled then input AC current consists of two components: narrow pulses with AC mains frequency
fmains and high frequency (HF) switching ripples with fsw. In frequency domain iacin consists of fmains harmonics and spectrum components at fsw and its multiples.
B. With SFM
When SFM enabled iacin consists not only of the narrow current pulses and HF switching ripples but also of low frequency (LF) ripples with fm caused by SFM (Fig. 3(c)). Moreover SFM causes interharmonics with frequencies nfm±mfmains(where m=1, 2, 3….and n=1, 2,
3….) in the LF region of iacin spectrum. The LF interharmonics can increase THD of iacinif they appear in the frequency range of a power analyzer. Moreover the LF interharmonics can be regarded as EMI in the LF region (this is because several standards, e.g. CISPR16 require EMI measurements from 9 kHz).
Now it is of importance to find out the cause of the LF interharmonics in iacin spectrum. For this purpose flyback converter DC input current idcinwill be analyzed first. In Fig. 4 simulated idcin of flyback SPC with and without SFM in time and frequency domains is shown. When SFM is not used then there are no LF components in idcin spectrum (Fig. 4(b)). However when SFM is used then noticeable LF components at fm and its multiples appear in idcin spectrum (Fig. 4(d)). It is logically that
these LF components in idcin spectrum are responsible for fm interharmonics in iacin spectrum.
It is rather well known from power electronics that for the analysis of SPC in the LF region method of averaging can be used [3]. In fact the method is also used in [10] to calculate LF output voltage ripples due to SFM and in [11] to analyze the effect of SFM on boost DC/DC SPC input current in the LF region. Input DC current of flyback converter averaged to switching period Tswis
sw m
dcin dcin
f L
V D i
2
2
(2)
where D is duty ratio; Vdcin is flyback converters DC input voltage; Lm is flyback transformer magnetizing inductance. Since fsw is modulated then instantaneous switching frequency
) ( )
(t f 0 f mt
fsw sw 'sw
,
(3)where m(t) is the modulating waveform (e.g. sine) with
unitary amplitude; fsw0 is central switching frequency; Δfsw is switching frequency deviation. This means that
0.075 0.08 0.085 0.09
-3 -2 -1 0 1 2 3 4
time, s
time, s
iacin
, A
iacin
, A
(c)
0.11 0.115 0.12 0.125 0.13
-4 -2 0 2 4
(a)
1/fmains
frequency, Hz
103 104 105
0 0.05 0.1 0.15 0.2
0.25AC mains harmonics
fsw harmonics
Amplitude, A
(b)
103 104 105
0 0.05 0.1 0.15 0.2 0.25
(d) AC mains
harmonics
fm interharmonics
due to SFM fsw sideband due to SFM
frequency, Hz
Amplitude, A
pd
Fig.3. Simulated iacinof AC-mains-operated flyback SPC in DCM: (a) in time domain without SFM; (b) in frequency domain without SFM; (c) in time domain with SFM; (d) in frequency domain with SFM. (Parameters: fm=8kHz; Δfsw=30kHz; fsw=100kHz; Vinrms=220V;
fmains=50Hz; D=0.2; Cin=50μF; Lm=200μH).
Cout R
out
PWM Control
idcin
Fig.2. Schematic diagramm of flyback DC/DC converter.
_____________________________________________________________________________________________________________
<idcin> of SFM flyback converter is switching frequency dependent as follows
) (t f L V D i sw m dcin dcin 2 2
. (4)
Assuming that Δfsw is much lower than fsw0 then 1st
order-Taylor-series-approximation can be used
) (t m f f L V D f L V D i sw sw m dcin sw m dcin dcin 2 0 2 2 2 2 '
| . (5)
Eq. (5) clearly shows that SFM results in fm harmonics in idcin spectrum, because input DC current of flyback converter in DCM is fsw dependent. The amplitudes of the LF harmonics for open-loop flyback SPC with SFM can be calculated as follows
m dcin sw sw mn dcn L V D f f d C 2 2 2 0 '
| (6)
where dmn is m(t) Fourier series complex coefficients
(for sine m(t) dmnis 1). Since SFM induces LF ripples in output voltage of SPC [10], then PWM control changes instantaneous duty ratio to minimize the LF variations when fm<fc (where fc is open loop crossover frequency). So for closed loop SFM flyback SPC the amplitudes of the LF harmonics can be calculated as follows
) (s T L V D f f d C m dcin sw sw mn dcn ' | 1 1 2 2 2 0
, (7)
where T(s) is open loop gain in DCM. In (7) s=j2πnfm. SFM flyback SPC input AC current iacin spectrum components can be calculated assuming that the LF fm
harmonics in idcin interact with fmains harmonics. As a result SFM causes fm interharmonics with frequencies
nfm±mfmains in iacin spectrum. So, SFM SPC iacin
amplitudes of spectrum components in LF region can be derived as follows
mainsm en cin br s dcn
acm d I
Z R Z
C
C
x
1
(8)
where Imainsm is fmains harmonics complex amplitudes without SFM; where den is complex amplitudes of spectrum of equivalent rectangular pulse train with unitary amplitude (the duration of the pulse trains is equal to pd (Fig.3(a))); ZCin is input capacitor complex impedance; Zsis power source complex impedance; Rbr
is diode bridge forward resistance;
means convolution. It is clearly seen in Fig. 3(d) and Fig. 4(d) that fm inetrharmonics amplitudes in iacin spectrum caused by SFM are several times lower than amplitudes of fm harmonics in idcin spectrum. This is due to two reasons: firstly, input filtering capacitor Cin partly reduces the amplitudes of the LF components; secondly, the AC input currentiacinflows only short time interval 2pd (Fig. 3(a)). The same conclusion can also be deduced from (8).
Simulation results revealed that THD of iacin with SFM (fm=1kHz; Δfsw=30kHz) increases only by 0.5 %
due to SFM when fm=1kHz. For other fm values increase in THD was even lower.
III. EXPERIMENTS
For experimental investigation conventional AC-main-connected flyback switching power converters have been designed and experimented. The flyback converter operates in DCM and its nominal output power 40W. The experimental SPC can operate in both modes: with and without SFM. The simplified schematic
104 105
0 0.1 0.2
1 04 1 05
0 0 . 2 0 . 4
0 . 13 2 7 0 . 13 2 8 0 . 13 2 9 0 .13 3 0 .13 3 1 0 . 13 3 2
0 0 . 5 1 1 . 5 2 2 . 5 3 time, s time, s idcin , A idc in , A (c) (a) frequency, Hz
fsw harmonics
Ampl
itude, A (b)
(d)
fm harmonics
due to SFM
fsw sideband due to SFM
frequency, Hz Am pl itu d e , A
0.133 0.133 0.133 0.133 0.133 0.133 0.133 0 0.5 1 1.5 2 2.5
0 .08 2 9 0 .08 3 0 .08 3 0 .08 3 1 0 .08 3 1 0 .08 3 2 0 .08 3 2
1 2 3
fm
Fig.4. Simulated idcinof DC/DC flyback SPC in DCM: (a) in time domain without SFM; (b) in frequency domain without SFM; (c) in time domain with SFM; (d) in frequency domain with SFM. (Parameters: fm=8kHz; Δfsw=30kHz;fsw=100kHz; D=0.2).
Load Power analyzer TTI HA 1600 Low Distortion AC Power Source TTI AC1000A SPC under test 220V 50Hz
Fig.5. Block diagram of the experimental setup.
_____________________________________________________________________________________________________________
diagram of the experimental setup is shown in Fig. 5. AC input current THD and power factor have been measured with and without SFM using high quality power and harmonics analyzer TTI HA1600. The measurement results are tabulated in Table 1 and Table 2 for different values of Δfsw, and fm.
The results presented in Tables 1 and 2 confirm theoretical predictions that increase in THD is negligible (<0.5%) for conventional SPC due to the use of SFM. Moreover PF remains constant even for high Δfsw. Slight
increase in THD is due to fm interharmonics in input AC current spectrum. For higher values of Δfsw THD is
slightly higher. Choice of fm slightly affect THD: when
fm-fmains higher than power analyzer maximum analysis frequency fmax (e.g. TTI HA1600 measure harmonics up to fmax=2kHz) then the power analyzer cannot see the interharmonics of fm due to SFM and measured THD is the same as for SPC without SFM. When fm<1kHz then THD is the same as for unmodulated case. This can be described by (7): for lower fm open loop gain T(s) is higher and therefore Cdcn are lower.
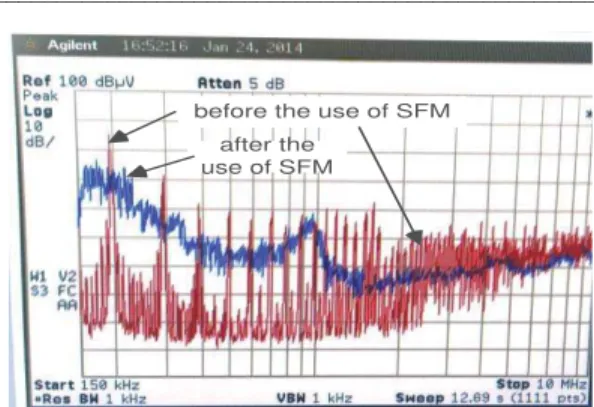
After the power quality has been measured conducted EMI of the experimental flyback SPC was also measured using a spectrum analyzer (with a peak detector and resolution bandwidth (RBW) of 1kHz) and line impedance stabilization network. As an example experimental conducted EMI spectrum in the frequency range 150kHz – 10MHz is shown in Fig.6. As it can be seen from Fig. 6 and Tables 1 and 2 SFM can lead to noticeable conducted EMI reduction in SPC without degrading input power quality of conventional SPC.
TABLE I. FLYBACK CONVERTER THD AND PF VS MODULATION FREQUENCY (NOMINAL LOAD;ΔfSW=30KHZ;fsw=80KHZ).
fm, kHz THD, % PF
unmodulated 91.5 0.414
0.5 91.5 0.414
1 91.8 0.414
2 91.8 0.414
5 91.5 0.414
TABLE 2. FLYBACK CONVERTER THD AND PF VS SWITCHING FREQUENCY DEVIATION (NOMINAL LOAD;fm=1KHZ;fsw=80KHZ).
Δfsw, kHz THD, % PF
10 91.5 0.414
30 91.8 0.414
IV. CONCLUSIONS
Comprehensive study of the effect of SFM on power quality of conventional AC-mains-connected SPC shows that SFM is very effective technique for conducted EMI reduction without noticeable degradation of input power quality characterized mainly by THD and PF. This is because conventional AC-mains-connected SPC have inherently high current THD and slight increase in THD is not a problem. Moreover THD cannot increase significantly due to SFM because they have large capacitance filtering capacitor following a rectifier and due to the fact that the AC input current flows only short time interval. Obviously in PFC which inherently has small input current distortion and which do not have large capacitance input filtering capacitor, the use of SFM is much more problematic.
REFERENCES
[1] C.K.Tse, “Circuit theory of power factor correction in switching converters”, International Journal of Circuit
Theory and Application, vol. 31, pp. 157-298, 2003. [2] W.M. Grady, R.J. Gilleskie, “Harmonics and How They
Relate to Power Factor”, EPRI Power Quality Issues &
Opportunities Conference, 1993.
[3] R. W. Erickson, D. Maksimovic, Fundamentals of Power Electronics. New York: Kluwer Academic Publishers, 2nd Ed., 2001. – 900 p.
[4] H. Li, Z. Li, B. Zhang, K.S. Tang, W.A. Halang,
“Suppressing electromagnetic interference in direct current converters”, IEEE Circuits and Systems Magazine, vol.9,
no.4, pp. 10-28, 2009.
[5] L. Barragan, D. Navarro, J. Acero, I. Urriza and J-M
Burdío, “FPGA Implementation of a Switching Frequency
Modulation Circuit for EMI Reduction in Resonant
Inverters for Induction Heating Appliances”, IEEE Trans.
on Industrial Electron., vol. 55, No.1, pp. 11 – 20, Jan. 2008.
[6] D. Gonzalez, J. Balcells, A. Santolaria, J. Bunetel, J.
Gago, D. Magnon, S. Brehaut, “Conducted EMI Reduction
in Power Converters by Means of Periodic Switching
Frequency Modulation”, IEEE Transactions on Power
Electronic, Vol.22, No.6, pp. 2271-2281, 2007.
[7] K. Tse, H. Chung, R. Ng, S. Hui, “An Evaluation of the
Spectral Characteristics of Switching Converters with Chaotic-Frequency Modulation”, IEEE Trans. on
Industrial Electronics, Vol. 50, No.1, pp. 171-181, 2003. [8] K. Tse, H. Chung, S. Hui, H. So, “Comparative Study of
Carrier-Frequency Modulation Techniques for Conducted
EMI Suppression in PWM Converters”, IEEE Trans. on Industrial Electronics, Vol. 49, No.3, pp. 618-627, 2002. [9] J.-C. Bunetel, D. Gonzalez, J. Balcell, “Impact of periodic
switching frequency modulation control to reduce
conducted EMI in power factor correctors,” in Proc. of the
32nd Annual Conference of IEEE Industrial Electronics Society, Paris, France, Nov. 7-10, 2006. – pp. 2541-2545. [10]D. Stepins, J. Jankovskis, “Reduction of output voltage
ripples in frequency modulated power converter”,
Elektronika ir Elektrotechnika, No. 3, pp. 45 – 48, 2012. [11]D. Stepins, “Effect of frequency modulation on input
current of switch-mode power converter”, in Proc. 39th
Annual Conference of the IEEE Industrial Electronics Society, IECON 2013, pp. 683-688.
before the use of SFM
after the use of SFM
Fig.6. Experimental conducted EMI spectrum of SFM AC-mains-connected flyback SPC operating in DCM. (Parameters: fm=2kHz;
Δfsw=30kHz, fsw=80kHz).
_____________________________________________________________________________________________________________