Universidade Federal do Rio Grande do Norte Centro de Ciências Exatas e da Terra
Departamento de Informática e Matemática Aplicada Mestrado Acadêmico em Sistemas e Computação
A probabilistic analysis of the biometrics
menagerie existence: case study in
fingerprint data
Rayron Victor Medeiros de Araújo
Rayron Victor Medeiros de Araújo
A probabilistic analysis of the biometrics menagerie
existence: case study in fingerprint data
Master’s thesis presented to the Graduate Program in Systems and Computing of the Department of Informatics and Applied Math-ematics at the Federal University of Rio Grande do Norte as a partial requirement for the degree of Master in Systems and Com-puting.
Universidade Federal do Rio Grande do Norte – UFRN
Departamento de Informática e Matemática Aplicada – DIMAp
Supervisor: Márjory Da Costa-Abreu
Araújo, Rayron Victor Medeiros de.
A probabilistic analysis of the biometrics menagerie existence: case study in fingerprint data / Rayron Victor Medeiros de Araújo. - Natal, 2016.
48f: il.
Orientadora: Profa. Dra. Marjory Cristiany da Costa Abreu. Dissertação (Mestrado) - Universidade Federal do Rio Grande do Norte. Centro de Ciências Exatas e da Terra. Programa de Pós-Graduação em Sistemas e Computação.
1. Biometric menagerie. 2. Zoológico biométrico. 3. Impressão digital. I. Abreu, Marjory Cristiany da Costa. II. Título.
Catalogação da Publicação na Fonte
RAYRON VICTOR MEDEIROS DE ARAÚJO
A probabilistic analysis of the biometrics menagerie existence: a
case study in fingerprint data
Esta Dissertação foi julgada adequada para a obtenção do título de mestre em
Sistemas e Computação e aprovado em sua forma final pelo Programa de
Pós-Gradua-ção em Sistemas e ComputaPós-Gradua-ção do Departamento de Informática e Matemática Aplicada
da Universidade Federal do Rio Grande do Norte.
__________________________________________________________ Dr. Bruno Motta de Carvalho – UFRN
(Presidente)
__________________________________________________________ Dr. Uirá Kulesza – UFRN
(Coordenador do Programa)
Banca Examinadora
____________________________________________________________ Dra. Marjory Cristiany da Costa Abreu – UFRN
(Orientadora)
____________________________________________________________ Dr. Daniel Sabino Amorim de Araujo – UFRN
(Examinador)
____________________________________________________________ Dr. George Darmiton da Cunha Cavalcanti – UFPE
(Examinador)
Acknowledgements
Resumo
Até pouco tempo atrás o uso de biometria se restringia a ambientes de alta segurança e aplicações de identificação criminal por razões de natureza econômica e tecnológica. Contudo, nos últimos anos a autenticação biométrica começou a fazer parte do dia a dia das pessoas. Desde então, alguns problemas de autenticação entraram em evidência, como a impossibilidade de votar numa eleição porque o indivíduo não tinha sua impressão digital reconhecida. Isso acontece, pois os usuários de um sistema biométrico podem ter diferentes graus de acurácia, principalmente em sistemas de utilização em larga escala. Alguns desses usuários podem ter dificuldade na autenticação, enquanto outros podem ser, particularmente, vulneráveis à imitação. Estudos recentes investigaram e identificaram esses tipos de usuários, dando-lhes nomes de animais: Sheep, Goats, Lambs, Wolves, Doves, Chameleons, Worms e Phantoms. O objetivo desse trabalho é avaliar a existência desses tipos de usuários em uma base de dados de impressões digitais e propor uma nova forma de investigá-los, baseando-se no desempenho das verificações entre amostras. Nossos resultados identificaram a presença de goats,lambs, wolves,chameleons e phantoms, além de demonstrar a ausência de worms e doves, em um sistema biométrico proposto.
Abstract
Until recently the use of biometrics was restricted to high-security environments and criminal identification applications, for economic and technological reasons. However, in recent years, biometric authentication has become part of daily lives of people. Since then, some authentication problems are in evidence, as the inability to vote in an election because the individual did not have his fingerprint recognized. This is because users of a biometric system may have different degrees of accuracy, especially in large-scale systems. Some people may have trouble authenticating, while others may be particularly vulnerable to imitation. Recent studies have investigated and identified these types of users, giving them the names of animals: Sheep, Goats, Lambs, Wolves, Doves, Chameleons, Worms and Phantoms. The aim of this study is to evaluate the existence of these users types in a database of fingerprints and propose a new way of investigating them, based on the performance of verification between subjects samples. Our results identify the presence of goats, lambs, wolves, chameleons and phantoms, as well as demonstrate the absence of worms and doves in a proposed biometric system.
List of Figures
Figure 1 – Registration and recognition (verification and identification) steps of a
biometric system . . . 15
Figure 2 – Ridge ending and bifurcation example. . . 16
Figure 3 – NBIS’s MINDTCT module system architecture . . . 17
Figure 4 – Minutiae comparison within the fingerprint . . . 19
Figure 5 – The relationship between genuine score and impostor score, and the biometric menagerie. . . 24
Figure 6 – Examples of fingerprints samples from the CASIA-FingerprintV5 database 28 Figure 7 – The distribution region where we find possible chameleons. . . 31
Figure 8 – Verification scheme. . . 32
Figure 9 – Distribution of the mean worst genuine match scores . . . 34
Figure 10 – Histogram of the mean worst genuine match scores . . . 35
Figure 11 – Examples of Goats . . . 36
Figure 12 – Distribution of the mean higher impostor match scores . . . 36
Figure 13 – Histogram of the mean higher lamb scores . . . 37
Figure 14 – Histogram of the mean higher wolf scores . . . 38
Figure 15 – Examples of Lambs and Wolves . . . 39
Figure 16 – Relationship between genuine and impostor match scores . . . 40
Figure 17 – Examples of New Animals . . . 41
Figure 18 – Number of fingers by user belonging to each animal. . . 42
Figure 19 – Location of the indicative of animals . . . 44
List of Tables
List of abbreviations and acronyms
EER Equal Error Rate, ou Taxa de Erro Igual
FAR False Acceptance Rate, ou Taxa de Falsa Aceitação
FRR False Rejection Rate, ou Taxa de Falsa Rejeição
MINDTCT Minutiae Detector, ou Detector de Minúcias
PIN Personal Identification Number, ou Número de Identificação Pessoal
Contents
1 Introduction . . . 11
1.1 Motivation . . . 11
1.2 Goals . . . 12
1.3 Overview . . . 12
2 Biometrics Systems . . . 13
2.1 Verification and Identification . . . 14
2.2 Fingerprint . . . 15
2.3 Feature Extraction . . . 16
2.4 Matching Algorithm . . . 18
2.4.1 BOZORTH3 . . . 18
2.4.2 Genuine Match Score e Impostor Match Score . . . 20
2.4.3 False Acceptance and False Rejection . . . 20
3 The Biometric Menagerie . . . 21
3.1 The First Four Animals . . . 22
3.2 The Other Four Animals . . . 23
3.2.1 Chameleons, Phantoms, Doves and Worms . . . 23
3.3 Evaluation Methods . . . 24
3.4 Conclusion . . . 26
4 Experiments . . . 27
4.1 Experimental Data . . . 27
4.2 Pre-Processing . . . 27
4.3 Animals Existence Test . . . 28
4.3.1 First Animals . . . 28
4.3.2 New Animals . . . 30
4.4 Animals Analysis Based on Samples . . . 30
4.4.1 Experiment . . . 31
5 Results and Discussion . . . 33
5.1 Analysis of Animals Existence . . . 33
5.1.1 Goats . . . 33
5.1.2 Lambs and Wolves . . . 34
5.1.3 Chameleons, Phantoms, Worms, and Doves . . . 37
5.2 Analysis by Fingers . . . 41
5.3 Animals Analysis Based on Samples . . . 42
11
1 Introduction
Biometrics is the science of recognizing humans based on the physical or behavioral traits of an individual. Examples of these traits include face, fingerprint, iris, hand geometry, voice, and gait (JAIN; ROSS; PRABHAKAR, 2004; JAIN; FLYNN; ROSS, 2008). The use of biometrics as an authentication mechanism is already present in daily life. Several applications make use of biometrics, such as access to restricted environments, access to devices and resources, money withdrawal, elections, countries immigration, granting access to nuclear facilities, etc. This is due to the lower cost of deployment of such systems (RILEY; KLEIST, 2005) and from the inherent benefits of exchange for other forms of
identification, such as the use of a personal identification number (PIN) and password.
Along with the increase in applications that make use of biometrics as a form of authentication, it was necessary to identify which users are having inconsistent performance (e.g. difficulties in identifying, impersonation, etc) (HECK et al., 1997). In (DODDINGTON et al., 1998), this inconsistency was shown and, from it, was introduced the concept of biometrics menagerie (also called biometrics zoo), which categorizes the users according to their associated performance identification. Four user groups were identified and each group received the name of an animal that resembles in its behavior, namely: sheep, goats, lambs and wolves. More recently, in (YAGER; DUNSTONE, 2007), was identified more four other user groups: doves, chameleons, worms and phantoms. Each of these animals behave differently under the system.
This new method of investigation and analysis of biometric systems differs from traditional evaluation methods that focus on global error statistics such as ROC (Receiver Operating Characteristic) curves and EER (Equal Error Rate). These statistics are useful for evaluating a biometric system as a whole, but ignore problems associated with users.
1.1
Motivation
Several studies demonstrate that only a small fraction of a biometric system users presents inconsistencies in the identification performance, but users within the biometrics menagerie compose much of this fraction (DODDINGTON et al., 1998; POH; KITTLER, 2008; POH; KITTLER, 2009; HICKLIN; WATSON; ULERY, 2005). Thus, there are many reasons which encourage the characterization of an individual in the biometrics menagerie:
Chapter 1. Introduction 12
• Allows to identify which individuals are subject to impersonation and which are impersonating other users (RATTANI; POH; ROSS, 2012).
• Allows to add protection mechanism according to the behavior of each individuals group, either by using a selective multimodal fusion strategy (POH et al., 2013; WANG et al., 2012; ROSS; RATTANI; TISTARELLI, 2009) or simply by analyzing the reasons why the users have a poor identification performance and trying to mitigate the effects of such problems (WITTMAN; DAVIS; FLYNN, 2006).
1.2
Goals
In this work we investigate the presence of users groups (biometrics menagerie) in different biometric identification systems based on fingerprint and analyse the reasons why they are present or not. Also, we investigate how each finger of a user behaves in the biometric menagerie trying to find evidence of users who have more than one finger behaving like each biometric animal. To do so, the following goals were set:
• Demonstrate how to use the biometric menagerie to evaluate a real biometric system.
• Check the presence of users groups (biometric menagerie) in different databases.
• Analyse how to mitigate the effects caused by the users in the biometric menagerie.
• Analyse how different fingers of a user behave in a biometric system.
1.3
Overview
13
2 Biometrics Systems
In biometrics authentication systems, there are often inconsistencies in the identifi-cation of some users, who may be falsely rejected or accepted in the system. That being said, those responsible by such biometric systems are interested in identifying groups of users who have poor identification performance because they can be the cause of a dispro-portionate number of verification errors. An analysis of users and the traits in common between them, can expose a key vulnerability in a biometric system, and addressing this vulnerability, you can make more robust biometric systems (YAGER; DUNSTONE, 2009).
A biometric authentication system recognizes (or verify) the identity of an individual (or someone claiming to be that individual). This operation may be necessary for several reasons, but the primary purpose, in many applications, is to prevent impostors to have access to protected resources. Traditional methods use passwords and mechanisms for tokens (ID cards), however these forms of identity representation can be easily lost, shared or even stolen. The biometrics-based authentication provides a natural and reliable solution for certain aspects of identity management, because you can use fully or partially automated schemes to recognize individuals based on biological characteristics of them (JAIN; ROSS; PRABHAKAR, 2004). In some applications, biometrics may be used in
conjunction with passwords and ID cards to enhance the security level.
Biometrics offers certain advantages such as negative recognition and non-repudiation that cannot be provided by tokens and passwords. The negative recognition is the process by which the system determines that a particular individual is registered in the system even if that individual deny such access. This is especially critical in applications such as elections, in which an impostor might try to vote multiple times under different names. The non-repudiation is a way to ensure that an individual who accesses a certain facility can not subsequently deny that access (e.g. a person accesses a computer and then says that an impostor must have used fake credentials).
Chapter 2. Biometrics Systems 14
2.1
Verification and Identification
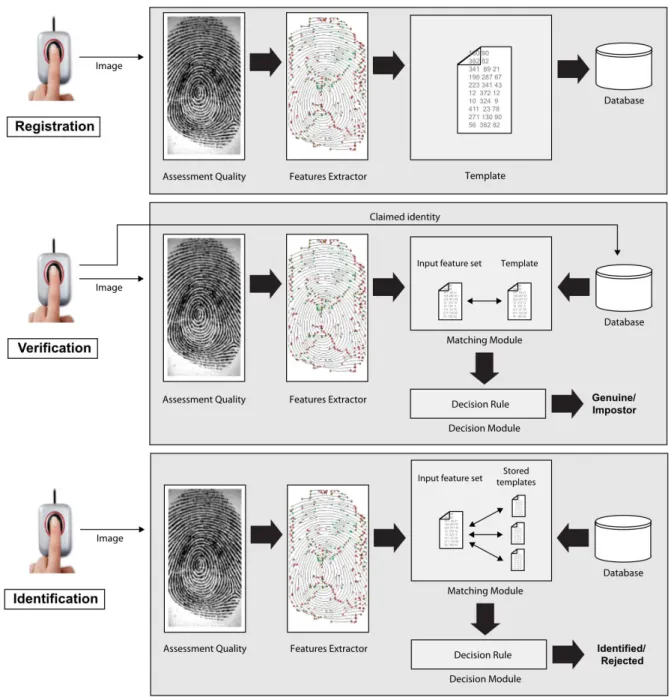
Depending on the application, a biometric system can work in verification or identification mode, see Figure 1. In verification mode, the biometric fingerprint system tries to validate the identity of a person comparing the fingerprint captured by the sensor with its own template1
stored in the database system. In these systems, the individual who wants to be recognized enters some data indicating his identity, usually a card, username or PIN, and the system makes a one-to-one comparison to determine whether or not he is who it claims to be. Thus, it is as if we did the following question: “is this user who he claims to be?”. In the criminal area, for example, when you have a suspect and a fingerprint at the scene, we can make a verification to determine if the suspect is or not guilty. In this case there is no need for a PIN or card because we are trying to validate the individual’s identity. Verification is generally used for positive recognition, in which the aim is to prevent multiple people using the same identity.
However, in an identification biometric system, the system recognizes an individual by making a comparison with all templates stored in the database. Therefore, the system makes a comparison one-to-many searching for the individual’s identity, and may fail if the individual does not have registered in the system. Systems like this answer the question: “whose biometric is this”?. In the criminal area, when there is only a fingerprint at the crime scene, and no suspects, we can make an identification searching for that fingerprint in the database of the government agency competent with the registry of people. The identification is a critical component in negative recognition applications in which the system establishes whether a person is who he/she denies being. The purpose of the negative recognition is to prevent the same person using multiple identities.
From Figure 1 we can note that the feature extraction, matching and decision modules are of fundamental importance in a biometric system. This is because, depending on the choice of the algorithm modules mentioned, the system performance may be affected in different ways. In this work, specifically, the feature extraction and matching modules used are MINDTCT (WATSON et al., 2007b) (fingerprint minutiae detector) and BOZORTH3 (WATSON et al., 2007a), respectively. These modules are contained in the NBIS2
(NIST Biometric Image Software), developed by the Federal Bureau of Investigation (FBI).
1 Set of extracted fingerprint features of an individual; usually position and orientation. During the
registration of an individual in the system this set of features is stored in a database and often called template.
Chapter 2. Biometrics Systems 15
Figure 1 – Registration and recognition (verification and identification) steps of a biometric system
Source: the author. The quality assessment module determines whether an image from the sensor can be effectively used by the feature extraction module.
2.2
Fingerprint
Chapter 2. Biometrics Systems 16
The fingerprint of an individual is unique, although suffers changes due to wear or cuts throughout life. A fingerprint is formed from a fingerprint ridges pattern. A ridge is defined as a single curved segment, and the valley as the region between two adjacent ridges. The minutiae, which are discontinuities in the local ridge flow pattern, provide the features that are used for authentication (JAIN et al., 1997).
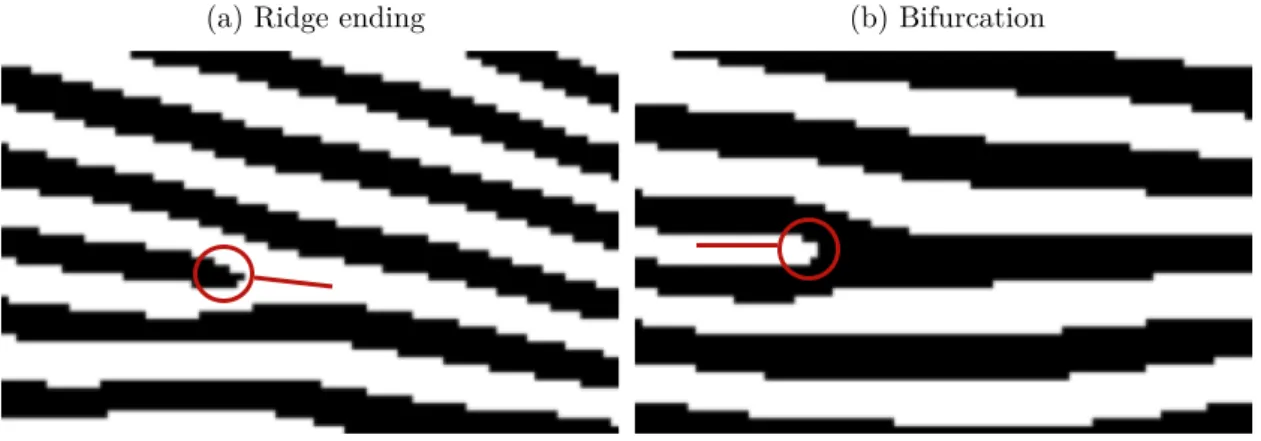
In (GALTON, 1982) was defined a set of features for fingerprint identification, which since then has been redefined to include additional types of features. However, most of these features are not commonly used in fingerprint identification systems. Instead, the set of minutiae types is restricted to only two: bifurcations and ridge endings. Ridge endings are the points where the curves of the ridge ends, and bifurcations are where the ridges, from a single path, split into two paths. Figure 2 illustrates an example of a ridge ending and a bifurcation. In this example, the black pixels represent ridges and the white pixels represent valleys of a fingerprint.
Figure 2 – Ridge ending and bifurcation example.
(a) Ridge ending (b) Bifurcation
It is very rare to have fingerprint images of perfect processing quality. Usually, they can be degraded or corrupted with noise elements due to several factors including changes in skin and printing conditions.
2.3
Feature Extraction
In order to identify the fingerprint minutiae which are used by the matching algorithm, a feature extraction algorithm is needed. For this study we used the MINDTCT algorithm (WATSON et al., 2007b). The reasons why the MINDTCT was used are: is open source; it is widely used commercially, mainly by the FBI and is also widely used in other studies on biometrics.
Chapter 2. Biometrics Systems 17
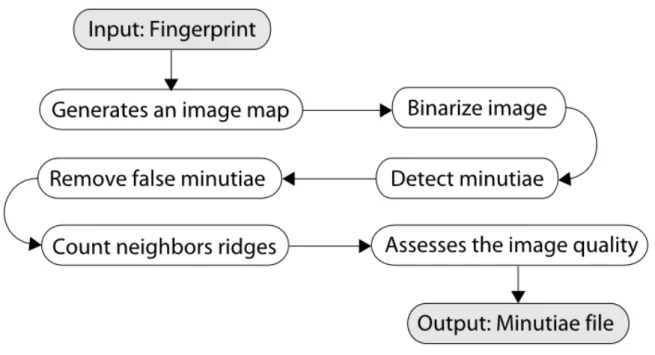
The MINDTCT architecture is shown in Figure 3, and can be divided into the following steps: (i) generation of image quality map; (ii) binarization; (iii) minutiae detection; (iv) removing false minutiae; (v) counting of ridges between a minutia point and its nearest neighbor; and (vi) minutiae quality assessment.
Figure 3 – NBIS’s MINDTCT module system architecture
Due to variation of image quality in a captured fingerprint image, NBIS analyzes the image and locates areas that are degraded. Several features are measured, including low-contrast regions, incoherent ridges flows and high curvatures. These three conditions represent unstable areas in the image where the minutiae detection is unreliable and, together, they are used to represent the levels of quality in the image. An image quality map is generated by integrating these three features. The images are divided into non-overlapping blocks, where a quality level between one and five is assigned to each block.
The minutiae detection step scans the binarized fingerprint image, identifying local pixels patterns indicating a ridge ending or a bifurcation. A set of minutiae patterns is used to detect points of candidate minutiae. Subsequently, false minutiae are removed and the remaining candidates are considered true minutiae in the image.
Chapter 2. Biometrics Systems 18
2.4
Matching Algorithm
A biometric system rarely finds two samples of biometric characteristics from an user that look exactly alike. This is due to acquisition conditions (e.g. noise in fingerprint due to sensor malfunction), changes in ambient light, variations in user interaction with the sensor (e.g. capture only part of the printing). In fact, a perfect match between two sets of characteristics may indicate the possibility of playing an attack on system. The variability observed in the set of biometric characteristics of a individual is called intra-class variation, and variability between sets of characteristics originated from two different individuals is called inter-class variation.
To determine whether two fingerprints are from the same person, an algorithm is required to calculate how they are related. This algorithm is called a matching algorithm. In this study we used the BOZORTH3 matcher (WATSON et al., 2007a) as matching algorithm. The reasons why the BOZORTH3 was used are the same as the MINDTCT. The BOZORTH3 matcher is a minutiae-based algorithm that calculates a score (match score) that represents the similarity of two fingerprints. This algorithm is a modified version of a matching algorithm between fingerprints written by Allan S. Bozorth while working in the FBI.
2.4.1
BOZORTH3
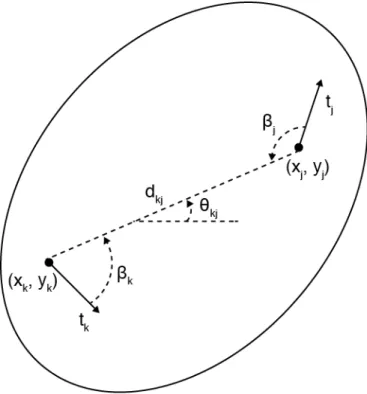
The BOZORTH3 uses only the location (x, y) and orientation (t) of the minutiae points to compare the prints, and it’s invariant to rotation and translation. The algorithm can be described in three steps: (i) construction of two minutiae comparison tables intra-fingerprint; (ii) construction of inter-fingerprint compatibility table; and (iii) generation of the match score using digital inter-fingerprint compatibility table.
For each fingerprint being compared a minutiae comparison table intra-fingerprint is established. In this table are stored relative distances and orientations from the minutiae of the same fingerprint. These are the measures that provide rotation and translation invariance to the algorithm.
Figure 4 illustrates the measures between minutiae that are used. There are two minutiae in this example. The minutia k is at the bottom left of the fingerprint and is represented by a point in the location (xk, yk) and the arrow pointing down and right is
the orientationtk. A second minutia j is at the top and right with up and right orientation.
To measure the relative translation, the distance dkj between the location of the minutiae
is calculated. This distance will remain relatively constant between corresponding points in different fingerprints of the same person, even if there is rotation or displacement between prints.
Chapter 2. Biometrics Systems 19
Figure 4 – Minutiae comparison within the fingerprint
Source: Watson et al. (2007a). Distances and orientations between two minutiae.
each minutia pairing, the angle between the orientation of the minutia and the intermediate line between the two minutiae. Thus, these angles remain relatively constant over the intermediate line between the minutiae, regardless of the amount of rotation that is applied in print. In Figure 4, the intermediate line angle θkj between the minutiae is calculated
by taking the arctangent of the line inclination. The angles βk andβj are calculated in
relation to the intermediate line by adding θkj and each minutiae orientation t. Entries
in the minutiae comparison table are stored in increasing distance order and the table is trimmed in point whose distance exceeds a maximum threshold.
The next step is to look for compatibility between the two intra-fingerprint tables. The entries of the tables are compatible if: (i) the corresponding distances and (ii) the relative angles of the minutiae are within a specified tolerance, that by default is only 1 unit. A inter-fingerprint compatibility table is generated and includes only matching entries. An entry of this table incorporates two pairs of minutiae, a pair from training template and a pair from test template. Thus, a inter-fingerprint table entry indicates that a minutiae pair from training template correspond to a minutiae pair from test template.
Chapter 2. Biometrics Systems 20
the number of compatible associations, the greater the matching score will be, and the more likely of the two digital be from the same person.
2.4.2
Genuine Match Score e Impostor Match Score
Consider a population of users P and a set of match scores S. For each pair of users j, k œ P, there is a set S(j, k) µ S containing all verification results obtained by comparing one of the j templates against a reference template belonging to k.
The genuine score of k-th user is represented by the set Gk = S(k, k), and the
impostor score by the set Ik =S(j, k)fiS(k, j) for allj ”=k. In other words, the genuine
score is the result of comparing two fingerprint samples of the same person, while the impostor score is the result of comparing two fingerprints samples of different people.
For each userk are assigned two values: one indicating how well it matches itself (gk) and another indicating how well it matches with other individuals (ik). Moreover, we
can think of a probability density function fS{•|j, k} as the distribution of match scores
obtained from comparing samples of j users against the user templates k.
2.4.3
False Acceptance and False Rejection
In a verification, when the match score exceeds a defined threshold valueη we say that fingerprints are from same person. An impostor score that exceeds the threshold η
results in a false acceptance while a genuine score that is below the threshold η results in a false rejection.
21
3 The Biometric Menagerie
In a biometric identification system, it is often that the system recognition per-formance varies significantly from one user to another. The result is that some users are falsely rejected by the system, while others are easily imitated by impostors. In the last decade, several groups of problematic users have been characterized, and each group was given the name of an animal that, similarly, reflects its behavior. The concept of biometric menagerie was formalized by Doddington et al. (1998) and the first animals were as follows:
a) Sheeps represent the majority of the population and are, usually, easy to identify;
b) Goatsare users generally difficult to identify. These users tend to have a low match score when compared with themselves. They represent a disproportionate increase in the false rejection rate FRR;
c) Lambsare individuals easy to imitate. Other users tend to have a relatively high match score when compared to lamb users. They represent a disproportionate increase in the false acceptance rate FAR;
d) Wolves are users good at imitating. When compared against other users, they tend to have a high match score. Like lambs, they represent a disproportionate increase in the false acceptance rate FAR.
Only goats, lambs and wolves contribute to a negative impact on the error rate of the system, so users in those categories are called weak users. Many papers (DODDINGTON et al., 1998; POH; KITTLER, 2008; POH; KITTLER, 2009; HICKLIN; WATSON; ULERY, 2005) confirm that the weak users constitute only a small fraction of the population in a biometric identification system; however their contribution in the error rate can be disproportionately high.
In a posterior study, by Yager e Dunstone (2007), new animals were distinguished. Are they:
a) Worms are individuals who, like goats, tend to have a low match score when compared against themselves. In addition, they also tend to receive a high match score when compared against some other individuals;
b) Chameleons are individuals who receive high match score when compared against any user, either himself, or another user;
Chapter 3. The Biometric Menagerie 22
d) Doves represent the most perfect users of the biometric system. They, like sheep, receive high match score when compared against themselves, but also receive low match score when compared against other users.
Table 1 – Resume for the eight animals
First four animals Four other animals
Sheep easy to identify Chameleons easy to identify and good at imitating
Goats difficult to identify Phantoms difficult to identify and poor at imitating
Lambs easy to imitate Doves easy to identify and poor at imitating
Wolves good at imitating Worms difficult to identify and good at imitating
The Table 1 shows a resume for the behavior of the eight animals. It is important to note that animals do not necessarily represent a distinct and mutually exclusive subset of users (DODDINGTON et al., 1998; WAYMAN, 2004). Indeed, it is possible that they do not even exist in a real system. The animals may be better understood as a tendency behavior and thus an individual may be more susceptible to attack than another, for example.
The study conducted on (DODDINGTON et al., 1998) was based on speech recognition data, but the concept of animals may be applied to any area in biometrics identification. Subsequently, several other studies have shown the animals existence in other biometrics. Wayman (2004) demonstrated the existence of lambs and wolves in data based on fingerprints with a high degree of significance; Wittman, Davis e Flynn (2006) examined the existence of animals in face recognition; Poh e Kittler (2008) shown, individually, the phenomenon in different biometrics; among others, as (YAGER; DUNSTONE, 2007).
All aforementioned studies presented methods to deal with the existence of animals in a biometric system.
With regard to the relationship between user groups, some questions arise. For example, the fact that a user is, notoriously, lamb makes it more likely to be goat? Doddington et al. (1998), in their study, reported a positive correlation between lambs and wolves users. In fact, lambs and wolves reflect a symmetry of matching algorithms. Wittman, Davis e Flynn (2006) showed that goats on average are also very poor when compared against other users. In other words, goats are very poor wolves.
3.1
The First Four Animals
The sheeps represent the majority of the population of a biometric system. On average, they tend to match well against themselves but not necessarily poor against other users.
Chapter 3. The Biometric Menagerie 23
the system performance to account for a disproportionate portion of false rejections.
Lambs are users easy to imitate. In general, they tend to produce a high match score when compared by other users. This is because its set of biometric characteristics significantly overlaps with the other users in the database. Similarly, wolves are good at imitating other users, and tend to receive a higher match score when compared against other users. As we can see, the definitions of lambs and wolves are symmetrical and both result in a disproportionate number of false acceptances of the biometric system.
Just like goats, there is not necessarily a distinct population of lambs and wolves. Instead, users show a varying degree of behavior lamb and wolf, respectively.
In (UNE; OTSUKA; IMAI, 2008), a measure known as wolf attack probability, which measures the maximum probability of success to impersonate a victim has been proposed.
3.2
The Other Four Animals
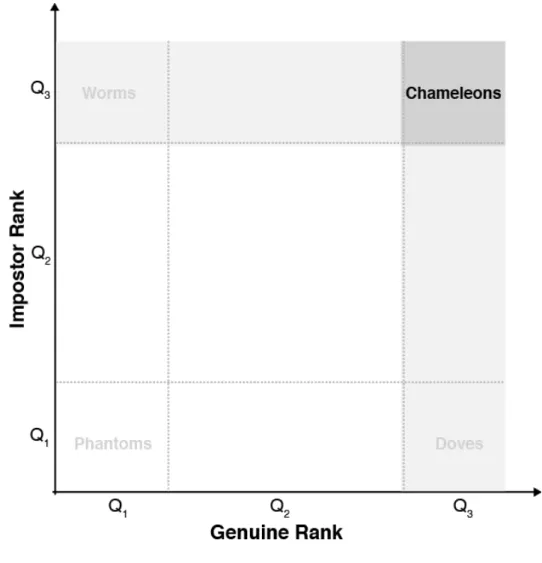
Goats, lambs and wolves were defined in terms of genuine or impostor match scores. The other four new animals, by contrast, are defined in terms of the relationship between the genuine score and impostor score. As well as the first four animals, the four other animals exist for at a certain degrees and do not represent a distinct and mutually exclusive subset. However, for convenience, we will set a threshold to indicate the presence of the new animals, as done in (YAGER; DUNSTONE, 2007).
The Figure 5 shows how the animals are defined in terms of the distribution of genuine scores and impostor scores. Marks Q1 and Q3 represent 25% of the values in the
distribution.
Let G the set of the genuine score average of all users: G = fik∈Pgk. Rank all users
k œ P by increasing value ofgk. Let GH µ P be the set of users in the 25% higher genuine
score range in G. Let GL µ P be the 25% of users with the lowest genuine score. Similarly,
let I =fik∈Pik, and IH µ P be the 25% of users with the highest impostor score, and
IL µ P the 25% of users with the lowest impostor score (YAGER; DUNSTONE, 2010).
3.2.1
Chameleons, Phantoms, Doves and Worms
Intuitively, chameleons are users who always seem to be similar to others. They have both high Gk andIk, and belong to the set GH fl IH. Therefore, they tend to receive
Chapter 3. The Biometric Menagerie 24
Figure 5 – The relationship between genuine score and impostor score, and the biometric menagerie.
Source: Yager e Dunstone (2010)
Phantoms belong to the set GLfl IL. They are exactly the opposite of chameleons,
then they tend to receive lower match score in any verification.
Doves are the best users of the system and belong to the setGH fl IL. They receive
high match score when compared with themselves and low match score when compared against other users. Typically, dove users have a quite unique biometric characteristics when compared to other users in the database.
Worms are the worst users of a biometric system. They belong to the setGLfl IH.
When they exist, they are responsible for a disproportionate number of system errors.
3.3
Evaluation Methods
Chapter 3. The Biometric Menagerie 25
definitions, in essence, simply state that the distributions of match scores depend on the user. Thus, the presence of animals in a biometric system is established without having to explicitly label users.
In order to show that the distributions of match scores are user dependent, we can perform the hypothesis test. The null hypothesis in (DODDINGTON et al., 1998), for the first four animals, is that there are no significant differences between the performances of the users, that is, given a fS{•|k, k}, for example, it does not depend on k. The relevant
distributions and their respective null hypotheses are:
a) Goats- the density of interest is fS{•|k, k} and the null hypothesis is that the
density does not depend on k.
b) Lambs - the density of interest isfS{•|j, k}and the null hypothesis is that the
density does not depend on k for every j ”=k.
c) Wolves - the density of interest is fS{•|j, k} and the null hypothesis is that
the density does not depend on j for every j ”=k.
Using F-Test and Kruskal-Wallis test, the author showed that the null hypothesis was rejected withα = 0,01 significance. However, due to the normality assumption, the F-Test is not intended for biometric data (YAGER; DUNSTONE, 2010). The Kruskal-Wallis test is a nonparametric method to test whether a set of samples come from the same distribution, i.e. to test for differences between independent distributions. Therefore, we can determine whether the different samples observed indeed suggest differences between the distributions or are only casual variations that may be expected from random samples from the same population. Moreover, Kruskal-Wallis test is similar to the simple analysis of variance (ANOVA), except that the scores are replaced by rank (DANIEL, 1989). Because it is nonparametric, the method of Kruskal-Wallis is best suited for biometrics and we use it to test the null hypothesis of the first four animals.
The Equation 3.1 can be used to calculate the Kruskal-Wallis test. In the equation,
N is the total number of samples, g is the size of the user population, n is the number of samples per user and ri is the score sum of user samples of positions i in the N ordered
values.
H = 12
N(N + 1) ◊
g
ÿ
i=1
r2
i
n ≠3(N + 1) (3.1)
The null hypothesis is rejected ifH Ø χ2
α:g−1. We can find χ 2
α:g−1 entering into a
Chi-squared table distribution the values g≠1 degrees of freedom and α significance level.
Chapter 3. The Biometric Menagerie 26
(as GH,GL,IH andIL represent 25% users each, the intersection of two of such sets is 25%
of 25%, or (1/4)2
). This is under the assumption that users inGH or GL and IH or IL are
independent.
The null hypothesis in Yager e Dunstone (2007), for the four new animals, is that statistics of genuine and impostor scores of a user are independent, so there is about 1/16 of the population of users in each animal group. Then a population of chameleons, for example, will be indicated by a high number of users with high genuine and impostor score combined (i.e. |GH fl IH| ∫1/16◊ |P|).
In order to demonstrate the existence of new animals, we can define that we are interested in the set of chameleons C (the analysis is the same for other animals). Where
c is the number of chameleons, c=|C|. The null hypothesis is that the probability of a particular individual to be chameleon is p= 1/16. Since each individual is independent, it is a binomial experiment with n= |P| attempts. The hypothesis is bilateral and not directional. Also, suppose that the number of chameleons observed is greater than the expected number. In order to test the null hypothesis, we calculated the probability of more than c chameleons. This probability can be calculated using the binomial distribution:
f(c;n, p) =
n
ÿ
i=c
A
n i
B
pi(1≠p)n−i (3.2)
For large values ofn, the binomial distribution can be approximated using a normal distribution with the expected value np(1≠p). Suppose the desired confidence level is α, then the null hypothesis is rejected if f(c;n, p)< α (YAGER; DUNSTONE, 2010).
For being bilateral, the null hypothesis allows a symmetrical argument if the number of users is less than expected. Thus, the null hypothesis is rejected in two ways: if there is a significantly low or high number of chameleons.
3.4
Conclusion
27
4 Experiments
This chapter will present the experimental works done. The chapter is organized as follow: Section 4.1 the experimental data is presented, while Section 4.2 describes how the experimental data was preprocessed. Section 4.3 presents, in detail, the experimental work done for the animals existence test, while Section 4.4 presents the experimental work for the animals analysis based on samples.
4.1
Experimental Data
In this work we have used the database CASIA-Fingerprint V5 containing 20,000 fingerprint images of 500 users (CASIA-FINGERPRINTV5, 2013). Each user contributed with 40 fingerprints of the eight fingers (excluding the little finger) with five prints for each finger. The eight fingers were named as the Table 2. Users in this database were instructed to rotate their fingers with various pressure levels in order to obtain a significant intraclass variation.
Table 2 – CASIA-FingerprintV5 fingers names
Right hand fingers Left hand fingers
R0 thumb L0 thumb
R1 index L1 index
R2 middle L2 middle
R3 ring L3 ring
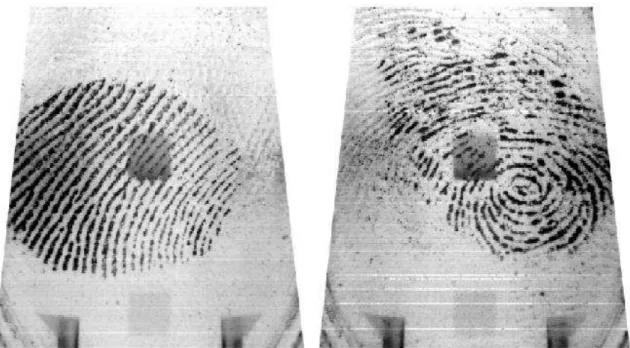
Where it was necessary to divide the five samples of each finger we have divided as follows: 3 for training and 2 for testing. Figure 6 shows two examples of fingerprint samples from different users in CASIA-FingerprintV5 base.
4.2
Pre-Processing
Chapter 4. Experiments 28
Figure 6 – Examples of fingerprints samples from the CASIA-FingerprintV5 database
Both prints have noise from the acquisition sensor. The left fingerprint is rotated about 90o
, while the right fingerprint is quite degraded.
4.3
Animals Existence Test
4.3.1
First Animals
In order to demonstrate the existence of the first four animals in CASIA Fin-gerprintV5 database, as already mentioned previously, we have used the Kruskal-Wallis method to test the null hypothesis with a traditional significance level of 0.05. In order to identify weak users who belong to these groups of animals, if they exist, we use the statistical framework based on the concept of percentiles of match scores, as proposed by DODDINGTON et al.. We get the p-th percentile of theN ordered values by calculating the rank as follows:
r= p
100 ◊N + 1
2 (4.1)
The percentile value for each animal group depends on the database and the application nature. However, the values used to finding goats, lambs and wolves were the same as specified in (DODDINGTON et al., 1998).
Chapter 4. Experiments 29
From the user’s fingerprints templates, we calculate, for each finger, the performance in each animal group.
a) Goats: We calculate the goats statistics as follows:
– for each user’s finger we compare each sample with all other of the same finger, storing the worst result.
– thus, as each user’s finger has 5 samples, are 5 results. It is from the distribu-tion of these results that we test the null hypothesis.
– we calculate the average of these 5 results to take the goat score (i.e. genuine score).
– lastly, we have a goat score for each finger of the 500 users.
– users whose finger goat score is below the 2.5 percentile are considered goats for that finger.
b) Lambs: To show the existence and identify the lambs the following tests were made:
– for each user’s finger, we compare all the samples of each other users with it samples and stores the best (highest) result. Note that each finger sample in test is attacked by all other samples from other users (between the fingers of the same type), so we have 5 results. We use these results to test the null hypothesis.
– we calculate the average of these 5 results to take the lamb score.
– lastly, we have a lamb score (or impostor score) for each finger of the 500 users.
– users whose finger lamb score is above the 97.5 percentile are considered lambs for that finger.
c) Wolves:The test for the wolves is symmetrical to the test for lambs, requiring only reverse the samples comparison:
– for each user’s finger, we compare each sample to all the samples of each other users (same finger type), storing the best result. We test the null hypothesis from these results.
– we average these results and obtain the wolf score.
– lastly, we have a wolf score (or impostor score) for each finger of the 500 users.
Chapter 4. Experiments 30
4.3.2
New Animals
As the definition of new animals is based on the relationship between genuine and impostor score, the existence test of the new animals comes from the values already calculated in the existence test for the first animals. Therefore, in this test there is also no division of templates for training and testing. The null hypothesis for the new animals is that the genuine score and the impostor score of each user is independent and therefore there is approximately 1/16 of the user population in each animal. That said, we use the concepts of rank and quartiles to calculate the amount of possible animals in each group, and the null hypothesis was tested using equation 3.2.
As an example, we can suppose we are interested in calculating the amount of chameleons. Chameleons are individuals who have both high genuine score and impostor score (GH fl IH). Figure 7 shows the distribution region where we find the possible
chameleons. The quartiles are calculated as follows: we ordered the genuine and impostor match score performances of users and calculate the 25th (mark Q
1) and 75th (mark Q3)
percentile of each performance. The chameleons are users in that both genuine score and impostor score are above the 75th percentile (mark Q
3).
Since the number of possible chameleons was calculated, we defined a confidence level α to the presence of the animal in the database. In this work, the confidence level was set atα = 0.05. The null hypothesis is rejected if f(c;n, p)< α, which, in this case, c
is the amount of possible chameleons, n the size of the user population and p the initial probability that a particular individual be a chameleon.
If, for example, the null hypothesis is rejected for chameleons – thus demonstrating the existence of the animal in the database with 0.05 of significance – users in that region will be considered chameleons.
4.4
Animals Analysis Based on Samples
The definition of animals proposed by DODDINGTON et al. and YAGER; DUN-STONE is exclusively based on the average of the user’s match scores. However, an analysis of the results of the comparisons made between user’s samples can exhibit behaviors not shown by the approach of the above authors. Moreover, biometric systems are quite sensitive to algorithm parameters. Factors such as sensor, environment, feature extraction algorithm, matching algorithm, etc., all can be adjusted to get a better system performance.
Chapter 4. Experiments 31
Figure 7 – The distribution region where we find possible chameleons.
4.4.1
Experiment
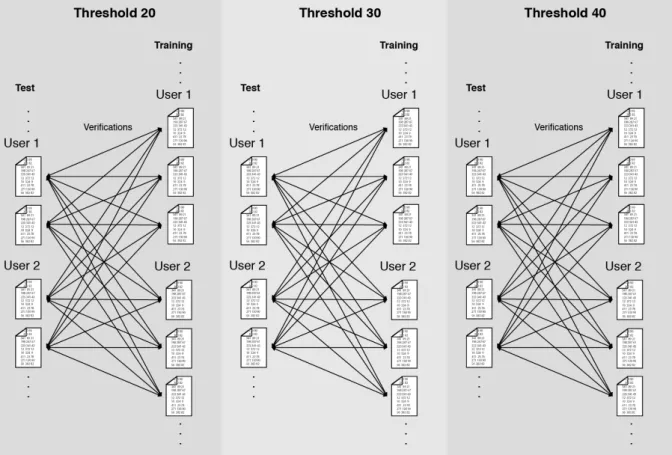
For this experiment we use only the right thumb finger (R0). From the test templates of each user, we do a verification with all training templates using three verification threshold values: 20, 30 and 40 (score ranging from 0 toŒ). Thus, since we have 2 templates of test and 3 templates of training for each finger, and we have 500 users, we do 2◊3◊500◊500 = 1.500.000 verifications for each threshold value. Figure 8 summarizes how the comparisons were made.
In order to reduce the number of results, only the comparisons with a value equal to or greater than the threshold were analyzed. Thus, a sample that does not have computed results simply means that it is considered sheep to this threshold value. Despite being recommended for the BOZORTH3 matcher the value threshold of 40 for commercial use (WATSON et al., 2007a), we have used, for convenience, the fixed threshold value set at
Chapter 4. Experiments 32
33
5 Results and Discussion
In this chapter we presents the results for the animals existence analysis experiment and the samples based analysis experiment.
5.1
Analysis of Animals Existence
Based on match scores distribution we analysed the presence of the animals in each one of the eight fingers for all users. The null hypothesis for goats, lambs and wolves is that the performance of match is approximately similar for all users, while for chameleons, phantoms, worms and doves is that the genuine and impostor scores does not depend on the user.
5.1.1
Goats
The Figure 9 shows the distribution of the mean worst genuine match scores with a confidence interval of 97.5%. As a high genuine score represents a better matching, any user with a goat statistic below the red line can be reasonably considered a goat, compared with the remaining users. However, the presence of goats is not clear. If there were no user dependency, as proposed by the null hypothesis, only one user out of forty would be below the red line.
The histogram of the distribution of the mean worst genuine match scores is shown in Figure 10. In black, the values corresponding to the users below percentile 2.5. It is apparent that the average of the worst genuine scores concentrates on lower values. In fact, about 40% of users have the average genuine match score below 20. While 27.7% users have the genuine match score above 40, recommended value for commercial use of BOZORTH3. Table 3 summarizes the percentage of users per verification threshold value and, through it, we can note that the L0 finger have both a lower number of users below 20 and a higher number of users above 40.
Table 3 – Percentage of users in the goat score distribution.
Right hand fingers Left hand fingers
R0 R1 R2 R3 L0 L1 L2 L3
users below 20 44% 42% 36% 43% 30% 36% 36% 45%
users above 40 24% 26% 29% 23% 39% 29% 31% 21%
Chapter 5. Results and Discussion 34
Figure 9 – Distribution of the mean worst genuine match scores
for all fingers. Therefore, the existence of goats in all eight fingers, at least for the used database, can be affirmed.
Figure 11 shows 3 examples of samples from each of the two individuals with the worst genuine scores (goat score). We can see that there is large intraclass variation between samples of each user; the samples, among them, are of different printing regions, and all have a lot of noise from what appears to be impressions marks of people who have used the acquisition sensor earlier.
5.1.2
Lambs and Wolves
The Figure 12 shows the distribution of impostor scores to lambs (left) and wolves (right) at a confidence level of 97.5%. As a lower impostor score represents a worse matching, users above the red line are considered, respectively, lambs and wolves in relation to other users. The histogram of the distribution of lamb scores and wolf scores can be seen in Figure 13 and Figure 14, respectively.
Chapter 5. Results and Discussion 35
Figure 10 – Histogram of the mean worst genuine match scores
We note that from the 13 users with the highest lamb scores, 12 are among the 13 highest wolf scores. This may be a reflection of the existing symmetry in the BOZORTH3 matching algorithm, meaning that the value of match score does not vary much when we change the direction of comparison of fingerprints. From the 13 users with the worst wolf scores, 2 users are also among the worst goat scores, showing that the relationship between wolves and goats, reported by Wittman, Davis e Flynn (2006), although less significant, also exists in this system.
Chapter 5. Results and Discussion 36
Figure 11 – Examples of Goats
(a) User 1
(b) User 2
Above: (a) three samples of the user with higher goat tendency. Below: (b) the user with the second higher goat tendency.
Figure 12 – Distribution of the mean higher impostor match scores
Chapter 5. Results and Discussion 37
Figure 13 – Histogram of the mean higher lamb scores
of minutiae, it is difficult to find from the images the common features between samples. However, the reasons why the samples are attacking may be several, from ghost images caused by latent fingerprints on the sensor, common features or even because the templates of the images registered in system are from part of the fingerprint.
5.1.3
Chameleons, Phantoms, Worms, and Doves
Chapter 5. Results and Discussion 38
Figure 14 – Histogram of the mean higher wolf scores
From results presented in Table 4 we can notice a significant presence, or absence, of each of new animals. The interpretation of such systems (containing or not each animal) is that, in some systems, the probability of a user being falsely rejected is not independent of the probability of being falsely accepted. These values show that there is a probability
<0.01% of the existence (or absence) of each of new animals are the result of chance.
Chapter 5. Results and Discussion 39
Figure 15 – Examples of Lambs and Wolves
(a) User 1
(b) User 2
Above: (a) three user samples with higher tendency to lamb and wolf. Below: (b) samples of the user with the second higher tendency.
biometric templates and that results in a low match score in almost all comparisons.
Chapter 5. Results and Discussion 40
Table 4 – Results and Probabilities for the Presence (or Absence) of New Animals
Right hand fingers Left hand fingers
R0 L0
worms doves chameleons phantoms worms doves chameleons phantoms
test absent absent present present absent absent present present probability <0.01% <0.01% <0.01% <0.01% <0.01% <0.01% <0.01% <0.01%
number of users 6 12 64 65 5 6 70 72
R1 L1
worms doves chameleons phantoms worms doves chameleons phantoms
test absent absent present present absent absent present present probability <0.01% <0.01% <0.01% <0.01% <0.01% <0.01% <0.01% <0.01%
number of users 4 8 62 64 10 12 56 60
R2 L2
worms doves chameleons phantoms worms doves chameleons phantoms
test absent absent present present absent absent present present probability <0.01% <0.01% <0.01% <0.01% <0.01% <0.01% <0.01% <0.01%
number of users 5 8 65 63 5 9 65 65
R3 L3
worms doves chameleons phantoms worms doves chameleons phantoms
test absent absent present present absent absent present present probability <0.01% <0.01% <0.01% <0.01% <0.01% <0.01% <0.01% <0.03%
number of users 5 6 62 67 10 6 62 52
In the animals absent case was applied a symmetrical argument to the existence test.
Figure 16 – Relationship between genuine and impostor match scores
Chapter 5. Results and Discussion 41
captures that are not eliminated, but are considered by the feature extraction algorithm; fraud in the fingerprint registration system; duplicate registrations, etc.
Finally, the Figure 17d displays samples from the user with the highest tendency to be a dove. The doves in this system have a high genuine score for the same reasons that the chameleons, i.e., good quality, well-defined structures and a large capture area. However, the analysis of the images of the users of this group, we can notice unusual features (e.g. well-defined fingerprint core with several minutiae; one or two deltas, etc.) in relation to other individuals of the base. This leads to both high genuine scores and low impostor scores.
Figure 17 – Examples of New Animals
(a) Worms (b) Phantoms
(c) Chameleons (d) Doves
Above: (a) two samples from the user with the highest worm tendency; (b) two samples from the user with the highest phantom tendency. Below, (c) two samples from the user with the highest chameleon tendency; and (d) two samples from the user with the highest dove tendency.
5.2
Analysis by Fingers
Chapter 5. Results and Discussion 42
In this experiment, we consider only users with average scores within the percentile 2.5. Therefore, we consider only those users who have a higher animal’s behavior trend. The distribution of the fingers considered to belong to the group of users who are more likely for each animal is shown in Figure 18, while Table 5 shows the percentage of occurrences per finger.
Initially, we note that the number of fingers belonging to the wolves and lambs are the same. This, once again, reflects the symmetry matching algorithm, even though there are 16% of users belong to only one set of these two animals.
The number of users who have only a finger belonging to one of the animals is represented by the majority. In this case, the mere use of a biometric authentication system utilizing more than one finger, can solve this specific problem.
Analyzing the goats samples, we note that approximately 10% of users have three or more fingers regarded as a goat, and only one user has five fingers considered goat.
Figure 18 – Number of fingers by user belonging to each animal.
5.3
Animals Analysis Based on Samples
Chapter 5. Results and Discussion 43
Table 5 – Percentage distribution of users by fingers occurrence for each animal.
1 finger 2 fgrs 3 fgrs 4 fgrs 5 fgrs Goat 69.01% 21.13% 5.63% 2.82% 1.41% Lamb 77.38% 21.43% 1.19% 0% 0%
Wolf 77.38% 21.43% 1.19% 0% 0%
and 40, respectively. The rows of each table are divided by the number of training samples which exceed the threshold value when compared with the same user test samples. Thus, the first column of the first row is the amount of test samples that, when compared with the same user training samples, did not exceed the threshold value in any comparison. The first column of the second row represents the quantity of test samples exceeding the threshold value in a comparison, and so on. The following columns show the number of attacks per number of test samples exceeding the threshold value. Therefore, the column value “4 atck.” and first line, of Table 6, means that, for 5 times, a test sample that did not exceed the threshold value when compared with training samples of the same user, suffered four attacks from other samples of other users.
Table 6 – CASIAV5 with threshold value 20.
hits 1 attack 2 atcks 3 atcks 4 atcks +5 atcks total
0 hits 103 10 2 1 5 8 +77
by 1 hit 100 8 9 7 2 32 +215
user 2 hits 189 21 16 11 10 68 +466
3 hits 608 56 34 38 22 356 +2.096
total 1000 95 122 171 156 +2.310
Table 7 – CASIAV5 with threshold value 30.
hits 1 attack 2 atcks 3 atcks 4 atcks +5 atcks total
0 hits 178 5 1 x x x 7
by 1 hit 152 12 2 x 1 x 20
user 2 hits 220 23 6 4 x 2 +57
3 hits 450 52 15 15 9 3 +178
total 1000 92 48 57 40 +25
Table 8 – CASIAV5 with threshold value 40.
hits 1 attack 2 atcks 3 atcks 4 atcks +5 atcks total
0 hits 272 x x x x x 0
by 1 hit 183 1 x x x x 1
user 2 hits 214 x x x x x 0
3 hits 331 2 x x x x 2
total 1000 3 0 0 0 0
Chapter 5. Results and Discussion 44
A significant number of samples with 0 hits may indicate the presence of goats in the system or at least demonstrate that a considerable portion of the samples registered is not good enough. Similarly, a significant number of samples with 3 hits is an indicative of the presence of sheeps in the system.
Figure 19 – Location of the indicative of animals
The Figure 19 shows which are an indicative of the presence of each animal in the tables. According to the figure, and with the results shown in Tables 6, 7 and 8, we notice that increasing the verification threshold value we decrease the amount of attacks and consequently, the false acceptance rate FAR. On the other hand, we also increase the number of verifications which have not reached the threshold value, which leads to an increase in false rejection rate FRR.
Figure 20 shows the behavior described in the preceding paragraph. In this figure, only the new animals are analyzed. The doves are represented by the test samples that had three hits and no attack; chameleons are the samples that had three hits and at least one attack; the phantoms that neither had hit and no attacks; and worms by the samples that had no hits and were attacked.
Chapter 5. Results and Discussion 45
Figure 20 – Number of samples per threshold
46
6 Final Remarks
A paper from this work was accepted into the XV Brazilian Symposium on Infor-mation Security and Computer System (SBSeg 2015) with the same title of this work.
In this study, we investigated the presence of the biometric menagerie in a fingerprint authentication biometric system. We showed the users fingers with the higher tendency to an animal and the reasons why this occurs, as well as how many fingers each user has in each animal group. We have analyzed how the presence of animals varies according to the value of the verification threshold. Also, we verified, based on fingerprint samples, the behavior of each animal with a fixed threshold value.
With a statistically significant evidence, we demonstrated the presence of goats, lambs and wolves in all eight fingers. The results showed that the presence of a high number of goats users may be because of a large intraclass variation between samples of each user. While for lambs and wolves, was not clear the reasons for a high number of users in theses animals. We observed a high symmetry between lambs and wolves, and indicated that this may be due to the matching algorithm.
The four new animals (worms, doves, chameleons and phantoms) also were identified with a statistically significant evidence. We showed that chameleons and phantoms are present, while worms and doves are significantly absent in all eight fingers. The presence or absence of the four new animals reflects the properties of the matching algorithm, the population of users, or a combination of both.
The reasons why a particular animal group exists are varied and complex. They depend on a number of factors, including the registration process, feature extraction and matching algorithm, quality of the fingerprint captured by the sensor and the intrinsic properties of the user population.
In our analysis by fingers, we showed that only a small number of users that belong to an animal have more than one finger belonging to that animal. Moreover, from those individuals who belongs to an animal, approximately 10% of users have three or more fingers regarded as a goat.
47
Bibliography
BOLLE, R.; PANKANTI, S. Biometrics: Personal Identification in Networked Society. Norwell, MA, USA: Kluwer Academic Publishers, 1998.
CASIA-FINGERPRINTV5. 2013. Disponível em: <http://biometrics.idealtest.org/>.
DANIEL, W. Applied Nonparametric Statistics. [S.l.]: Wadsworth Publishing Company, 1989.
DODDINGTON, G. et al. Sheep, goats, lambs and wolves a statistical analysis of speaker performance in the nist 1998 speaker recognition evaluation. In: ICSLP’98. [S.l.: s.n.], 1998.
GALTON, F. Fingerprints. [S.l.]: Macmillan, 1982.
NIST Speaker Recognition Workshop. NIST, 1997. Disponível em: <http://research. microsoft.com/apps/pubs/default.aspx?id=226754>.
HICKLIN, A.; WATSON, C.; ULERY, B. The Myth of Goats: How Many People Have Fingerprints That Are Hard to Match? [S.l.], 2005.
JAIN, A. et al. An identity-authentication system using fingerprints. Proceedings of the IEEE, v. 85, n. 9, p. 1365–1388, 1997.
JAIN, A.; ROSS, A.; PRABHAKAR, S. An introduction to biometric recognition.Circuits and Systems for Video Technology, IEEE Transactions on, v. 14, n. 1, p. 4–20, 2004.
JAIN, A. K.; FLYNN, P.; ROSS, A. A. Handbook of Biometrics. [S.l.]: Springer Science, 2008.
POH, N.; KITTLER, J. A methodology for separating sheep from goats for controlled enrollment and multimodal fusion. In: Biometrics Symposium, 2008. BSYM ’08. [S.l.: s.n.], 2008.
POH, N.; KITTLER, J. A biometric menagerie index for characterising template/model-specific variation. In: Advances in Biometrics. [S.l.]: Springer Berlin Heidelberg, 2009.
POH, N. et al. A user-specific and selective multimodal biometric fusion strategy by ranking subjects. Pattern Recognition, v. 46, n. 12, p. 3341 – 3357, 2013. ISSN 0031-3203. Disponível em: <http://www.sciencedirect.com/science/article/pii/S0031320313001477>.
RATTANI, A.; POH, N.; ROSS, A. Analysis of user-specific score characteristics for spoof biometric attacks. In: Computer Vision and Pattern Recognition Workshops (CVPRW), 2012 IEEE Computer Society Conference on. [S.l.: s.n.], 2012. p. 124–129. ISSN 2160-7508.
Bibliography 48
ROSS, A.; RATTANI, A.; TISTARELLI, M. Exploiting the doddington zoo effect in biometric fusion. In: Biometrics: Theory, Applications, and Systems, 2009. BTAS ’09. IEEE 3rd International Conference on. [S.l.: s.n.], 2009. p. 1–7.
UNE, M.; OTSUKA, A.; IMAI, H. Wolf attack probability: A theoretical security measure in biometric authentication systems. IEICE - Trans. Inf. Syst., 2008.
WANG, Z. et al. Transforming animals in a cyber-behavioral biometric menagerie with frog-boiling attacks. In: Biometrics: Theory, Applications and Systems (BTAS), 2012 IEEE Fifth International Conference on. [S.l.: s.n.], 2012. p. 289–296.
WATSON, C. I. et al. THE NBIS-EC SOFTWARE IS SUBJECT TO U.S. EXPORT CONTROL LAWS. User’s Guide to Export Controlled Distribution of NIST Biometric Image Software (NBIS-EC). 2007.
WATSON, C. I. et al. User’s Guide to NIST Biometric Image Software (NBIS). 2007.
WAYMAN, J. et al. (Ed.). Biometric Systems: Technology, Design and Performance Evaluation. [S.l.]: Springer, 2005.
WAYMAN, J. L. Multifinger penetration rate and roc variability for automatic fingerprint identification systems. In:Automatic Fingerprint Recognition Systems. [S.l.]: Springer New York, 2004.
WITTMAN, M.; DAVIS, P.; FLYNN, P. Empirical studies of the existence of the biometric menagerie in the frgc 2.0 color image corpus. In: Computer Vision and Pattern Recognition Workshop, 2006. CVPRW ’06. Conference on. [S.l.: s.n.], 2006.
YAGER, N.; DUNSTONE, T. Worms, chameleons, phantoms and doves: New additions to the biometric menagerie. In: Automatic Identification Advanced Technologies, 2007 IEEE Workshop on. [S.l.: s.n.], 2007.
YAGER, N.; DUNSTONE, T. Biometric System and Data Analysis: Design, Evaluation, and Data Mining. [S.l.]: Springer Publishing Company, Incorporated, 2009.