ACPD
8, 12163–12195, 2008Deep convective tracer transport
M. G. Lawrence and M. Salzmann
Title Page
Abstract Introduction
Conclusions References
Tables Figures
◭ ◮
◭ ◮
Back Close
Full Screen / Esc
Printer-friendly Version
Interactive Discussion Atmos. Chem. Phys. Discuss., 8, 12163–12195, 2008
www.atmos-chem-phys-discuss.net/8/12163/2008/ © Author(s) 2008. This work is distributed under the Creative Commons Attribution 3.0 License.
Atmospheric Chemistry and Physics Discussions
On interpreting studies of tracer transport
by deep cumulus convection and its
e
ff
ects on atmospheric chemistry
M. G. Lawrence1and M. Salzmann1,2
1
Max-Planck-Institut f ¨ur Chemie, Mainz, Germany
2
Atmospheric and Oceanic Sciences Program, Princeton University, Princeton, New Jersey, USA
Received: 7 May 2008 – Accepted: 21 May 2008 – Published: 19 June 2008
Correspondence to: M. G. Lawrence ([email protected])
Published by Copernicus Publications on behalf of the European Geosciences Union.
ACPD
8, 12163–12195, 2008Deep convective tracer transport
M. G. Lawrence and M. Salzmann
Title Page
Abstract Introduction
Conclusions References
Tables Figures
◭ ◮
◭ ◮
Back Close
Full Screen / Esc
Printer-friendly Version
Interactive Discussion
Abstract
Global chemistry-transport models (CTMs) and chemistry-GCMs (CGCMs) generally simulate vertical tracer transport by deep convection separately from the advective transport by the mean winds, even though a component of the mean transport, for in-stance in the Hadley and Walker cells, occurs in deep convective updrafts. This split
5
treatment of vertical transport has various implications for CTM simulations. In particu-lar, it has led to a misinterpretation of several sensitivity simulations in previous studies in which the parameterized convective transport of one or more tracers is neglected. We describe this issue in terms of simulated fluxes and fractions of these fluxes rep-resenting various physical and non-physical processes. We then show that there is
10
a significant overlap between the convective and large-scale mean advective vertical air mass fluxes in the CTM MATCH, and discuss the implications which this has for interpreting previous and future sensitivity simulations, as well as briefly noting other related implications such as numerical diffusion.
1 Introduction
15
Deep cumulus convection (“DCC”) has several important influences on atmospheric chemistry, such as: vertical transport of water and trace substances; scavenging of soluble gases and aerosols by precipitation; formation of cirrus anvils which influence radiative transfer and thus photolysis rates, and which provide surfaces for heteroge-neous chemical reactions; and generation of lightning, which produces nitric oxide.
20
DCC also affects atmospheric chemistry indirectly through latent heating and its con-tributions to solar and infrared radiation budgets, and in turn through its role in both synoptic and global scale circulations. Here we focus specifically on the direct effects of deep convection via vertical transport. DCC is an integral part of the overturning of air masses in the troposphere, with rapid updrafts transporting air masses and tracers
25
ACPD
8, 12163–12195, 2008Deep convective tracer transport
M. G. Lawrence and M. Salzmann
Title Page
Abstract Introduction
Conclusions References
Tables Figures
◭ ◮
◭ ◮
Back Close
Full Screen / Esc
Printer-friendly Version
Interactive Discussion free troposphere into the boundary layer. This has profound effects on the budgets of
trace gases and aerosols throughout the troposphere, particularly on those with life-times in the range of about a day to a couple weeks.
Many previous studies have examined various aspects of the effects of DCC on at-mospheric chemistry. One particular question which several of these studies have
ad-5
dressed is: “What is the effect specifically of transport due to DCC, including rapid up-drafts and downup-drafts, as well as associated large-scale subsidence, on ozone-related atmospheric chemistry?” One of the earliest studies addressing this from an observa-tions perspective wasDickerson et al.(1987), who found that the amounts of O3 and the O3-precursor CO were substantially enhanced in the outflow of a deep cumulus
10
cloud that they sampled, compared to the surrounding “background” troposphere. These observations of DCC transport have been followed by other similar observa-tions, and have also been augmented by modeling studies, using both cloud-resolving models as well as global models. The earliest cloud resolving model simulations (e.g.,
Pickering et al.,1990, 1992, 1993) showed that the upward transport of O3 and
es-15
pecially its precursors can result in substantial local increases in tropospheric O3 in the outflow of deep convection, as well as increasing the tropospheric O3column over polluted regions, since the lifetimes of these gases and the O3 production efficiency (e.g. per NOx molecule) both tend to increase with altitude.
On the other hand,Lelieveld and Crutzen (1994) pointed out that downward mixing
20
of O3-rich air from the upper troposphere (UT) towards the surface can reduce the col-umn mean lifetime of O3. They used a simple tropospheric chemistry-transport model (CTM), MOGUNTIA, to compute the overall effects of convective transport of ozone and its precursors. This was done by switching offthe transport of ozone and its pre-cursors by the convection parameterization, but keeping everything else in the model
25
the same, including the meteorology. Doing so, they found that the reduction in ozone above clean regions outweighed the effects of mixing above polluted regions, resulting in a net 20% decrease in tropospheric O3 in the simulation including parameterized DCC transport of the gases versus the simulation neglecting DCC transport.
ACPD
8, 12163–12195, 2008Deep convective tracer transport
M. G. Lawrence and M. Salzmann
Title Page
Abstract Introduction
Conclusions References
Tables Figures
◭ ◮
◭ ◮
Back Close
Full Screen / Esc
Printer-friendly Version
Interactive Discussion Thus far, the study of Lelieveld and Crutzen (1994) has been directly followed up
with two others using global models to examine the net effects of DCC on ozone, but with conflicting results. InLawrence et al. (2003b), we used a more complex CTM, MATCH-MPIC, and separated the effects into two components: the transport of ozone itself, and the transport of the precursors. Using the same approach as inLelieveld and 5
Crutzen (1994), we found a significant reduction of ozone due to its vertical overturning via DCC over clean regions, supporting the basic hypothesis ofLelieveld and Crutzen
(1994) that this effect can be of global importance. However, in contrast to Lelieveld
and Crutzen (1994), we found that the effect due to the vertical transport of ozone precursors by DCC outweighed the effect of the transport of O3itself, leading to a net
10
12% increase in tropospheric O3when we included parameterized DCC transport of all trace gases versus when we neglected it. In further simulations, we could determine that NOx (=NO+NO2) was the main precursor responsible for this. Continued interest in this topic has been aroused byDoherty et al.(2005), who repeated our simulations with a comparably complex, Lagrangian chemistry-GCM (STOCHEM-HadAM3), and
15
again found differing results. In their simulations, the convective overturning results in a 13% decrease in the global ozone burden, and the primary effect from the precur-sors is due to hydrocarbons like isoprene, in contrast to our results inLawrence et al.
(2003b). Simulations of this nature are now being considered for use within a multi-model comparison and process analysis in the IGAC/SPARC Atmospheric Chemistry
20
and Climate (AC&C) initiative.
A few other studies have also employed this methodology of switching off the pa-rameterized DCC transport of particular components for examining related issues. For instance,Collins et al.(1999) have examined the role of convection in determining the budget of odd hydrogen in the upper troposphere, and in Lawrence et al. (1999) we
25
param-ACPD
8, 12163–12195, 2008Deep convective tracer transport
M. G. Lawrence and M. Salzmann
Title Page
Abstract Introduction
Conclusions References
Tables Figures
◭ ◮
◭ ◮
Back Close
Full Screen / Esc
Printer-friendly Version
Interactive Discussion eterized transport. Furthermore, in a related study, Erukhimova and Bowman(2006)
have examined general global transport characteristics using 3-D trajectories including and neglecting the effects of the parameterized DCC transport in the NCAR/CCM3.
Nearly all of these global simulations have been interpreted as being representative of the net effects of DCC transport. For example, in our previous work (Lawrence et al.,
5
2003b), we indicated that “the net effect of convective transport of all trace gases (O3 and precursors together) is a 12% increase in the tropospheric O3 burden,” and we described the setup of the test runs as follows: “In the test runs we completely shut offthe convective transport of O3or of all trace gases so that comparing the results to the respective BASE run [with convective transport active for all gases] indicates the
10
net effect of each process.“Lelieveld and Crutzen(1994) stated similarly: “Simulations with a three-dimensional global model suggest that the net result of these counteractive processes is a 20 percent overall reduction in total tropospheric O3,” and “The role of deep cloud convection in the tropospheric O3 budget is clearly demonstrated if we omit the [parameterized] convective vertical exchange of trace gases from our model.”
15
Doherty et al. (2005) also state this in various ways, such as “convective mixing in our study reduces the O3 burden”, and Collins et al. (1999) state that “the effect of convection is to increase upper tropospheric (300–200 hPa) HOxglobally by over 50%”. Recently, however, we have come to realize that this is not a correct interpretation of these simulation results. The reason for this misinterpretation is discussed in
de-20
tail in the following sections. Historically, this has largely arisen due to the traditional split-operator design of advection and convection processes in CTMs and GCMs. A more correct interpretation of the simulations noted above is that they mainly show two effects: first, a specific component of the overall DCC mass fluxes is added when the convection parameterization is included, and second, the parameterization allows the
25
overall DCC transport to be represented as rapid, episodic vertical transport events, versus a more continuous mean transport. It is worth noting that some studies have indeed formulated their interpretation more along these lines; for instance,Mahowald
et al. (1997b) state that “in the upper troposphere concentrations of222Rn can change
ACPD
8, 12163–12195, 2008Deep convective tracer transport
M. G. Lawrence and M. Salzmann
Title Page
Abstract Introduction
Conclusions References
Tables Figures
◭ ◮
◭ ◮
Back Close
Full Screen / Esc
Printer-friendly Version
Interactive Discussion by 50% depending on whether a moist convection scheme is used”. However, in
sub-sequent discussions even of that study, as well as of the others mentioned above, the simulations are nevertheless often misinterpreted as quantifying the overall role of the DCC transport, not just components of the DCC transport which are added or modified due to including the parameterization. We hope this paper will raise awareness among
5
the atmospheric chemistry community of this feature of CTMs and the resulting implica-tions for trace gas and aerosol simulaimplica-tions, and will prevent misinterpretaimplica-tions of similar future simulations, for instance those planned in the framework of model intercompar-isons. In the following sections we describe the problem in terms of simulated mass fluxes, and consider the magnitude of the problem based on 3-D model fields. We then
10
discuss the implications for atmospheric chemistry sensitivity studies and alternate ap-proaches to examining the effects of deep convection, such as that developed byHess
(2005). We also briefly describe two additional related implications, numerical diff u-sion in Eulerian models, and the interpretation of Lagrangian trajectory studies, before concluding with a summary and outlook for future research on this topic.
15
2 Explanation: Treatment of deep cumulus convective and large-scale mean
mass fluxes
In all contemporary general circulation models (GCMs), numerical weather prediction (NWP) models and chemistry-transport models (CTMs) that we are aware of, the trans-port of tracers by deep cumulus convection and by advection are treated as split
oper-20
ators (one exception to this, which is currently under development and testing, is noted below in the conclusions). Each of these processes operates individually on the 3-D tracer fields during the model time step, though in some modeling frameworks the ten-dencies are summed and only integrated all together at the end of the time step. In either case, there is no explicit connection between the mass fluxes in the deep
con-25
ACPD
8, 12163–12195, 2008Deep convective tracer transport
M. G. Lawrence and M. Salzmann
Title Page
Abstract Introduction
Conclusions References
Tables Figures
◭ ◮
◭ ◮
Back Close
Full Screen / Esc
Printer-friendly Version
Interactive Discussion of the water vapor and temperature profiles.
Traditionally, it is assumed that DCC transport and large-scale advection are individ-ually mass conserving. For advection, this implies that any convergence into a grid cell (along one or two axes) must be exactly balanced by divergence from the grid cell (along the other one or two axes). The 3-D resolved mean wind fields used for
ad-5
vection will therefore contain a vertical component which is based on the convergence and divergence in the horizontal wind fields. This vertical mass flux can be physically interpreted as the mean regional upwelling or downwelling, due to a combination of various processes such as deep convection, and upwelling through shallower clouds and cloud-free air, averaged over the scale which is resolved by the model. For the
10
DCC parameterization, guaranteeing individual mass conservation has the implication that the transport of airmass is treated as a closed process in a single model column: any upward mass transport in convective updrafts is exactly balanced by the downward transport in convective downdrafts plus the between-cloud mass-balance subsidence in that column.
15
Mass conservation is an important requisite for any CTM or GCM. However, the in-dividual mass conservation in the advection and DCC components of these models results in an inconsistency in some regions, for instance the low-level, large-scale con-vergence region of the upward branch of the Hadley cell. As early asRiehl and Malkus
(1958) it was realized that the mean upward mass flux in the Hadley cell cannot be
20
entirely accounted for by slow, advection-like, mean upward transport, with mixing of air masses in the middle troposphere as they ascend, since this would not be able to produce the observed moist static energy profile with a minimum in the middle tropo-sphere. Instead, at least a substantial fraction, and probably most of the mean up-ward transport has to occur in deep convective updrafts (so-called “hot towers”), which
25
rapidly transport airmasses from the boundary layer to the upper troposphere without significant detrainment in the middle troposphere. Thus, only part of the upward trans-port that is contained in the 3-D resolved mean wind fields used in the advection al-gorithm actually represents large-scale upwelling processes, while the rest represents
ACPD
8, 12163–12195, 2008Deep convective tracer transport
M. G. Lawrence and M. Salzmann
Title Page
Abstract Introduction
Conclusions References
Tables Figures
◭ ◮
◭ ◮
Back Close
Full Screen / Esc
Printer-friendly Version
Interactive Discussion transport through deep cumulus clouds, the same transport that is also represented by
the DCC parameterization.
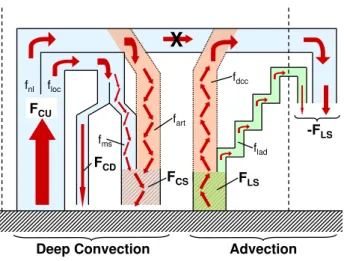
A schematic showing the basic relationship between these mean advective and deep convective vertical mass fluxes in a typical contemporary CTM or GCM is presented in Fig.1. The diagram represents any column in which the mean vertical velocity
through-5
out most of the column is upward, and in which the deep convection parameterization is active, e.g., a tropical model column in the upward branches of the Hadley and Walker cells. The diagram is intentionally simplified to focus only on the issue being discussed here. It does not show the mid-level entrainment and detrainment associated with the DCC fluxes, nor the contribution in the lower troposphere by shallow convection, which
10
has been posed byFolkins et al.(2008) as a “closed regional low-level circulation” in the tropics. These would modify the lower part of the diagram, but would not qualitatively modify the upper part or the overall connection of the mass fluxes to the large-scale mean circulation. The actual variation with height of these mass fluxes in the context of the fields used in a CTM will be discussed in the next section.
15
The diagram includes mass fluxes (Fx) and fractions of mass fluxes (fx) associated with various processes (x). Within the framework of a typical CTM or GCM, the four fluxes are known quantities computed by the DCC and advection algorithms. On the other hand, the six fractions are implicit in the algorithms, and are defined for conve-nience here to help relate various components of the fluxes to the other fluxes and to
20
real processes (e.g., the partial balancing of DCC updrafts by downdrafts and nearby mesoscale subsidence).
The mass fluxes are:
– FLS (LS=“large-scale”), the resolved mean upward mass flux (total upward minus total downward flux, by the combination of all contributing processes, averaged
25
over the scale of a model grid cell);
ACPD
8, 12163–12195, 2008Deep convective tracer transport
M. G. Lawrence and M. Salzmann
Title Page
Abstract Introduction
Conclusions References
Tables Figures
◭ ◮
◭ ◮
Back Close
Full Screen / Esc
Printer-friendly Version
Interactive Discussion
– FCD (CD=“convective downdraft”), the downward mass flux in rapid DCC down-drafts;
– FCS (CS=“convective subsidence”), the downward mass flux due to slower mass-balance subsidence in the cloud-free part of the column.
The fractional components of the mass fluxes depicted in Fig.1are:
5
– fnl (nl =“non-local”), the fraction ofFCU which in reality should be contributing to large-scale circulations, i.e., the component of lofted airmass which subsides far away from the updrafts;
– floc (loc=“local”), the fraction ofFCU which is balanced by the sum of convective
downdrafts and mesoscale subsidence in the immediate vicinity of the DCC (i.e.,
10
within the size range of a model grid cell);
– fms (ms = “mesoscale”), the fraction of FCS which actually occurs as local mesoscale subsidence in the vicinity of the deep convective updrafts;
– fart (art =“artificial”), the “artificial local subsidence”, i.e., the component of FCS
which is included in the parameterization in the same column as the convective
15
updrafts in order to balancefnl ·FCU, ensuring mass conservation;
– fdcc (dcc=“deep cumulus convection”), the fraction ofFLS which represents the
net resolved mean upwelling which is occurring through real deep cumulus con-vection (i.e., the mass flux in updrafts minus the balancing downward fluxes in downdrafts and mesoscale subsidence near the updrafts);
20
– flad (lad = “ladder”), the fraction ofFLS which represents the contribution to the
resolved mean upwelling which is not occurring through DCC, i.e., the component of the airmass which is transported from the surface to the upper troposphere by processes other than contiguous DCC updrafts, depicted here as a “ladder” of sequential upwelling through non-contiguous layers of shallow cumulus or stratus
25
clouds.
ACPD
8, 12163–12195, 2008Deep convective tracer transport
M. G. Lawrence and M. Salzmann
Title Page
Abstract Introduction
Conclusions References
Tables Figures
◭ ◮
◭ ◮
Back Close
Full Screen / Esc
Printer-friendly Version
Interactive Discussion It is important to note that though both FCU and FLS transport tracers to from the
BL to the UT, this transport is qualitatively different, withFCU occurring as an eposidic,
rapid, multi-layer transport, whileFLSis a slower, steady transport with complete mixing
in each model layer on the way up. A similar difference applies to downdrafts versus mass-balancing subsidence. This is depicted on the figure by the differences in the
5
form of the arrows through each pathway.
There are several equations relating these fields and providing insight into the inter-pretation of their physical meaning and their representation in a CTM or GCM. First, we have made the assumption here that
fdcc+flad=1 (1)
10
that is, that all of the airmasses being transported from the surface to the upper tropo-sphere go through clouds of some form, rather than being transported entirely in clear air. Though some airmasses might reach the upper troposphere without going through either deep cumulus convective clouds or a sequence (“ladder”) of lifting events in shal-lower clouds, we argue that this component of the total flux will be very small (and thus
15
neglected in this discussion), given that airmasses cross many isentropes between the surface and the upper troposphere, and that an air parcel would have to start with a relative humidity of RH<1% in order to be able to be lifted over 10 km without conden-sation occurring (under the typical range of tropospheric conditions).
An important relationship between the mass fluxes themselves is that the upward
20
DCC mass flux in any cell is balanced with the total downward mass flux in the DCC parameterization:
FCU =FCD+FCS (2)
This is necessary to guarantee mass conservation, and is checked for explicitly in some convective transport algorithms, e.g.,Lawrence and Rasch(2005).
25
ACPD
8, 12163–12195, 2008Deep convective tracer transport
M. G. Lawrence and M. Salzmann
Title Page
Abstract Introduction
Conclusions References
Tables Figures
◭ ◮
◭ ◮
Back Close
Full Screen / Esc
Printer-friendly Version
Interactive Discussion to large-scale circulations (fnl) supplies the fraction of the mass-balance subsidence
which occurs artificially due to the operator splitting (fart):
fnl ·FCU =fart·FCS (3)
Finally, the amount of DCC updraft mass flux which should leave the column and contribute to large-scale circulations (fnl) is also equal to the component of the re-5
solved mean mass flux which represents convective lofting (rather than the “ladder” processes):
fnl ·FCU =fdcc·FLS (4)
Two further simple equations to note are the relationships between the pairs of fractions that sum to one: fnl +floc=1 and fms +fart=1 (the third paired relationship,
10
fdcc+flad=1, was discussed above).
The figure makes it clear that there is a duplicate transport of air masses by the DCC parameterization and the advection algorithm: the fluxfdcc·FLS is the component of
the large-scale upwelling which is actually occurring through DCC clouds, and is also present in the DCC parameterization asfnl·FCU. One might think that this could lead to 15
a double-counting of the transport. This is avoided, however, by the additional, artificial fractionfartof the mass-balance subsidence flux,FCS, which is applied to each column in the convection parameterization. Since both the DCC and advection algorithms are individually mass-conserving, it is guaranteed that any vertical mass flux in the advec-tion algorithm which should actually be occurring in the DCC parameterizaadvec-tion will be
20
exactly balanced by the residual subsidence term in the DCC parameterization. Thus from the perspective of tracer transport in “normal” model runs, if the advective and DCC transport algorithms were to be perfectly shape preserving, then the additional upward and downward transport would exactly cancel within each model time step, and we would not expect any significant net consequences for the simulations. Since,
25
however, the transport algorithms are often not shape preserving, in contemporary models this can lead to numerical diffusion, which we discuss briefly in Sect. 4.
ACPD
8, 12163–12195, 2008Deep convective tracer transport
M. G. Lawrence and M. Salzmann
Title Page
Abstract Introduction
Conclusions References
Tables Figures
◭ ◮
◭ ◮
Back Close
Full Screen / Esc
Printer-friendly Version
Interactive Discussion Returning to the issue of the studies discussed in the introduction, in which the
pa-rameterized convective transport of various tracers was switched off, we can now re-consider their interpretation in light of Fig. 1. These sensitivity simulations can be seen as turning offall the fluxes on the left hand side of the schematic (labeled “Deep Convection”) for one or more tracers. The fluxes on the right hand side are still left
5
over. Thus, only a part of the overall deep cumulus convective transport has actually been shut offin the simulations, namelyfloc·FCU, the component of the DCC updrafts
and downdrafts which are associated with mesoscale subsidence in the vicinity of the cumulus towers. On the other hand, the component of DCC mass flux which is associ-ated with large-scale circulations and subsidence far away,fnl·FCU (=fdcc·FLS), will still 10
have been present in all of the simulations, though not in the convection parameteriza-tion, rather in the form of a slow mean upwelling in the advection algorithm, which is no longer balanced by the additional subsidence termfart·FCS. Thus, we can expect these
sensitivity simulations to likely underestimate the actual net effects of DCC transport in the models. A similar point was noted byHess (2005), specifically in reference to the
15
study ofMahowald et al.(1997b): “The method of Mahowald et al. (not shown) gives less convective impact for long-lived tracers. This is most likely due to the importance of non-convective pathways to the upper troposphere when convection is turned off. It is not clear that these pathways necessarily exist in nature.” In the next section we examine simulated mass fluxes to estimate the anticipated degree of significance of
20
the non-convective versus convective transport to the upper troposphere.
A final note worth making before proceeding to the next section is that parameteri-zations of the thermodynamic impacts of deep convection in GCMs and NWP models are designed to bypass the need to explicitly simulate this connection between the air-mass fluxes. This is done by instead computing the net diabatic effects of subgridscale
25
ACPD
8, 12163–12195, 2008Deep convective tracer transport
M. G. Lawrence and M. Salzmann
Title Page
Abstract Introduction
Conclusions References
Tables Figures
◭ ◮
◭ ◮
Back Close
Full Screen / Esc
Printer-friendly Version
Interactive Discussion (e.g., Arakawa,2004), it can have significant implications for tracers such as ozone,
aerosols, and their precursors, as discussed below.
3 Evidence of the significance: comparison of deep cumulus convective and
large-scale mean mass fluxes
3.1 The issues
5
The discussion in the previous section leaves three key questions to address in order to determine whether the misinterpretation of the sensitivity simulations noted above is significant, or only of academic interest:
1. How large is fnl? If it is small, then the leftover flux in the advection algorithm
when convective transport is turned offis also relatively small;
10
2. How large is fdcc? If this were to be small, then the convective contribution to upwelling would also be small compared to the slower, diffusive “ladder” contribu-tion;
3. Although the mean upwelling that is left over in the advection algorithm (fdcc·FLS)
is slow compared to the rapid convective updrafts, is it nevertheless rapid enough
15
to expect significant impacts on key trace gases or aerosols in these kinds of sensitivity simulations?
In order to answer these questions, we need to determine the fractionsfx based on the model output. Since these fractions are implicit, and not explicitly considered in the model algorithms, we need to make use of the relationships discussed above in light
20
of Fig. 1 to try to solve for the six unknowns: fnl, floc, fms, fart, fdcc, and flad. So far we have discussed six independent equations relating the fluxes and fractions, namely Eqs. (1–4), and the two further relationships between the pairs of fractions that sum to one (fnl +floc=1 andfms+fart=1). However, unfortunately, Eq. (2) is a simple identity
ACPD
8, 12163–12195, 2008Deep convective tracer transport
M. G. Lawrence and M. Salzmann
Title Page
Abstract Introduction
Conclusions References
Tables Figures
◭ ◮
◭ ◮
Back Close
Full Screen / Esc
Printer-friendly Version
Interactive Discussion between three known quantities, so that we really only have five equations left for six
unknowns, and we cannot determine the fractions exactly based only on output from a CTM or GCM and/or from NWP analyses.
Nevertheless, we can attempt to establish reasonable bounds on the relative magni-tudes of the various components of the mass fluxes. To do so, we can considerRiehl 5
and Malkus (1958) and the many studies that have since followed (e.g., Folkins et al.,
2008) which have asserted based on thermodynamic profile observations that slow, non-penetrative processes (e.g., advection and turbulent diffusion) cannot account for most of the vertical mixing, especially in the tropics. In other words,flad must be about 0.5 or less, and may be close to zero. This has two implications for our discussion.
10
First, for question 2 from above, we can thus assume that fdcc>flad (i.e., fdcc is not small). Second, we can also use this to establish bounds on the relative magnitudes of the fluxes: settingflad=0.0 provides an upper bound for the convective component of the flux, whileflad=0.5 will yield an approximate lower bound.
With this as a basis, we can then directly address questions 1 and 3. For question
15
1, if we takeflad=0.0, then we can diagnosefnl by solving Eqs. (1) and (4) to yield
fnl = FLS
FCU (5)
while ifflad ≤0.5, then
fnl ≥0.5 FLS FCU
(6)
Note that the first case becomes invalid to consider whereverFLS>FCU, since this would 20
imply thatfladmust be non-zero, or, if this occurs over a limited altitude range, that the large scale ascent may be occurring in clear air (in either case, this implies fdcc<1 and thus flad>0). As seen below, this becomes particularly relevant in the tropical tropopause layer, where the Brewer-Dobson circulation begins to take over in deter-mining the vertical transport. However, in the middle and lower troposphere this is a
ACPD
8, 12163–12195, 2008Deep convective tracer transport
M. G. Lawrence and M. Salzmann
Title Page
Abstract Introduction
Conclusions References
Tables Figures
◭ ◮
◭ ◮
Back Close
Full Screen / Esc
Printer-friendly Version
Interactive Discussion viable extreme case to consider for the sake of establishing upper and lower bounds
on the relationships between the fluxes and fractional components.
For question 3, we can examine eitherFLS or 0.5FLS (forflad=0.0 orflad=0.5, respec-tively) to determine the time-scale of vertical mixing that this would imply, and thus what kinds of tracers with comparable lifetimes would be expected to be strongly influenced
5
by this residual transport term.
3.2 Significance of the large-scale vertical transport compared to DCC mass fluxes
To examine the issues discussed in the previous section, we use the mass fluxes from a frequently-used CTM, MATCH (Model of Atmospheric Transport and Chemistry,Rasch
et al.,1997;Mahowald et al.,1997b,a;Lawrence et al.,1999). We focus particularly
10
on the tropics, where zonal mean convective mass fluxes are largest, and a connection exists between deep convective updrafts and the Hadley and Walker cells, especially for convection in the inter-tropical convergence zone (ITCZ).
MATCH is a “semi-offline” model which reads in basic meteorological driving data (surface pressure, geopotential height, temperature, horizontal winds, surface latent
15
and sensible heating rates, and zonal and meridional wind stresses), and uses these to diagnose advection, vertical diffusion, and deep convection, as well as simulating online the tropospheric hydrological cycle (water vapor transport, cloud condensate for-mation and precipitation). The driving data for this simulation are from the NCEP/GFS analysis (Environmental Modeling Center, 2003) for the year 2005. The basic
con-20
figuration used here is essentially the same as the MATCH-MPIC chemical weather forecasting and analysis system (Lawrence et al.,2003a), except that we do not com-pute the gas-phase photochemistry, and we employ a T62 resolution (about 1.9◦×1.9◦), rather than the T42 resolution which is currently used for our operational chemical weather forecasting runs.
25
For deep convection, MATCH employs two parameterizations: Zhang and
McFar-lane (1995) for deep convection rooted in the boundary layer (BL), and Hack (1994) for shallow moist BL convection plus multi-layer convection originating above the BL.
ACPD
8, 12163–12195, 2008Deep convective tracer transport
M. G. Lawrence and M. Salzmann
Title Page
Abstract Introduction
Conclusions References
Tables Figures
◭ ◮
◭ ◮
Back Close
Full Screen / Esc
Printer-friendly Version
Interactive Discussion These are called sequentially, following the procedure in the NCAR/CCM3 (Kiehl et al.,
1996). Since we are focusing on the effects of deep, penetrative convection, only the Zhang-McFarlane deep convective updraft mass fluxes are shown in the figures here; the mass fluxes from the Hack scheme are only significant below about 800 hPa, adding about 50% to the mass fluxes from the Zhang-McFarlane scheme, and a much
5
smaller contribution in the upper troposphere, but they do not change our basic conclu-sions. The pressure velocity (Ω) fields used to compute the vertical large-scale mass fluxes shown here are diagnosed internally in MATCH based on the divergence in the NCEP horizontal wind fields, with small corrections applied to the horizontal wind fields to guarantee mass-wind consistency (seevon Kuhlmann et al.(2003) for details).
10
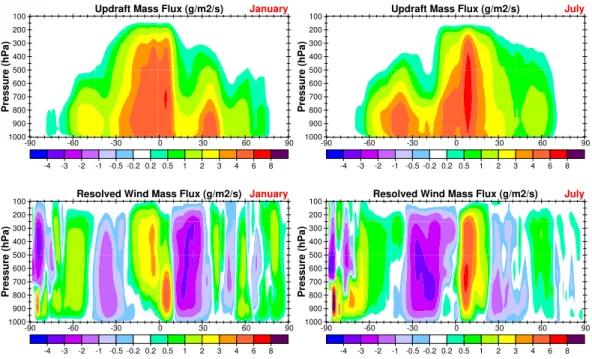
Figure 2 shows the zonal mean, monthly mean (January and July) profiles of the simulated convective updraft mass fluxes (FCU) and the large-scale mass fluxes (where FLS =ρw=−Ωg, whereρis the air density,wis the vertical velocity,gis the gravitation
constant, and hydrostatic equilibrium is assumed). The deep convective mass fluxes are greatest in the tropics, extending into the tropical UT, as well as in the summer
15
hemisphere mid-latitudes. The large-scale mass fluxes in Fig. 2 depict the Hadley circulation as a region of strong mean upwelling (positive values) on the summer hemi-sphere side of the equator and strong downwelling in the winter hemihemi-sphere subtropics (approximately 10–35◦N in January and 0–35◦S in July). Here we already see a strong correspondence between the location and magnitude of the tropical deep convective
20
updraft mass fluxes and the Hadley cell upwelling – that is, it is already apparent here that a substantial fraction of the DCC is feeding the Hadley cell (assuming, as dis-cussed above, thatflad≤0.5). It is worth noting here that the connection between the
large-scale mass fluxes and the deep convective mass fluxes is not explicit in MATCH, that is, the convection parameterization does not make direct use of the large-scale
25
vertical wind or large-scale convergence. Nevertheless, there is a strong implicit con-nection via the water vapor and temperature profiles, which can be seen in these model fields.
ACPD
8, 12163–12195, 2008Deep convective tracer transport
M. G. Lawrence and M. Salzmann
Title Page
Abstract Introduction
Conclusions References
Tables Figures
◭ ◮
◭ ◮
Back Close
Full Screen / Esc
Printer-friendly Version
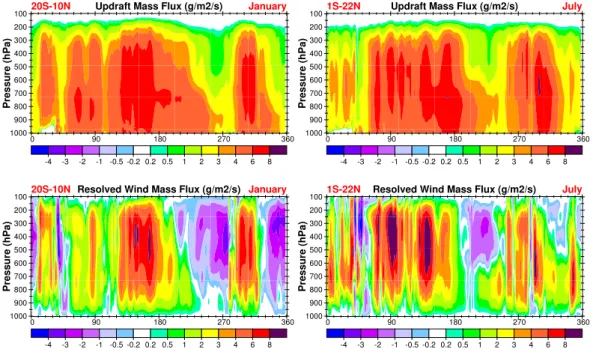
Interactive Discussion tropical circulation, with the upward branch mass fluxes occurring mostly through deep
convective updrafts. In Fig.3, we show the meridional mean convective updraft and large-scale mass fluxes, averaged over the regions of the upward branch of the Hadley cell. In the figures, the strongest Walker cell circulation, with upwelling over the western Pacific (about 120–180◦E) and subsidence over the eastern Pacific (about 180–90◦W
5
in January and 180–120◦W in July) can be seen in both seasons, and other, weaker Walker cells can also be seen. Again, as for the zonal mean, the regions of stronger and weaker mean DCC mass fluxes correspond well to the upwelling and downwelling regions, respectively, although there is not a one-to-one correspondence, since the fluxes are not explicitly coupled, as noted above. Here again, the magnitudes of the
10
DCC and large-scale mass fluxes are seen to be comparable, and in some cases in the upper troposphere the large-scale mass fluxes even exceed the DCC mass fluxes. To directly compare the magnitudes ofFCU andFLS for the model, we average over
the regions depicted in the panels in Fig.3 (i.e., the upward branches of the Hadley cells in each season). Figure4 shows the mean vertical profiles for these regions for
15
January and July. In this figure, the upward branch of the Hadley cell is represented by the large-scale vertical mass flux averaged over the region (red solid line), which must be balanced by subsidence outside the region, mostly in the downward branch of the Hadley cell. This flux becomes a substantial fraction of the parameterized convective mass flux (blue dashed line) above about 800 hPa. Considering this in light of Eqs. (5)
20
and (6), we can estimate a range of values for fnl for any level based on the Hadley
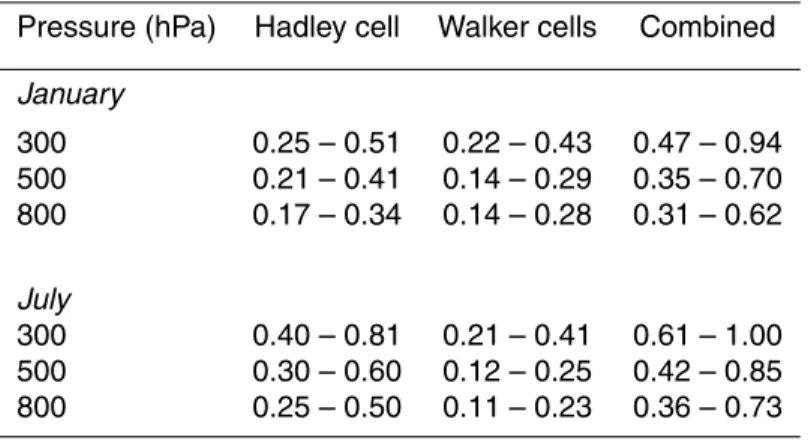
cell fluxes and the parameterized convective mass fluxes; the values for January and July at 800, 500, and 300 hPa are listed in the second column of Table1. We see from these that, depending on the season and the assumed value offlad, between about 20% and 80% of the parameterized deep convective mass fluxes should be feeding
25
into the Hadley cell. We have also examined output for individual timesteps. Although the relative magnitudes vary from day to day, our qualitative conclusions about the re-lationship between these fluxes still holds for all individual timesteps that we examined. In addition to the Hadley cell fluxes, the Walker cell fluxes can be estimated by
ACPD
8, 12163–12195, 2008Deep convective tracer transport
M. G. Lawrence and M. Salzmann
Title Page
Abstract Introduction
Conclusions References
Tables Figures
◭ ◮
◭ ◮
Back Close
Full Screen / Esc
Printer-friendly Version
Interactive Discussion rately averaging over the cells with positive and negative large-scale vertical velocities
(green dash-dot lines in Fig.4). While it is possible for convective updrafts to be present in columns in which large-scale subsidence is occurring, this is generally not the case (as seen in Figs.2and 3). Furthermore, using this approach to averaging, the fluxes will also include smaller-scale vertical motions which are not parts of the Walker cells.
5
When we examine output for individual timesteps (not shown), we find that this results in much larger values (generally by a factor of 2–3) for the green dash-dot lines. How-ever, using monthly mean values causes these to largely be averaged out, leaving the Walker cells as the main residual zonal circulation patterns.
The upward branches of the Walker cells are thus approximated by the difference
10
between the positive green dash-dot line and the red line in Fig. 4. These fluxes are also non-negligible relative to the regional mean parameterized DCC mass flux, es-pecially in the middle and upper troposphere, as seen in the third column of Table1. Interestingly, there is only a weak seasonality in the ratio of the Walker cell fluxes to the parameterized convective mass fluxes, with the values being nearly the same in
Jan-15
uary and July, while there is a stronger seasonality in the Hadley cell, with values about 1.5 times as large in July as in January (due to the greater influence of hemispheric asymmetry in land masses on the Hadley cell).
Finally, we can also apply Eqs. (5) and (6) to the sum of the Hadley and Walker cell fluxes (i.e., using the positive green dash-dot line forFLS), which yields the range of
20
values listed in the final column of Table 1. Note that a maximum value of fnl=1 is
assumed (i.e., as discussed above, ifFLS>FCU, thenfdccmust be less than one). From these values offnl, we conclude that on average in the tropics in MATCH, a significant
fraction (≥30%) of the mass-balance subsidence which occurs within the same column
as the updrafts in the convection parameterization is an artifact which should really be
25
ACPD
8, 12163–12195, 2008Deep convective tracer transport
M. G. Lawrence and M. Salzmann
Title Page
Abstract Introduction
Conclusions References
Tables Figures
◭ ◮
◭ ◮
Back Close
Full Screen / Esc
Printer-friendly Version
Interactive Discussion
4 Discussion
Based on the results in the previous section and the summary in Table1, it is evident that previous studies which have intended to examine the effects of deep convection on tracers by turning offthe parameterized convective transport are likely to have un-derestimated the actual net effect of DCC in the models, perhaps significantly for some
5
tracers. This is similar to what was noted byHess(2005) in comparing the results of his tagged tracer method to the results ofMahowald et al.(1997b), as discussed above. This may also help to explain some of the notable discrepancy between the results of some of the other studies, especially given the differences in convective mass fluxes which were shown by Doherty et al. (2005), and thus the possibility of also having
10
large relative differences between the residual transport fluxes left over in the advec-tion scheme in each model.
Beyond showing that the fractionfnl is significant (i.e.,≥30%, in answer to question 1
from above), it is also important to consider how rapid the residual transport will be, to determine whether it can be expected to have a significant impact on various trace
15
gases or aerosols (i.e., question 3 from above). The mass flux profiles averaged over the Hadley cell upwelling regions (Fig.4) indicate a mean large-scale upward mass flux in the middle troposphere in the range of 3–4 gm−2s−1(based on the green dash-dot lines). If we take a representative atmospheric density for this altitude range to be 0.7 kg m−3, this would imply a mean vertical velocity of the order of 0.5 cm/s, which
20
would transport tracers from the boundary layer to the upper troposphere on average in about 20 days (forflad=0). Iffladwere instead to be 0.5, then this would correspond to a roughly 40-day transport time-scale. On the other hand, in convectively active regions, the mean mass fluxes can be several times larger than the tropical mean, as seen in Figs.2and3, resulting in mean transport times of less than 10 days for these regions.
25
Furthermore, these are monthly mean values; during convectively active periods, the fluxes will be even larger, implying mean transport times of well below 10 days. This is rapid enough to expect it to impact most of the trace gases of interest, such as O3
ACPD
8, 12163–12195, 2008Deep convective tracer transport
M. G. Lawrence and M. Salzmann
Title Page
Abstract Introduction
Conclusions References
Tables Figures
◭ ◮
◭ ◮
Back Close
Full Screen / Esc
Printer-friendly Version
Interactive Discussion (with a lifetime of days to weeks), CO (lifetime of a few weeks to a few months), various
organic gases such as propane and butane (lifetimes of days to weeks), the reactive nitrogen (NOy) reservoir species like HNO3and PAN (lifetimes of a week to months in the free troposphere), and to an extent even NOx(=NO+NO2, with a lifetime of a day to several days). A moderate impact could also be expected if sensitivity simulations of
5
this nature were to be conducted with aerosols, with lifetimes of a few days to a week. What can be done to diagnose the impact of DCC transport on atmospheric tracers more accurately? Unfortunately, improving beyond the approach discussed above will probably be difficult to do in a consistent manner, since deep convection in regions of large-scale convergence such as the ITCZ represents an integral part of the
underly-10
ing atmospheric circulation (e.g. the Hadley cell). One possibility would be to still apply the convective mass-balance subsidence to all tracers in the sensitivity simulations, while neglecting the transport in updrafts and downdrafts. Although it would be pos-sible to do this and conserve tracer mass, the transport would not be monotonic (i.e., airmass, and thus tracer mass, would accumulate unrealistically in the lowest model
15
layers). Furthermore, attempting to restore monotonicity by modifying the horizontal wind field in order to remove air mass convergence associated with deep convection clearly defeats the purpose of such an exercise. As described above, this situation has historically arisen because the split operator treatment of deep convection and advec-tion led researchers to assume they could examine the net effects of DCC transport
20
by turning offthe parameterized mass fluxes for individual tracers. However, we con-tend that this problem would also apply to any future modeling system in which DCC and advection are coupled into one algorithm, since we do not see how it will be pos-sible to neglect the convective transport component, yet still capture the atmospheric circulation patterns, without resulting in a non-monotonic transport problem.
25
ACPD
8, 12163–12195, 2008Deep convective tracer transport
M. G. Lawrence and M. Salzmann
Title Page
Abstract Introduction
Conclusions References
Tables Figures
◭ ◮
◭ ◮
Back Close
Full Screen / Esc
Printer-friendly Version
Interactive Discussion byHess(2005) for artificial tracers, which are “tagged” upon going through convective
updrafts. However, this only applies to these very simple, carefully-designed tracers, and it will be difficult or impossible to apply to complex real gases like ozone.
Finally, thus far we have focused our discussion on the implications for the interpre-tation of several previous studies. There are also two other important related issues
5
which are worth briefly noting here.
First, the separate treatment of convective and advective mass fluxes can result in numerical diffusion, since, as noted above, the closed-column treatment of convective mass fluxes causes the upward motion of tracers in upwelling regions to be simulated by both the DCC parameterization and the advection scheme. A double counting is
10
avoided, as discussed above. However, since transport schemes are normally not perfectly shape-preserving (Rood, 1987), this up-and-down motion (or the separate computation of the upward and downward vertical tendencies) will generally result in numerical diffusion. In particular, transport by convective mass fluxes is usually repre-sented by a simple upwind differencing approach (e.g., Lawrence and Rasch,2005),
15
which tends to be highly numerically diffusive.
While it is qualitatively clear that this should have an effect on tracer simulations, we are not aware of any previous published attempts to estimate whether it is likely to be significant or negligible in the context of a global transport model. We are also not aware of any attempts to quantify the actual turbulent diffusion which may be induced
20
around convective clouds, which is normally not included explicitly in CTMs, and which may be either partly compensated or over-compensated by this numerical diffusion. A first attempt that we are aware of to explicitly couple DCC and advection in a CTM is being undertaken in the UCI model (building on the version described inWild and
Prather,2000). So far, a first working version of the model has been developed in which
25
the large-scale vertical velocity and convective subsidence are combined into a single vertical velocity for advection; systematic comparison to older versions of the model where large-scale and convective vertical velocities were separate have not yet been done, but will probably provide substantial further insight into these issues, especially
ACPD
8, 12163–12195, 2008Deep convective tracer transport
M. G. Lawrence and M. Salzmann
Title Page
Abstract Introduction
Conclusions References
Tables Figures
◭ ◮
◭ ◮
Back Close
Full Screen / Esc
Printer-friendly Version
Interactive Discussion in terms of numerical diffusion, in the near future (J. Neu, personal communication,
2008).
The closed-column treatment of convection also has a few implications for La-grangian trajectory models (e.g., LAGRANTO; Wernli and Davies, 1997) and La-grangian parcel (or “particle”) dispersion models (e.g., FLEXPART;Stohl et al.,1998)
5
which are driven with 4-D wind fields from weather center analyses or from climate models. While some of these Lagrangian models include an explicit representation of deep convective transport (e.g., Forster et al., 2007), many do not. Interestingly, for those models without deep convection parameterizations, it has been noted that in some cases they are nevertheless able to represent atmospheric transport patterns
10
well even in certain regions which are known to be characterized by extensive vertical transport within deep cumulus clouds, such as the Asian summer monsoon convection (Traub et al.,2003). This should not be interpreted as indicating that the upward trans-port in the trajectories is occurring due to large-scale upwelling in cloud-free regions, which is unrealistic on a widespread basis, as discussed above. Instead, this behavior
15
in Lagrangian models is due to the use of 4-D resolved mean wind fields from GCMs or NWP models, which currently all include the mean component of the convective lofting which is associated with large-scale circulations. However, although the basic regional lofting will be present in such simulations, it can be expected that the mean rate of vertical transport by the resolved winds alone will underestimate the actual
ver-20
tical transport flux which should be occurring through deep convection (compare the fluxes in Fig.4), and thus that parcel age spectra in the upper troposphere will tend to overestimate the ages of parcels with origins at the Earth’s surface. The slow, mean upwelling compared to episodic, rapid lifting in convective cells may further result in an underestimated variability in parcel age spectra, as well as errors in chemical
pro-25
ACPD
8, 12163–12195, 2008Deep convective tracer transport
M. G. Lawrence and M. Salzmann
Title Page
Abstract Introduction
Conclusions References
Tables Figures
◭ ◮
◭ ◮
Back Close
Full Screen / Esc
Printer-friendly Version
Interactive Discussion
5 Conclusions and outlook
In this study we have discussed previous studies of the effects of deep cumulus con-vection (DCC) on tracers and atmospheric chemistry. We have shown that in the chemistry-transport model MATCH, a significant fraction of the convective mass flux in the tropics is associated with the upward branches of the Hadley and Walker cells,
5
which is in contradiction with the common assumption of balanced updraft, downdraft and subsidence air mass fluxes in each column in contemporary convection parame-terizations. Thus, a substantial fraction of the local mass-balance subsidence in the deep convection parameterizations is actually an artifact, and should be occurring in model columns a few hundred to a few thousand km away. For sensitivity simulations
10
in which the parameterized DCC transport is turned offfor one or more tracers in order to assess its affects on atmospheric chemistry, this will result in an underestimate of the overall effects of convective transport, since a component of the convective trans-port, which is connected to the large scale mean circulations, will still be calculated by the advection scheme. Nevertheless, assessments such as those noted above are
15
not without value, they just need to be reinterpreted as characterizing model behav-ior, differences between convection parameterizations, and the net effects of only a component of the parameterized (rather than the actual net) DCC tracer transport.
We have not been able to formulate a generally applicable way around this problem. Techniques such as that developed byHess(2005) using carefully constructed artificial
20
tracers are very informative about the effects of deep convection on such tracers. How-ever, this only applies specifically to such tracers, and it is not clear how (or whether at all) such an analysis will be possible within the complex framework of the feedbacks involved in tropospheric chemistry. A further complication which applies to realistic at-mospheric chemistry simulations is that soluble tracers (e.g., HNO3and H2O2) can be
25
strongly scavenged, and that there can be differences between the effective scaveng-ing dependscaveng-ing on whether the tracers are transported rapidly and episodically versus slowly and more continually between the BL and UT. A detailed analysis of this issue
ACPD
8, 12163–12195, 2008Deep convective tracer transport
M. G. Lawrence and M. Salzmann
Title Page
Abstract Introduction
Conclusions References
Tables Figures
◭ ◮
◭ ◮
Back Close
Full Screen / Esc
Printer-friendly Version
Interactive Discussion goes beyond the scope of this discussion, but it should be considered as an integral
part of future analyses, especially multi-model intercomparisons of the effects of deep convection on atmospheric chemistry.
Although we have discussed this issue here as it pertains to large scale (global) models which employ DCC parameterizations, it is worth noting that a closely-related
5
issue also applies to limited-area (e.g., cloud system resolving) models without DCC parameterizations. This was pointed out inSalzmann et al.(2004), in which we showed that applying periodic boundary conditions in a cloud system resolving model results in an unrealistically strong clear-air subsidence in regions of mean upwelling, and that for more realistic multi-day tracer simulations it is necessary to apply both lateral
bound-10
ary conditions and large-scale vertical advection tendencies. Furthermore, evidence in support of the discussion in Sects. 2 and 3 is also available from such cloud sys-tem resolving models. Based on simulations (Salzmann et al.,2004) using data from the TOGA COARE campaign for the western Pacific Warm Pool, a region of strong net vertical ascent, we have found that downward transport takes place mainly in thin
15
filaments associated with downdrafts in mesoscale convective systems, while mass-balancing subsidence occurs mostly outside the domain.
Further analysis of the relationship between parameterized deep cumulus convection and large-scale circulations would best be done in the framework of a GCM, rather than a CTM, especially with a flexible framework for employing various convection
param-20
eterizations such as has been developed within the ECHAM5/MESSy model (J ¨ockel
et al., 2006; Tost et al., 2006). We intend to use this system with several deep con-vection parameterizations to gain a better sense of the relationship between DCC and large-scale circulations, as well as of the present uncertainty due to differences in con-vection parameterizations.
25
ACPD
8, 12163–12195, 2008Deep convective tracer transport
M. G. Lawrence and M. Salzmann
Title Page
Abstract Introduction
Conclusions References
Tables Figures
◭ ◮
◭ ◮
Back Close
Full Screen / Esc
Printer-friendly Version
Interactive Discussion IGAC/SPARC Atmospheric Chemistry and Climate (AC&C) initiative. If such analyses
of the tracer and atmospheric chemistry responses are accompanied by information on the convective and large scale mass flux components such as discussed here, substantial insight into differences in model behavior and the simulated relationships between DCC, large scale circulations and atmospheric chemistry responses stands
5
to be gained.
Acknowledgements. We would like to express our appreciation to Phil Rasch for his
develop-ment and support of MATCH and for thoughtful comdevelop-ments, as well as to several other col-leagues, including Jos Lelieveld, Holger Tost, Patrick J ¨ockel, Ian Folkins, Michael Prather, Leo Donner, Ruth Doherty, Jessica Neu, Jun-Ichi Yano, and Volkmar Wirth for valuable
discus-10
sions. This work was partly supported by funding from the German Ministry of Education and Research (BMBF), project 07-ATC-02, and partly from the German Research Society (DFG) “TROPEIS” project (subproject B4).
References
Arakawa, A.: The cumulus parameterization problem: past, present and future, J. Clim., 17,
15
2493–2525, 2004. 12175
Collins, W. J., Stevenson, D. S., Johnson, C. E., and Derwent, R. G.: Role of convection in determining the budget of odd hydrogen in the upper troposphere, J. Geophys. Res., 104, 26 927–26 941, 1999. 12166,12167
Dickerson, R. R., Huffman, G. J., Luke, W. T., Nunnermacker, L. J., Pickering, K. E., Leslie, A.
20
C. D., Lindsey, C. G., Slinn, W. G. N., Kelley, T. J., Daum, P. H., Delaney, A. C., Greenberg, J. P., Zimmerman, P. R., Boatman, J. F., Ray, J. D., and Stedman, D. H.: Thunderstorms: An important mechanism in the transport of air pollutants, Science, 235, 460–465, 1987.12165
Doherty, R. M., Stevenson, D. S., Collins, W. J., and Sanderson, M. G.: Influence of convective transport on tropospheric ozone and its precursors in a chemistry-climate model, Atmos.
25
Chem. Phys., 5, 3205–3218, 2005,http://www.atmos-chem-phys.net/5/3205/2005/. 12166,
12167,12181
Environmental Modeling Center: The GFS Atmospheric Model, NCEP Office Note 442, Global
ACPD
8, 12163–12195, 2008Deep convective tracer transport
M. G. Lawrence and M. Salzmann
Title Page
Abstract Introduction
Conclusions References
Tables Figures
◭ ◮
◭ ◮
Back Close
Full Screen / Esc
Printer-friendly Version
Interactive Discussion Climate and Weather Modelling Branch, National Centers for Environmental Prediction,
Camp Springs, Maryland, 2003.12177
Erukhimova, T. and Bowman, K. P.: Role of convection in global-scale transport in the tropo-sphere, J. Geophys. Res., 111, D03 105, doi:10.1029/2005JD006 006, 2006.12167
Folkins, I., Fueglistaler, S., Lesins, G., and Mitovski, T.: A Low-Level Circulation in the Tropics,
5
J. Atmos. Sci., 65, 1019–1034, 2008. 12170,12176
Forster, C., Stohl, A., and Seibert, P.: Parameterization of convective transport in a lagrangian particle dispersion model and its evaluation, J. Appl. Met. Clim., 46, 403–422, 2007.12184
Hack, J. J.: Parameterization of moist convection in the National Center for Atmospheric Re-search community climate model (CCM2), J. Geophys. Res., 99, 5551–5568, 1994. 12177 10
Hess, P. G.: A comparison of two paradigms: The relative global roles of moist convective ver-sus nonconvective transport, J. Geophys. Res., 110, D20302, doi:10.1029/2004JD005456, 2005. 12168,12174,12181,12183,12185
J ¨ockel, P., Tost, H., Pozzer, A., Br ¨uhl, C., Buchholz, J., Ganzeveld, L., Hoor, P., Kerk-weg, A., Lawrence, M. G., Sander, R., Steil, B., Stiller, G., Tanarhte, M., Taraborrelli, D.,
15
van Aardenne, J., and Lelieveld, J.: The atmospheric chemistry general circulation model ECHAM5/MESSy1: Consistent simulation of ozone from the surface to the mesosphere, Atmos. Chem. Phys., 6, 5067–5104, 2006, http://www.atmos-chem-phys.net/6/5067/2006/.
12186
Kiehl, J. T., Bonan, G. B., Boville, B. A., Briegleb, B. P., Williamson, D. L., and Rasch, P. J.:
20
Description of the NCAR Community Climate Model (CCM3), NCAR Tech. Note NCAR /TN-420+STAR, Nat. Cent. for Atmospheric Research, Boulder, CO, 1996. 12178
Lawrence, M. G. and Rasch, P. J.: Tracer transport in deep convective updrafts: plume ensem-ble versus bulk formulations, J. Atmos. Sci., 62, 2880–2894, 2005. 12172,12183
Lawrence, M. G., Crutzen, P. J., and Rasch, P. J.: Analysis of the CEPEX ozone data using a
25
3D chemistry-meteorology model, Q. J. R. Meteorol. Soc., 125, 2987–3009, 1999a. 12166
Lawrence, M. G., P. J. Crutzen, P. J. Rasch, B. E. Eaton and N. M. Mahowald: A model for studies of tropospheric photochemistry: Description, global distributions, and evaluation, J. Geophys. Res., 104, 26 245–26 277, 1999b. 12177
Lawrence, M. G., Rasch, P. J., von Kuhlmann, R., Williams, J., Fischer, H., de Reus, M.,
30
ACPD
8, 12163–12195, 2008Deep convective tracer transport
M. G. Lawrence and M. Salzmann
Title Page
Abstract Introduction
Conclusions References
Tables Figures
◭ ◮
◭ ◮
Back Close
Full Screen / Esc
Printer-friendly Version
Interactive Discussion CONTRACE, and INDOEX, Atmos. Chem. Phys., 3, 267–289, 2003a.12177
Lawrence, M. G., von Kuhlmann, R., Salzmann, M., and Rasch, P. J.: The balance of ef-fects of deep convective mixing on tropospheric ozone, Geophys. Res. Lett., 30, 1940, doi:10.1029/2003GL017644, 2003b. 12166,12167
Lelieveld, J. and Crutzen, P. J.: Role of deep cloud convection in the ozone budget of the
5
troposphere, Science, 264, 1759–1761, 1994.12165,12166,12167
Mahowald, N. M., Prinn, R., and Rasch, P. J.: Deducing CCl3F emissions using an inverse method and chemical transport models with assimilated winds, J. Geophys. Res., 102, 28 153–28 168, 1997a. 12177
Mahowald, N. M., Rasch, P. J., Eaton, B. E., Whittlestone, S., and Prinn, R. G.: Transport of
10 222
radon to the remote troposphere using the Model of Atmospheric Transport and Chem-istry and assimilated winds from ECMWF and the National Center for Environmental Pre-diction/NCAR, J. Geophys. Res., 102, 28 139–28 152, 1997b. 12166,12167,12174,12177,
12181
Pickering, K. E., Thompson, A. M., Dickerson, R. R., Luke, W. T., McNamara, D. P., Greenberg,
15
J. P., and Zimmerman, P. R.: Model Calculations of tropospheric ozone production potential following observed convective events, J. Geophys. Res., 95, 14 049–14 062, 1990. 12165
Pickering, K. E., Thompson, A. M., Scala, J. R., Tao, W., Dickerson, R. R., and Simpson, J.: Free tropospheric ozone production following entrainment of urban plumes into deep convection, J. Geophys. Res., 97, 17 985–18 000, 1992.12165
20
Pickering, K. E., Thompson, A. M., Tao, W., and Kucsera, T. L.: Upper tropospheric ozone production following mesoscale convection during STEP/EMEX, J. Geophys. Res., 98, 8737– 8749, 1993. 12165
Rasch, P. J., Mahowald, N. M., and Eaton, B. E.: Representations of transport, convection, and the hydrologic cycle in chemical transport models: Implications for the modeling of short
25
lived and soluble species, J. Geophys. Res., 102, 28 127–28 138, 1997. 12177
Riehl, H. and Malkus, J. S.: On the heat balance in the equitorial trough zone, Geophysica, 6, 503–538, 1958. 12169,12176
Rood, R. B.: Numerical Advection Algorithms and Their Role in Atmospheric Transport and Chemistry Models, Rev. Geophys., 25, 71–100, 1987. 12183
30
Salzmann, M., Lawrence, M. G., Phillips, V. T. J., and Donner, L. J.: Modelling tracer transport by a cumulus ensemble: lateral boundary conditions and large scale ascent, Atmos. Chem. Phys., 4, 1797–1811, 2004,http://www.atmos-chem-phys.net/4/1797/2004/. 12186
ACPD
8, 12163–12195, 2008Deep convective tracer transport
M. G. Lawrence and M. Salzmann
Title Page
Abstract Introduction
Conclusions References
Tables Figures
◭ ◮
◭ ◮
Back Close
Full Screen / Esc
Printer-friendly Version
Interactive Discussion Stohl, A., Hittenberger, M., and Wotawa, G.: Validation of the Lagrangian particle dispersion
model FLEXPART against large scale tracer experiment data, Atmos. Environ., 32, 4245– 4264, 1998. 12184
Tost, H., J ¨ockel, P., and Lelieveld, J.: Influence of different convection parameterisations in a GCM, Atmos. Chem. Phys., 6, 5475–5493, 2006,
5
http://www.atmos-chem-phys.net/6/5475/2006/. 12186
Traub, M., Fischer, H., de Reus, M., Kormann, R., Heland, J., Ziereis, H., Schlager, H., Holzinger, R., Williams, J., Warneke, C., de Gouw, J., and Lelieveld, J.: Chemical char-acteristics assigned to trajectory clusters during the MINOS campaign, Atmos. Chem. Phys., 3, 459–468, 2003,http://www.atmos-chem-phys.net/3/459/2003/. 12184
10
von Kuhlmann, R., Lawrence, M. G., Crutzen, P. J., and Rasch, P. J.: A model for studies of tropospheric ozone and non-methane hydrocarbons: Model description and ozone results, J. Geophys. Res., 108, 4294, doi:10.1029/2002JD002 893, 2003. 12178
Wernli, H. and Davies, H. C.: A Lagrangian-based analysis of extratropical cyclones. I: The method and some applications, Q. J. R. Meteorol. Soc., 123, 467–489, 1997. 12184 15
Wild, O. and Prather, M. J.: Excitation of the primary tropospheric chemical mode in a global three-dimensional model, J. Geophys. Res., 105, 24 647–24 660, 2000.12183
Yanai, M., Esbensen, S., and Chu, J.: Determination of bulk properties of tropical cloud clusters from large-scale heat and moisture budgets, J. Atmos. Sci., 30, 611–627, 1973.12174
Zhang, G. J. and McFarlane, N. A.: Sensitivity of Climate Simulations to the Parameterization
20
ACPD
8, 12163–12195, 2008Deep convective tracer transport
M. G. Lawrence and M. Salzmann
Title Page
Abstract Introduction
Conclusions References
Tables Figures
◭ ◮
◭ ◮
Back Close
Full Screen / Esc
Printer-friendly Version
Interactive Discussion Table 1. Ranges of values of fnl for three pressure levels, calculated based on Eqs. (5) and
(6) and the profiles depicted in Fig.4.
Pressure (hPa) Hadley cell Walker cells Combined
January
300 0.25 – 0.51 0.22 – 0.43 0.47 – 0.94
500 0.21 – 0.41 0.14 – 0.29 0.35 – 0.70
800 0.17 – 0.34 0.14 – 0.28 0.31 – 0.62
July
300 0.40 – 0.81 0.21 – 0.41 0.61 – 1.00
500 0.30 – 0.60 0.12 – 0.25 0.42 – 0.85
800 0.25 – 0.50 0.11 – 0.23 0.36 – 0.73
ACPD
8, 12163–12195, 2008Deep convective tracer transport
M. G. Lawrence and M. Salzmann
Title Page
Abstract Introduction
Conclusions References
Tables Figures
◭ ◮
◭ ◮
Back Close
Full Screen / Esc
Printer-friendly Version
Interactive Discussion fnl floc
FCD
FCS
fart
fms
FLS
fdcc
flad
-FLS
Deep Convection Advection
X
FCU