Adv. Sci. Res., 3, 45–51, 2009 www.adv-sci-res.net/3/45/2009/
©Author(s) 2009. This work is distributed under the Creative Commons Attribution 3.0 License.
Advances in
Science and
Research
EMS
Annual
Meeting
and
7th
Eur
opean
Confer
ence
on
Applied
Climatolo
gy
2008
Operational generation of AVHRR-based cloud products
for Europe and the Arctic at EUMETSAT’s Satellite
Application Facility on Climate Monitoring (CM-SAF)
F. Kaspar1, R. Hollmann1, M. Lockhoff1, K.-G. Karlsson2, A. Dybbroe2, P. Fuchs1, N. Selbach1, D. Stein1, and J. Schulz1
1
Satellite Application Facility on Climate Monitoring, Deutscher Wetterdienst, Offenbach, Germany 2
Swedish Meteorological and Hydrological Institute (SMHI), Norrk¨oping, Sweden
Received: 2 February 2009 – Revised: 26 March 2009 – Accepted: 29 March 2009 – Published: 15 April 2009
Abstract. The Satelite Application Facility on Climate Monitoring has implemented a new processing envi-ronment for AVHRR-based climate monitoring products. AVHRR measurements from NOAA-17, NOAA-18 and MetOp-A are utilized to generate daily and monthly means of several cloud parameters for Europe and the Inner Arctic: Cloud fraction, cloud types, cloud phase, cloud top height, cloud optical thickness and cloud liquid water path.
1 Introduction: climate monitoring with satellites
Satellite data provide information on the climate system that are not available or difficult to measure from the Earth’s sur-face like top of atmosphere radiation, cloud properties or hu-midity in the upper atmosphere. In particular over ocean and sparsely populated areas space-based observations are largely the only data source. Following this idea, EUMET-SAT’s Satellite Application Facility on Climate Monitoring (CM-SAF) is dedicated to the long-term monitoring of the climate system’s state and variability (Schulz et al., 2009). The EUMETSAT Satellite Application Facilities (SAF) are dedicated centres of excellence for processing satellite data, and form an integral part of the distributed EUMETSAT Ap-plication Ground Segment (http://www.eumetsat.int). CM-SAF is a consortium with contributions of several European meteorological services (FMI, KNMI, MeteoSwiss, RMI, SMHI) with Deutscher Wetterdienst (DWD, Germany) as the leading entity.
It supports the analysis and diagnosis of climate parame-ters in order to detect and understand changes in the climate system. For this purpose CM-SAF exploits several sensors on geostationary (SEVIRI and GERB instrument on-board Meteosat Second Generation) as well as polar-orbiting me-teorological satellites (AVHRR, ATOVS and SSM/I
instru-Correspondence to:F. Kaspar (frank.kaspar@dwd.de)
ments). CM-SAF provides data sets of several cloud param-eters, surface albedo, radiation fluxes at the top of the atmo-sphere and at the surface, atmospheric temperature and water vapour profiles as well as vertically integrated water vapour (total, layered integrated).
For recent years a product suite of these parameters is already available. Starting with January 2009, new prod-ucts for the Inner Arctic will be included into the product suite. These products are derived from measurements of the Advanced Very High Resolution Radiometer (AVHRR). In that context the processing environment for several other AVHRR-based products has also been significantly im-proved. Here we describe the new operational AVHRR pro-cessing scheme with focus on the new Arctic products.
2 The operational AVHRR processing chain
2.1 Overview
CM-SAF provides operational AVHRR-based products since January 2004. These were produced for the so-called CM-SAF baseline area, that includes Europe and parts of the North Atlantic (30◦
N to 80◦ N, 60◦
W to 60◦
E). Starting with beginning of 2009 a new processing chain for AVHRR measurements is set into operational status. Compared to the previous version this brings several significant improvements and new features:
– Processing is not based on locally received data any more, but utilizes data streams with a better spatial cov-erage. In case of MetOp-A the data stream provides full global coverage at full sensor resolution.
– The product suite is extended to cloud products and surface albedo for the Arctic (so-called CM-SAF Inner Arctic region, see Figs. 1 and 2).
– Processing is done on original satellite overpasses in-stead of remapping the input data. Intermediate prod-ucts are therefore available at original satellite projec-tion.
Large parts of this operational environment are based on the updated version of the “Polar Platform System Software” (version 2008) that was provided by the NWC-SAF (SAF on Support to Nowcasting and Very Short Range Forecasting; http://nwcsaf.inm.es). This package provides the algorithms for retrieval of the cloud mask, cloud type, cloud top height and cloud phase products. As the underlying algorithms are described elsewhere (e.g. Dybbroe et al., 2005a; Dybbroe et al., 2005b), we focus on the operational implementation at CM-SAF and the generation of CM-SAF’s climate monitor-ing products. Compared to NWC-SAF’s activities, CM-SAF focuses on calculation of daily and monthly means and long-term archiving. In this paper, we therefore focus on the oper-ational procedure for generation of these averaged products and the new Arctic products.
2.2 AVHRR input data
The Advanced Very High Resolution Radiometer (AVHRR) measures the reflectance of the Earth in 5 relatively wide spectral bands (sensing in the visible, near-infrared, and thermal infrared portions of the electromagnetic spectrum). Each pass of the satellite provides a swath width of 2048 pixels with a ground resolution of approximately 1.1 km at the satellite nadir (degrading to several kilometers at the swath edges). The sensor is on-board NOAA’s polar-orbiting satellites and EUMETSAT’s polar-orbiter MetOp-A. Each of these satellites orbits the Earth with a period of ap-prox. 101 min at a height of apap-prox. 830 km above its sur-face.
In the new processing environment, CM-SAF utilizes AVHRR data from MetOp-A, NOAA-17 and NOAA-18. MetOp-A data are received via the EUMETCast dissem-ination system that provides a continuous high-resolution global coverage. Data from NOAA-17 and NOAA-18 are obtained via the EUMETSAT Advanced Retransmission Ser-vice (EARS), which is based on a combination of data that are received by several ground reception stations. This re-sults in a Europe-wide coverage and also includes parts of the North Atlantic and Greenland.
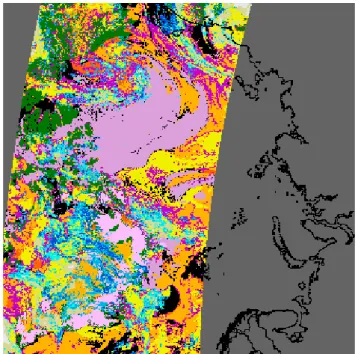
Figure 1. Cloud types as detected by NWCSAF’s PPS-software for one selected satellite scene: MetOp overpass from 16.07.2007, scene starting at 21:52 UTC. The figure shows the CM-SAF Inner Arctic region (square with a size of 5010 km×5010 km centered to
the pole with grid cells oriented parallel to the 0◦
and 90◦
meridians) at a spatial resolution of 15 km×15 km. The figure also illustrates
the swath-based processing. See Table 1 for a colour legend.
2.3 The NWC-SAF Polar Platform System Software
(PPS)
The new version (2008) of the PPS software operates on satellite swaths (as illustrated in Fig. 1). For each AVHRR pixel, the following products are derived:
– Cloud mask:The Cloud Mask scheme attempts to
de-lineate all absolutely cloud-free pixels with a high confi-dence. It is a thresholding algorithm, utilising all chan-nels of the AVHRR sensors, short range forecast data from numerical weather predictions (NWP) and aux-iliary data (1km digital elevation and land use). The scheme makes use of off-line radiative transfer simula-tions of cloud free atmospheres to estimate the optimal thresholds valid for the given scene.
as described for the Cloud Mask algorithm. The algo-rithm distinguishes different cloud types using thresh-olds defined by off-line radiative transfer calculations and a database of interactively collected training targets. Figure 1 shows an example of the PPS cloud type prod-ucts of one MetOp-A overpass mapped to the CM-SAF Inner Arctic region. The algorithm also distincts be-tween water and ice clouds which is used as the basis for CM-SAF’s cloud phase product.
– Cloud top: The algorithm takes the Cloud Type as in-put and utilises the 11 and 12 micrometer channels of the AVHRR sensor as well as NWP short range fore-cast data and the same auxiliary data as for the Cloud Mask. Radiative transfer calculations and NWP short range forecast output (vertical temperature and humid-ity profiles) are used to compensate for the atmospheric attenuation above the opaque clouds and for the semi-transparency correction. The cloud top product is pro-vided in three alternative versions: Cloud top tempera-ture (CTT) [K], cloud top height (CTH) [m] relative to the topography and cloud top pressure (CTP) [hPa].
2.4 Surface radiation components and cloud physical
pa-rameters
Additonal products are derived for the Baseline region: These are components of the surface radiation budget and cloud physical parameters (cloud optical thickness and cloud liquid water path). Retrieval of these parameters is based on the same algorithms as used in the previous operational en-vironment (Schulz et al., 2009), but are now also applied in a swath-based mode and additionally utilize data from MetOp-A. These products are not produced for the Arctic, except for surface albedo.
The retrieval of cloud physical properties is based on the principle that the reflectance of clouds at a non-absorbing wavelength in the visible region is strongly related to the op-tical thickness and has very little dependence on particle size, whereas the reflectance of clouds at an absorbing wavelength in the near-infrared region is primarily related to particle size (see Roebeling et al. (2006) for details).
2.5 Operational implementation of PPS
CM-SAF utilizes the NWC-SAF Polar Platform System Software (PPS) as described above on a day-to-day basis to process all AVHRR data that is available for the product re-gion via the EARS (NOAA-17 and NOAA-18) and the EU-METCast (MetOP-A) data dissemination systems.
The processing is done on full pixel resolution and all pa-rameters are retrieved for each pixel. These instantaneous intermediate results are the basis for the daily and monthly means of CM-SAF, which are calculated as described in the following section.
2.6 Product averaging
The final products are provided in equal area projections at a spatial resolution of 15 km×15 km for both product regions:
A sinusoidal projection is used for the Baseline region and a Lambert azimuthal equal-area projection is used for the Inner Arctic.
Calculation of these averaged fields is based on the follow-ing steps:
– Each individual pixel of the “instantaneous” product is first remapped from the original satellite view to a grid in the selected projection at high spatial resolution of 1 km2. With an AVHRR-resolution of approximately 1.1 km at nadir, this results in an almost completely filled destination grid close to the nadir line. Due to the coarser resolution of the sensor at the swath edges, the density of remapped pixel is coarser in these regions and not all pixels get a value in this step.
– A nearest neighbour search is used to fill the remaining empty pixels inside the swath.
– These remapped “instantaneous” data are then averaged to the final product area by averaging squares of 15×15
pixels (resulting in a spatial resolution of (15 km)2). In the same step all available instantaneous values for that day are averaged to the daily mean. The method for this averaging is product-dependent (see below). For non-continuous data as, e.g. cloud types, this step also includes a reclassification to aggregated categories. – Averaging of monthly products is based on the daily
val-ues in order to guarantee an equal weighting of each day.
The product-dependent averaging for the daily means is done as follows:
– Fractional cloud cover (CFC) [%]: The input to the
averaging routine is the cloud mask as generated by PPS. Pixels identified as either “cloud filled” or “cloud contaminated” are considered when the fractional cloud cover is calculated as the percentage of cloudy pixels (with full weight on both categories). Figure 2 shows an example of the CFC product.
– Cloud type (CTY) [%]: PPS detects 19 cloud types
(including four categories of cloud-free pixels). These are aggregated to five categories according to the list as shown in Table 1. The final product contains the fraction of each category in a region of 15×15 km2relative to all
cloudy pixels in the square. See Fig. 3 for an example.
– The Cloud top product gives three representations
Table 1.Cloud types categories as used by NWC-SAF and aggregation to CM-SAF cloud type product.
NWC-SAF cloud type category CM-SAF cloud type category Colour legend for (i.e. CM-SAF intermediate product) (i.e. daily and monthy means) Fig. 1
cloud free land cloud free green
cloud free sea cloud free black
land contaminated by snow cloud free light pink
sea contaminated by snow/ice cloud free pink
very low stratiform clouds (incl. fog) low clouds red
very low cumuliform clouds low clouds dark orange
low stratiform clouds low clouds orange
low cumuliform clouds low clouds light orange
medium level stratiform clouds middle level clouds yellow
medium level cumuliform clouds middle level clouds light yellow
high stratiform clouds high opaque dark beige
high cumuliform clouds high opaque light beige
very high stratiform clouds high opaque grey
very high cumuliform clouds high opaque white
high semi-transparent very thin cirrus high semitransparent dark blue
high semi-transparent thin cirrus high semitransparent blue
high semi-transparent thick cirrus high semitransparent light blue high semi-transparent cirrus above
low or medium level clouds high semitransparent light green
fractional clouds fractional clouds purple
Figure 2.Monthly mean cloud fraction in the Inner Arctic [%] for August 2007.
Figure 4.Monthly mean cloud top pressure [hPa] for August 2007.
and height are averaged linearly while cloud-top pres-sure is averaged logarithmically. The logarithmic av-eraging is motivated by the desire to keep consistency between the three different cloud top products. For ex-ample, linearly averaged geometrical cloud top height in meters does not correspond to the same geometrical height as the corresponding linearly averaged cloud top pressure. Since pressure decreases exponentially as a function of the geometrical height, logarithmic averag-ing will reduce these differences. Averages are calcu-lated using only pixels classified as cloudy. Figure 4 shows an example of the CTP product.
– Cloud phase (CPH) [%]:For each of the three classes (water/ice/mixed phase) the relative fraction of pixels within that class in each square of 15×15 km2is
calcu-lated. The fraction refers to cloudy pixels only, i.e. all three classes sum up to 100%.
– Cloud optical thickness (COT) [–]: The Cloud
Opti-cal Thickness product is defined as the vertiOpti-cally inte-grated optical thickness. The final daily average prod-uct is calculated by logarithmic averaging of the orig-inal algorithm output in one kilometer resolution over 15×15 km2sub-areas. Pixels where the retrieval failed
for any reason are excluded from averaging. Due to the logarithmic averaging only cloudy pixels are con-sidered.
The COT product requires availability of data from the visible channel and can therefore only be retrieved dur-ing daylight. In addition, the product cannot be pro-duced for NOAA-18 measurements, as channel 3a is discontinued on this satellite. The averaged product is therefore based on measurements of NOAA-17 and MetOp-A under daylight conditions.
– Cloud liquid water path (CWP) [kg/m2]: The CWP
is calculated as a function of the Cloud Optical Thick-ness and the estimated droplet effective radius. Con-sequently, for the same reasons as described for COT, the CWP product is only produced for measurements of NOAA-17 and MetOp-A under daylight conditions. Two versions of the mean are included into the product: One is calculated based on all available pixels and there-fore represents the daily mean liquid water path. How-ever, for some studies it is of interest to have a CWP product, that is consistent to the COT product. As COT is calculated for cloudy pixels only, a consistent CWP is calculated containing the average liquid water path of clouds only.
2.7 Monthly means
The monthly averages are calculated as average values of these daily values. They are not calculated as average of the instantaneous data in order to avoid giving different weights to days with different availability of satellite overpasses. Monthly means of CTP and COT are calculated logarithmi-cally, all other cloud products are averaged linearly.
2.8 Satellite-specific averages
Averages for the Baseline area and the Inner Arctic are based on all utilized polar-orbiting satellites (17, NOAA-18 and MetOp-A). For the Arctic an additional average is provided based on MetOp-A measurements only. Due to the different ways of dissemination of the input data, the Arctic area is not fully covered in case of the NOAA-based prod-ucts, but for MetOp-A. The average based on MetOp-A only has a comparable data density over the complete area. For some applications, e.g. validation of climate models, a prod-uct with such a better spatial homogeneity could be prefer-able.
3 Validation and monitoring of product quality
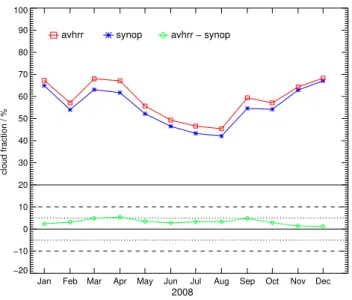
Jan Feb Mar Apr May Jun Jul Aug Sep Oct Nov Dec −20
−10 0 10 20 30 40 50 60 70 80 90 100
cloud fraction / %
2008 avhrr synop avhrr − synop
Figure 5. Annual cycle of cloud fraction in 2008. Values are aver-aged over all locations with synoptic observations within the central portion of the Baseline area that is covered by the locally received AVHRR data.
validation in this example is therefore limited to the cen-tral portion of the Baseline area. As the figure illustrates, there is generally good agreement and the product is within the required accuracy of 5%. The product is also in good agreement compared to MODIS-derived cloud fraction and the overall difference between both products is within 1% except for the winter months where CM-SAF cloud cover-age is about 5% lower. The validation for 2008 also showed that the required accuracy is met for the cloud type, cloud phase and cloud top products. The cloud optical thickness and cloud liquid water paths products show an underestima-tion of around 30% with respect to MODIS. See CM-SAF (2009a) for details.
First comparisons have also been done for the new Arctic products. They have also shown that the monthly mean cloud cover products of polar summer 2007 are capable of repro-ducing similar results as those based on the MODIS instru-ment. Validation against ground-based measurements also shows that the Arctic CFC product is within the required ac-curacy. More details can be found in CM-SAF (2009b).
4 Product availability, data formats and processing tools
CM-SAF products can be ordered free-of-charge at www.cmsaf.eu. AVHRR-based cloud products have been generated by CM-SAF for the Baseline Area since 1 Jan-uary 2004, but were generated with a different processing environment and based on different input data until 31 De-cember 2008.
CM-SAF’s climate monitoring products are provided as HDF5 (Hierarchical Data Format, release 5). Reasons for se-lecting HDF5 were its high compression efficiency and the features to include several data models and self-describing datasets. Many users are interested to receive the data in dif-ferent formats or projections. CM-SAF has therefore sup-ported the integration of its data formats into the “climate data operators”. The “climate data operators” (CDO) are a collection of command line operators that were originally de-veloped for processing and analysis of data produced by a variety of climate and numerical weather prediction models (e.g. for file operations, simple statistics, arithmetics, inter-polation or the calculation of climate indices). Supported file formats are NetCDF, GRIB and several binary formats. Be-sides the pure conversion of CM-SAF HDF5-files to other formats, the package also offers opportunities for interpola-tion to other grid types, selecinterpola-tion of regions, etc. The pack-age was developed at the Max-Planck-Institute for Meteorol-ogy (Hamburg, www.mpimet.mpg.de/cdo) and is a widely-used tool within the climate modelling community.
5 Conclusions
CM-SAF provides AVHRR-based climate monitoring prod-ucts for several cloud parameters. The product suite has been extended to the Inner Arctic.
One potential application of these datasets is the monitor-ing of processes that could be responsible for changes in the Arctic sea ice. Kay et al. (2008) discussed whether the low cloud amounts in summer 2007 could be a contributing fac-tor to the unprecedented rapid melting of sea ice during the polar summer of 2007. The new CM-SAF products for the Arctic offer additional opportunities for such analyses and continuous monitoring of such processes.
Another application is the validation of regional climate simulations. Satellite-derived datasets have the strong ad-vantage of consistent measurements and processing method-ologies across regions.
CM-SAF currently prepares the reprocessing of historic AVHRR data from 1982 until present.
Acknowledgements. The work presented in this paper has been funded by EUMETSAT in the context of the Climate Monitoring (CM-SAF) part of the Satellite Application Facilities Network. Two anonymous reviewers gave helpful comments.
Edited by: S. Szalai
References
CM-SAF: Annual Validation Report 2009, Satellite Application Facility on Climate Monitoring, available at: www.cmsaf.eu, 2009a.
CM-SAF: Validation of CM-SAF cloud products derived from AVHRR data in the Arctic region, Satellite Application Facility on Climate Monitoring, available at: www.cmsaf.eu, 2009b. Dybbroe, A., Karlsson, K.-G., and Thoss, A.: NWCSAF AVHRR
Cloud Detection and Analysis Using Dynamic Thresholds and Radiative Transfer Modeling. Part I: Algorithm Description, J. Appl. Meteorol., 44(1) 39–54, doi:10.1175/JAM-2188.1, 2005a. Dybbroe, A., Karlsson, K.-G., and Thoss, A.: NWCSAF AVHRR Cloud Detection and Analysis Using Dynamic Thresholds and Radiative Transfer Modeling. Part II: Tuning and Validation, J. Appl. Meteorol., 44(1) 55–71, doi:10.1175/JAM-2189.1, 2005b. Kay, J. E., L’Ecuyer, T., Gettelman, A., Stephens, G., and C. O’Dell: The contribution of cloud and radiation anomalies to the 2007 Arctic sea ice extent minimum, Geophys. Res. Lett., 35, L08503, doi:10.1029/2008GL033451, 2008.
Roebeling, R. A., Feijt, A. J., and Stammes, P.: Cloud property retrievals for climate monitoring: Implications of differences between Spinning Enhanced Visible and Infrared Imager (SE-VIRI) on METEOSAT-8 and Advanced Very High Resolution Radiometer (AVHRR) on NOAA-17, J. Geophys. Res., 111, D20210, doi:10.1029/2005JD006990, 2006.
Schulz, J., Albert, P., Behr, H.-D., Caprion, D., Deneke, H., De-witte, S., D¨urr, B., Fuchs, P., Gratzki, A., Hechler, P., Hollmann, R., Johnston, S., Karlsson, K.-G., Manninen, T., M¨uller, R., Reuter, M., Riihel¨a, A., Roebeling, R., Selbach, N., Tetzlaff, A., Thomas, W., Werscheck, M., Wolters, E., and Zelenka, A.: Oper-ational climate monitoring from space: the EUMETSAT Satellite Application Facility on Climate Monitoring (CM-SAF), Atmos. Chem. Phys., 9, 1687–1709, 2009,
![Figure 2. Monthly mean cloud fraction in the Inner Arctic [%] for August 2007.](https://thumb-eu.123doks.com/thumbv2/123dok_br/17170370.241240/4.905.477.833.653.924/figure-monthly-mean-cloud-fraction-inner-arctic-august.webp)
![Figure 4. Monthly mean cloud top pressure [hPa] for August 2007.](https://thumb-eu.123doks.com/thumbv2/123dok_br/17170370.241240/5.905.75.429.103.372/figure-monthly-mean-cloud-pressure-hpa-august.webp)