Article
A1c Variability Can Predict Coronary Artery Disease in
Patients with Type 2 Diabetes with Mean A1c Levels
Greater than 7
Eun Ju Lee1, You Jeong Kim1, Tae Nyun Kim1, Tae Ik Kim2, Won Kee Lee3, Mi-Kyung Kim1,4, Jeong Hyun Park1,4,
Byoung Doo Rhee1
1Department of Internal Medicine, Inje University College of Medicine; 2Division of Cardiology, Department of Internal
Medicine, Maryknoll Medical Center, Busan; 3
Division of Biostatistics, Kyungpook National University School of Medicine, Daegu; 4
Paik Inje Memorial Institute for Clinical Medicine Research, Inje University College of Medicine, Busan, Korea
Background: Recent studies suggested that the association of acute glucose variability and diabetic complications was not con-sistent, and that A1c variability representing long term glucose fluctuation may be related to coronary atherosclerosis in patients with type 1 diabetes. In this study, we attempt to determine whether or not A1c variability can predict coronary artery disease (CAD) in patients with type 2 diabetes.
Methods: We reviewed data of patients with type 2 diabetes who had undergone coronary angiography (CAG) and had been fol-lowed up with for 5 years. The intrapersonal standard deviation (SD) of serially-measured A1c levels adjusted by the different number of assessments among patients (adj-A1c-SD) was considered to be a measure of the variability of A1c.
Results: Among the 269 patients, 121 of them had type 2 diabetes with CAD. In patients with A1c ≥7%, the mean A1c levels and A1c levels at the time of CAG among the three groups were significantly different. The ratio of patients with CAD was the highest in the high adj-A1c-SD group and the lowest in the low adj-A1c-SD group (P=0.017). In multiple regression analysis,
adj-A1c-SD was an independent predictor for CAD in subjects with A1c ≥7% (odds ratio, 2.140; P=0.036).
Conclusion: Patients with higher A1c variability for several years showed higher mean A1c levels. A1c variability can be an in-dependent predictor for CAD as seen in angiographs of patients with type 2 diabetes with mean A1c levels over 7%.
Keywords: A1c variability; Coronary artery disease; Diabetes mellitus, type 2
INTRODUCTION
It is well known that type 2 diabetes has an association between the degree of hyperglycemia and increased risk of microvas-cular complications, myocardial infarction, and macrovasmicrovas-cular mortality through previously well-designed prospective
stud-ies [1-6]. Although many studstud-ies have investigated and com-pared the roles of the multiple risk factors involved in diabetic vascular complications, an accurate assessment of their respec-tive contributions remains difficult [7-9]. However, as demon-strated by many trials, microvascular and macrovascular com-plications are mainly or partly [1,5,10] dependent on
dysglyce-Received: 15 March 2013, Accepted: 7 May 2013
Corresponding author: Mi-Kyung Kim
Department of Internal Medicine, Inje University Haeundae Paik Hospital, Inje University College of Medicine, 875 Haeun-daero, Haeundae-gu, Busan 612-862, Korea
Tel: +82-51-797-0636, Fax: +82-51-797-2070, E-mail: [email protected]
Copyright © 2013 Korean Endocrine Society
mia. Recently, it was suggested that hemoglobin A1c (HbA1c) is not the only component of dysglycemia as a risk factor for diabetic complications [11]. Dysglycemia may be composed of fasting glucose levels, postprandial glucose levels, mean glucose levels, and glucose variability.
In terms of glucose variability, patients may show various de-grees of glycemic excursions even when they have identical A1c values [12]. More harmful effects of variable glucose con-centrations than stable high glucose was observed on high-glu-cose-induced reactive oxygen species (ROS) generation and cellular apoptosis in several in vitro studies [13-15]. We also
re-ported the effect of intermittent high glucose on pancreatic beta cell apoptosis [16]. Those studies have suggested that glycemic variability may play a role in the pathogenesis of atherosclerosis and may be an independent risk factor for diabetic complica-tions. However, there have been no sufficient studies presented so far that specifically evaluated the relationship between glyce-mic variability, atherosclerosis, and complications in diabetic patients, especially for cardiovascular complications. One recent study showed that glucose variability for 72 hours measured by a continuous glucose monitoring system was associated with coronary atherosclerosis in patients with type 2 diabetes [17]. Most of the previous studies reported that the relationships between glucose variability and oxidative stress or diabetic complications dealt acute glucose fluctuation for several days. However, atherosclerosis is a long term processed condition, which may occur from very young age and progress through a person’s lifetime [18]. In the Diabetes Control and Complica-tions Trial (DCCT), variation in the 7-point laboratory-mea-sured glucose profiles for several days did not predict diabetic complications [19]. Other recent reports showed that variations in long-term glycemia, defined as A1c variability, were power-ful independent predictors for diabetic microvascular compli-cations and even for cardiovascular disease (CVD) events in patients with type 1 diabetes [12,20]. Therefore, we analyzed the effect of long term A1C variability for the prediction of coronary atherosclerosis in patients with type 2 diabetes.
METHODS
Study subjects and biochemical measurement
The inclusion criteria for this study was patients with type 2 diabetes who had undergone coronary angiography (CAG) due to chest pain and had been followed up in our institute for at least 5 years prior to the CAG. We selected patients who had HbA1c measurements at least five times during the follow-up
period. Their systolic blood pressure (SBP) and diastolic pres-sures (DBP) were checked at every clinic visit. Fasting blood tests were performed on the patients including routine com-plete blood count, liver function test, kidney function, and lip-id profile at least once a year based on the institute’s own fol-low-up plan. We excluded subjects with a previous history of stroke and peripheral vascular disease.
Serial A1c measurements
HbA1c at CAG is serum HbA1c levels measured at the time CAG was performed. During a mean follow-up of 5.9 years, the mean number of A1C measurements per patient was 10 (range, 5 to 18), and there were on average 2.1 measurements per patient per year. For each patient, the intrapersonal mean and standard deviations (SDs) of all the recorded A1c mea-surements were calculated. The intrapersonal SD of the serial-ly-measured A1c levels adjusted by the different number of assessments among patients (adj-A1c-SD=SD/√[n/(n−1)])
was considered a measure of variability of A1c.
CAG
Coronary artery angiography was performed using standard Judkins techniques or a radial approach. During cardiac cathe-terization, nitroglycerine was administrated routinely in all the cases suspected of having coronary spasm. Angiographic anal-ysis was carried out by three experienced interventional cardi-ologists. Coronary artery disease (CAD) was defined as the presence of one or more lesions with greater than 50% luminal narrowing in the coronary artery. Otherwise, patients were classified as angina with insignificant coronary artery stenosis.
Statistical analyses
We analyzed our data with SPSS version 18 (IBM Co., Armonk, NY, USA). A comparison of multiple factors between the groups divided by CAD was performed by Student t test analysis.
Lo-gistic regression analysis of CAD with the variables was per-formed. The proportion of patients with CAD among the groups divided by the mean A1c was analyzed by the chi-square test. A
P value less than 0.05 was considered statistically significant.
RESULTS
Comparison of characteristics of subjects divided into tertiles of intrapersonal SD of serially-measured A1c levels (adj-A1c-SD)
described above totaled 269 patients. Among them, 121 pa-tients had type 2 diabetes with CAD and their mean age was 64.3 years old.
The range of mean A1c levels was 6.75 to 11.67 and the range of SD of A1c levels was 0.06 to 4.54. The range of adj-A1c-SD was 0.049 to 4.127.
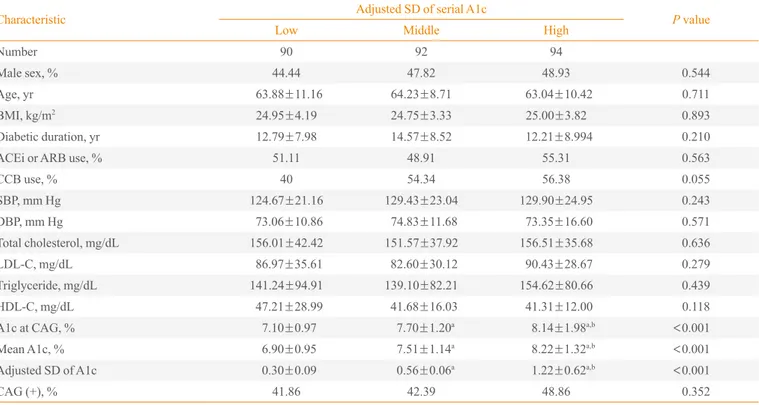
We divided the patients into tertiles of intrapersonal SD of serially-measured A1c levels (Table 1). Patients in the lowest, the middle, and the highest tertile were referred to as the low SD group, the middle SD group, and the high SD group, re-spectively. They did not exhibit any differences in age, body mass index (BMI), smoking status, medication, systolic blood pressure (SBP), and DBP at the time of CAG. Subjects of the three groups had similar total cholesterol, low density lipopro-tein cholesterol (LDL-C), high density lipoprolipopro-tein cholesterol (HDL-C), and triglyceride levels at the time of CAG. The mean A1c levels of the low, middle, and high SD groups were 6.90%±0.95%, 7.51%±1.14%, and 8.22%±1.32%,
respec-tively. The mean A1c levels of the three groups were signifi-cantly different (P<0.05). The ratio of patients with CAD was
not significantly different in the three groups (P=0.352).
The distribution of SD of A1c according to the mean A1c level
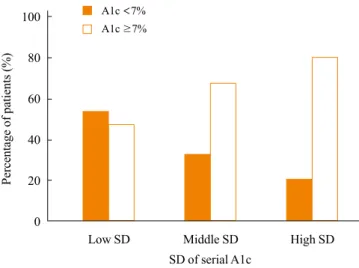
To assess the relationship of SD of A1c and the mean A1c lev-el, we compared the distribution of the SD of A1c according to the mean A1c level (Fig. 1). We divided the subjects into two groups depending on the mean A1c levels: A1c <7% and
≥7%. The percentages of patients with A1c <7% and ≥7% in the low SD group were 53.33% and 46.66%, respectively. In the middle SD group, the percentage of type 2 diabetics with A1c ≥7% was twice the amount of subjects with <7% A1c.
The patients with a mean A1c ≥7% were nearly four times greater in number than A1c <7% patients in the high SD
group.
Comparison of characteristics of subjects divided by mean A1c level and tertiles of intrapersonal SD of serially-measured A1c levels (adj-A1c-SD)
The patients with A1c <7% did not show any significant
dif-Table 1. Characteristics of Patients Divided into Tertiles of Intrapersonal Standard Deviation of Serially-Measured A1c Levels
Characteristic Adjusted SD of serial A1c P value
Low Middle High
Number 90 92 94
Male sex, % 44.44 47.82 48.93 0.544
Age, yr 63.88±11.16 64.23±8.71 63.04±10.42 0.711
BMI, kg/m2 24.95±4.19 24.75±3.33 25.00±3.82 0.893
Diabetic duration, yr 12.79±7.98 14.57±8.52 12.21±8.994 0.210
ACEi or ARB use, % 51.11 48.91 55.31 0.563
CCB use, % 40 54.34 56.38 0.055
SBP, mm Hg 124.67±21.16 129.43±23.04 129.90±24.95 0.243
DBP, mm Hg 73.06±10.86 74.83±11.68 73.35±16.60 0.571
Total cholesterol, mg/dL 156.01±42.42 151.57±37.92 156.51±35.68 0.636
LDL-C, mg/dL 86.97±35.61 82.60±30.12 90.43±28.67 0.279
Triglyceride, mg/dL 141.24±94.91 139.10±82.21 154.62±80.66 0.439
HDL-C, mg/dL 47.21±28.99 41.68±16.03 41.31±12.00 0.118
A1c at CAG, % 7.10±0.97 7.70±1.20a 8.14±1.98a,b <0.001
Mean A1c, % 6.90±0.95 7.51±1.14a
8.22±1.32a,b <
0.001
Adjusted SD of A1c 0.30±0.09 0.56±0.06a 1.22±0.62a,b <0.001
CAG (+), % 41.86 42.39 48.86 0.352
Values are expressed as mean±SD.
SD, standard deviation; BMI, body mass index; ACEi, angiotensin converting enzyme inhibitor; ARB, angiotensin receptor blocker; CCB, calcium chan-nel blocker; SBP, systolic blood pressure; DBP, diastolic blood pressure; LDL-C, low density lipoprotein cholesterol; HDL-C, high density lipoprotein cholesterol; CAG, coronary angiography.
aP<
0.05 vs. low SD group; bP<
ferences in age, BMI, smoking status, medication, SBP, and DBP among the three groups (Table 2). They had similar total
cholesterol, LDL-C, triglyceride, and HDL-C levels. The mean A1c levels of the three groups were significantly different (P<0.001). However, the ratio of patients with CAG was not
significantly different in the three groups (P=0.058) (Table 2).
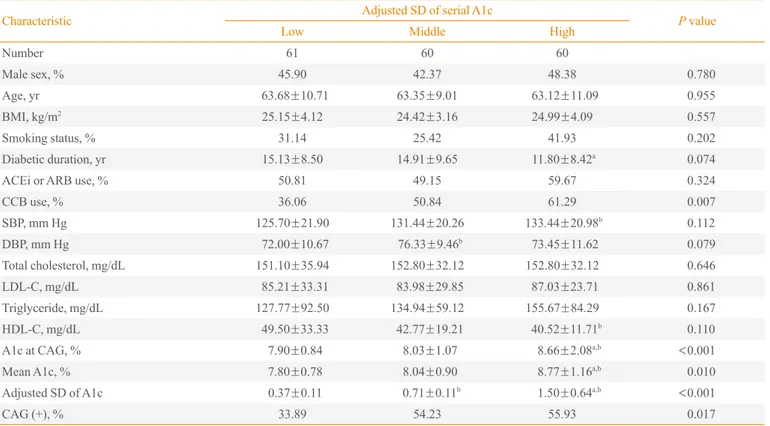
In the subjects with a mean A1c ≥7%, the mean A1c levels and A1c at CAG among the three groups were significantly different (P<0.001). The ratio of patients with CAD was the
highest in the high A1c SD group and the lowest in the low A1c SD group (P=0.017) (Table 3). The use of calcium
chan-nel blocker was significantly different, but other parameters including age, BMI, smoking status, angiotensin converting enzyme inhibitor or angiotensin receptor blocker use, SBP, DBP, and lipid profiles did not exhibit any differences among the three groups in patients with A1c ≥7%.
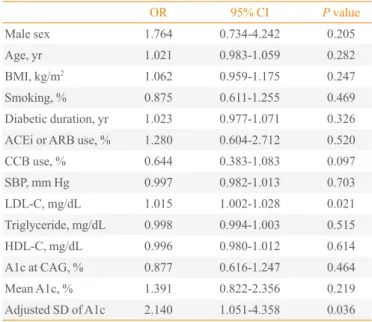
Predictors of CAD in type 2 diabetics
To evaluate the independent predictors for the existence of CAD, we performed a multiple regression analysis. SBP was an independent predictor for CAD in patients with A1c <7%
Table 2. Characteristics of Patients with Mean A1c <7% Divided into Tertiles of Intrapersonal Standard Deviation of Serially-Measured
A1c Levels
Characteristic Adjusted SD of serial A1c P value
Low Middle High
Number 33 32 32
Male sex, % 48.48 50 53.12 0.710
Age, yr 61.57±10.53 66.59±10.17 64.31±8.02 0.116
BMI, kg/m2
24.60±4.07 25.15±3.57 25.33±3.52 0.715
Smoking status, % 30.30 28.12 28.12 0.846
Diabetic duration, yr 10.67±7.09 9.50±7.07 8.96±1.59 0.690
ACEi or ARB use, % 45.45 50 53.12 0.538
CCB use, % 51.51 50 56.25 0.872
SBP, mm Hg 119.30±19.99 126.25±23.32 130.31±23.62 0.138
DBP, mm Hg 72.03±12.60 77.25±10.30 73.43±13.10 0.204
Total cholesterol, mg/dL 160.42±50.46 143.56±34.01 165.50±36.77a 0.088
LDL-C, mg/dL 95.40±42.86 76.61±28.27 94.13±32.38 0.097
Triglyceride, mg/dL 177.88±124.10 139.61±71.08 153.63±82.93 0.338
HDL-C, mg/dL 42.59±11.11 39.23±8.02 41.83±11.44 0.845
A1c at CAG, % 6.30±0.56 6.48±0.69 6.82±1.09b 0.060
Mean A1c, % 6.12±0.54 6.31±0.36b
6.52±0.28a
0.007
Adjusted SD of A1c 0.24±0.78 0.49±0.09b 1.05±0.58a,b <0.001
CAG (+), % 51.61 37.5 27.58 0.058
Values are expressed as mean±SD.
SD, standard deviation; BMI, body mass index; ACEi, angiotensin converting enzyme inhibitor; ARB, angiotensin receptor blocker; CCB, calcium chan-nel blocker; SBP, systolic blood pressure; DBP, diastolic blood pressure; LDL-C, low density lipoprotein cholesterol; HDL-C, high density lipoprotein cholesterol; CAG, coronary angiography.
aP<
0.05 vs. middle SD group; bP<
0.05 vs. low SD group.
Fig. 1. The percentage of patients with A1c <7% and ≥7% in groups divided by tertile of adjusted standard deviation (SD) of serial A1c levels (chi-square, P<0.001).
100
80
60
40
20
0
Low SD Middle SD High SD
SD of serial A1c
A1c <7%
A1c ≥7%
(Table 4). In subjects with A1c ≥7%, the adjusted SD of A1c and LDL-C was an independent predictor for CAD (adjusted SD of A1c, odds ratio [OR], 2.140, P=0.036; LDL-C, OR,
1.045, P=0.021) (Table 5).
DISCUSSION
We focused on the relationship between A1c variability for over 5 years and confirmed CAD using CAG. Patients with larger A1c variability exhibited a tendency to have higher mean A1c levels. CAD was found more frequently in patients with a high SD of A1c in patients with mean A1c ≥7%. When we analyzed these findings in detail, our results showed that larger A1c variability with an adjusted SD of A1c was an inde-pendent predictor for coronary atherosclerosis in patients with mean A1c ≥7%.
The clinical evidence to support our results regarding the association of A1c variability and CAD is few in number be-cause of a lack of interest in A1c variability and a standardized
method to measure glycemic variability in a large number of patients. One previous study reported that the long-term vari-ability of fasting glucose was an independent predictor of mor-tality in patients with type 2 diabetes [21]. They measured at least two fasting plasma glucose (FPG) values every year from 1984 to 1986 and followed the patients for 10 years to assess total and cause-specific mortality. The coefficient of variation (CV) of FPG was an independent predictor of total, cardiovas-cular, and cancer mortality. The mean FPG was a predictor of total mortality only when the CV of FPG was not included in the analyses. Another recent analysis of the DCCT data showed that A1c variability added to the predictive power of the A1c level alone for diabetic nephropathy and retinopathy [20]. They assessed the variation in long-term glycemia as intrapersonal SDs of quarterly measured A1c. The analysis from the data of a Finnish diabetic nephropathy study also reported that A1c variability was a predictor for incident microalbuminuria, pro-gression of renal disease, and the incidence of CVD events in patients with type 1 diabetes [12].
Table 3. Characteristics of Patients with Mean A1c ≥7% Divided into Tertiles of Intrapersonal Standard Deviation of Serially-Measured A1c Levels
Characteristic Adjusted SD of serial A1c P value
Low Middle High
Number 61 60 60
Male sex, % 45.90 42.37 48.38 0.780
Age, yr 63.68±10.71 63.35±9.01 63.12±11.09 0.955
BMI, kg/m2 25.15±4.12 24.42±3.16 24.99±4.09 0.557
Smoking status, % 31.14 25.42 41.93 0.202
Diabetic duration, yr 15.13±8.50 14.91±9.65 11.80±8.42a 0.074
ACEi or ARB use, % 50.81 49.15 59.67 0.324
CCB use, % 36.06 50.84 61.29 0.007
SBP, mm Hg 125.70±21.90 131.44±20.26 133.44±20.98b 0.112
DBP, mm Hg 72.00±10.67 76.33±9.46b 73.45±11.62 0.079
Total cholesterol, mg/dL 151.10±35.94 152.80±32.12 152.80±32.12 0.646
LDL-C, mg/dL 85.21±33.31 83.98±29.85 87.03±23.71 0.861
Triglyceride, mg/dL 127.77±92.50 134.94±59.12 155.67±84.29 0.167
HDL-C, mg/dL 49.50±33.33 42.77±19.21 40.52±11.71b 0.110
A1c at CAG, % 7.90±0.84 8.03±1.07 8.66±2.08a,b <
0.001
Mean A1c, % 7.80±0.78 8.04±0.90 8.77±1.16a,b 0.010
Adjusted SD of A1c 0.37±0.11 0.71±0.11b 1.50±0.64a,b <0.001
CAG (+), % 33.89 54.23 55.93 0.017
Values are expressed as mean±SD.
SD, standard deviation; BMI, body mass index; ACEi, angiotensin converting enzyme inhibitor; ARB, angiotensin receptor blocker; CCB, calcium chan-nel blocker; SBP, systolic blood pressure; DBP, diastolic blood pressure; LDL-C, low density lipoprotein cholesterol; HDL-C, high density lipoprotein cholesterol; CAG, coronary angiography.
The mechanisms by which glucose fluctuation damages cells including vascular endothelium remain uncertain. Stud-ies have shown that temporary or repetitive hyperglycemia in-duces the adhesion of monocytes to endothelial cells compared to consistent hyperglycemia in SD rats [22-24]. Hyperglyce-mic “spikes” may play a direct and significant role in the patho-genesis of diabetic vascular complications [25]. Hyperglyce-mia itself may induce endothelial injury through the formation of toxic metabolites such as ROS, advanced glycation end product [26], increased sorbitol [27], and persistent activation of protein kinase C [28]. Increased ROS serves as a final com-mon pathway of hyperglycemia-induced vascular dysfunction through a multitude of mechanisms. It has been suggested that the wider the glucose level fluctuates, the more ROS is pro-duced, which may induce more severe damage in endothelial cells [13,14,29,30]. Glucose fluctuation may weaken the adap-tion and cause much stronger toxicities [16]. Type 2 diabetes has a linear correlation between increased free radical produc-tion and the magnitude of glucose fluctuaproduc-tions, calculated as the mean amplitude of glycemic excursion. Glycemic excur-sions measured by continuous glucose measurement correlates with oxidative stress in patients with type 2 diabetes [31]. The reason that the predictive power of A1c variability was different between the groups divided by the mean A1c level in
our study is not clear. The treatment effect of intensive glucose control against macrovascular complications of type 2 diabe-tes still remains unanswered, and is a source of frustration in recent large epidemiology studies [32-34]. One new hypothe-sis of the glycemic threshold was recently suggested from ana-lyzing data of one study [35]. Based on their analysis, unlike microvascular complications of diabetes, the glycemic thresh-old of macrovascular complications would be 7%, not 6.5%. Moreover, patients with higher mean A1c levels had higher A1c variability. These may be possible explanations for our result which states that higher A1c variability in patients with mean A1c levels ≥7% may predict the existence of CAD in patients with type 2 diabetes.
There are several limitations in our study. First, our study was a retrospective observation study. We created strict inclu-sion criteria for the purpose of our study in order to minimize that limitation. We collected serial A1c levels from available medical records. Since those values were a part of a routine clinical follow-up plan, there were various intervals between A1C measurements for each patient. The number of measure-ments of A1c during the study period per individual patient also varied. Therefore, we used the SD of serially-measured A1c levels adjusted by the different number of assessments among patients. Medication or insulin therapy for diabetes
Table 4. Predictors of the Existence of Coronary Artery Disease in Type 2 Diabetes with A1c <7%
OR 95% CI P value
Male sex 1.205 0.358-4.060 0.764
Age, yr 1.047 0.977-1.122 0.197
BMI, kg/m2 1.028 0.886-1.191 0.718
Smoking, % 1.197 0.740-1.937 0.464
Diabetic duration, yr 0.983 0.904-1.070 0.694
ACEi or ARB use, % 1.677 0.499-5.635 0.403
CCB use, % 2.010 0.614-6.582 0.248
SBP, mm Hg 1.031 1.001-1.062 0.046
LDL-C, mg/dL 1.000 0.983-1.017 0.980
Triglyceride, mg/dL 1.003 0.997-1.009 0.409
HDL-C, mg/dL 1.020 0.959-1.084 0.538
A1c at CAG, % 0.497 0.191-1.298 0.153
Mean A1c, % 3.048 0.595-15.608 0.181
Adjusted SD of A1c 0.327 0.061-1.753 0.192
OR, odds ratio; CI, confidence interval; BMI, body mass index; ACEi, angiotensin converting enzyme inhibitor; ARB, angiotensin receptor blocker; CCB, calcium channel blocker; SBP, systolic blood pressure; LDL-C, low density lipoprotein cholesterol; HDL-C, high density lipo-protein cholesterol; CAG, coronary angiography; SD, standard deviation.
Table 5. Predictors of the Existence of Coronary Artery Disease in Type 2 Diabetes with A1c ≥7%
OR 95% CI P value
Male sex 1.764 0.734-4.242 0.205
Age, yr 1.021 0.983-1.059 0.282
BMI, kg/m2 1.062 0.959-1.175 0.247
Smoking, % 0.875 0.611-1.255 0.469
Diabetic duration, yr 1.023 0.977-1.071 0.326
ACEi or ARB use, % 1.280 0.604-2.712 0.520
CCB use, % 0.644 0.383-1.083 0.097
SBP, mm Hg 0.997 0.982-1.013 0.703
LDL-C, mg/dL 1.015 1.002-1.028 0.021
Triglyceride, mg/dL 0.998 0.994-1.003 0.515
HDL-C, mg/dL 0.996 0.980-1.012 0.614
A1c at CAG, % 0.877 0.616-1.247 0.464
Mean A1c, % 1.391 0.822-2.356 0.219
Adjusted SD of A1c 2.140 1.051-4.358 0.036
may affect glucose fluctuation, but we did not analyze the dif-ferent modalities of treatment for diabetes due to the inability to determine the certain pattern of drug change over 5 years. In conclusion, we found that A1c variability over the previ-ous 5 years can be a predictor for future coronary atheroscle-rosis in patients with type 2 diabetes with mean A1c levels over 7%.
CONFLICTS OF INTEREST
No potential conflict of interest relevant to this article was re-ported.
ACKNOWLEDGMENTS
This work was supported by the 2012 Inje University Research Grant.
REFERENCES
1. Klein R. Hyperglycemia and microvascular and macrovas-cular disease in diabetes. Diabetes Care 1995;18:258-68.
2. Turner RC, Millns H, Neil HA, Stratton IM, Manley SE, Matthews DR, Holman RR. Risk factors for coronary artery disease in non-insulin dependent diabetes mellitus: United Kingdom Prospective Diabetes Study (UKPDS: 23). BMJ 1998;316:823-8.
3. Kuusisto J, Mykkanen L, Pyorala K, Laakso M. NIDDM and its metabolic control predict coronary heart disease in elderly subjects. Diabetes 1994;43:960-7.
4. The Diabetes Control and Complications Trial Research Group. The effect of intensive treatment of diabetes on the development and progression of long-term complications in insulin-dependent diabetes mellitus. N Engl J Med 1993; 329:977-86.
5. Stratton IM, Adler AI, Neil HA, Matthews DR, Manley SE, Cull CA, Hadden D, Turner RC, Holman RR. Associa-tion of glycaemia with macrovascular and microvascular complications of type 2 diabetes (UKPDS 35): prospective observational study. BMJ 2000;321:405-12.
6. Clark CM Jr, Perry RC. Type 2 diabetes and macrovascu-lar disease: epidemiology and etiology. Am Heart J 1999; 138(5 Pt 1):S330-3.
7. Eastman RC, Javitt JC, Herman WH, Dasbach EJ, Copley-Merriman C, Maier W, Dong F, Manninen D, Zbrozek AS, Kotsanos J, Garfield SA, Harris M. Model of complications
of NIDDM. II. Analysis of the health benefits and cost-ef-fectiveness of treating NIDDM with the goal of normogly-cemia. Diabetes Care 1997;20:735-44.
8. Eastman RC, Javitt JC, Herman WH, Dasbach EJ, Zbrozek AS, Dong F, Manninen D, Garfield SA, Copley-Merriman C, Maier W, Eastman JF, Kotsanos J, Cowie CC, Harris M. Model of complications of NIDDM. I. Model construction and assumptions. Diabetes Care 1997;20:725-34.
9. Gaede P, Vedel P, Larsen N, Jensen GV, Parving HH, Ped-ersen O. Multifactorial intervention and cardiovascular disease in patients with type 2 diabetes. N Engl J Med 2003; 348:383-93.
10. The relationship of glycemic exposure (HbA1c) to the risk of development and progression of retinopathy in the dia-betes control and complications trial. Diadia-betes 1995;44: 968-83.
11. Brownlee M, Hirsch IB. Glycemic variability: a hemoglo-bin A1c-independent risk factor for diabetic complications. JAMA 2006;295:1707-8.
12. Waden J, Forsblom C, Thorn LM, Gordin D, Saraheimo M, Groop PH; Finnish Diabetic Nephropathy Study Group. A1C variability predicts incident cardiovascular events, microalbuminuria, and overt diabetic nephropathy in pa-tients with type 1 diabetes. Diabetes 2009;58:2649-55.
13. Quagliaro L, Piconi L, Assaloni R, Martinelli L, Motz E, Ceriello A. Intermittent high glucose enhances apoptosis related to oxidative stress in human umbilical vein endo-thelial cells: the role of protein kinase C and NAD(P)H-oxidase activation. Diabetes 2003;52:2795-804.
14. Risso A, Mercuri F, Quagliaro L, Damante G, Ceriello A. Intermittent high glucose enhances apoptosis in human umbilical vein endothelial cells in culture. Am J Physiol Endocrinol Metab 2001;281:E924-30.
15. Jones SC, Saunders HJ, Qi W, Pollock CA. Intermittent high glucose enhances cell growth and collagen synthesis in cultured human tubulointerstitial cells. Diabetologia 1999;42:1113-9.
16. Kim M, Chung H, Yoon C, Lee E, Kim T, Kwon M, Lee S, Rhee B, Park J. Increase of INS-1 cell apoptosis under glu-cose fluctuation and the involvement of FOXO-SIRT path-way. Diabetes Res Clin Pract 2012;98:132-9.
17. Su G, Mi S, Tao H, Li Z, Yang H, Zheng H, Zhou Y, Ma C. Association of glycemic variability and the presence and severity of coronary artery disease in patients with type 2 diabetes. Cardiovasc Diabetol 2011;10:19.
J Med 1999;340:115-26.
19. Kilpatrick ES, Rigby AS, Atkin SL. The effect of glucose variability on the risk of microvascular complications in type 1 diabetes. Diabetes Care 2006;29:1486-90.
20. Kilpatrick ES, Rigby AS, Atkin SL. A1C variability and the risk of microvascular complications in type 1 diabetes: data from the Diabetes Control and Complications Trial. Diabetes Care 2008;31:2198-202.
21. Muggeo M, Zoppini G, Bonora E, Brun E, Bonadonna RC, Moghetti P, Verlato G. Fasting plasma glucose variability predicts 10-year survival of type 2 diabetic patients: the Verona Diabetes Study. Diabetes Care 2000;23:45-50.
22. Watada H, Azuma K, Kawamori R. Glucose fluctuation on the progression of diabetic macroangiopathy: new findings from monocyte adhesion to endothelial cells. Diabetes Res Clin Pract 2007;77 Suppl 1:S58-61.
23. Otsuka A, Azuma K, Iesaki T, Sato F, Hirose T, Shimizu T, Tanaka Y, Daida H, Kawamori R, Watada H. Temporary hyperglycaemia provokes monocyte adhesion to endothelial cells in rat thoracic aorta. Diabetologia 2005;48:2667-74.
24. Azuma K, Kawamori R, Toyofuku Y, Kitahara Y, Sato F, Shimizu T, Miura K, Mine T, Tanaka Y, Mitsumata M, Watada H. Repetitive fluctuations in blood glucose enhance monocyte adhesion to the endothelium of rat thoracic aor-ta. Arterioscler Thromb Vasc Biol 2006;26:2275-80.
25. Ceriello A. The emerging role of post-prandial hypergly-caemic spikes in the pathogenesis of diabetic complica-tions. Diabet Med 1998;15:188-93.
26. Hodgkinson CP, Laxton RC, Patel K, Ye S. Advanced gly-cation end-product of low density lipoprotein activates the toll-like 4 receptor pathway implications for diabetic athero-sclerosis. Arterioscler Thromb Vasc Biol 2008;28:2275-81.
27. Toth E, Racz A, Toth J, Kaminski PM, Wolin MS, Bagi Z, Koller A. Contribution of polyol pathway to arteriolar dys-function in hyperglycemia. Role of oxidative stress, re-duced NO, and enhanced PGH(2)/TXA(2) mediation. Am J Physiol Heart Circ Physiol 2007;293:H3096-104.
28. Geraldes P, King GL. Activation of protein kinase C iso-forms and its impact on diabetic complications. Circ Res 2010;106:1319-31.
29. Ge QM, Dong Y, Zhang HM, Su Q. Effects of intermittent
high glucose on oxidative stress in endothelial cells. Acta Diabetol 2010;47 Suppl 1:97-103.
30. Quagliaro L, Piconi L, Assaloni R, Da Ros R, Maier A, Zuodar G, Ceriello A. Intermittent high glucose enhances ICAM-1, VCAM-1 and E-selectin expression in human umbilical vein endothelial cells in culture: the distinct role of protein kinase C and mitochondrial superoxide produc-tion. Atherosclerosis 2005;183:259-67.
31. Monnier L, Mas E, Ginet C, Michel F, Villon L, Cristol JP, Colette C. Activation of oxidative stress by acute glucose fluctuations compared with sustained chronic hyperglyce-mia in patients with type 2 diabetes. JAMA 2006;295: 1681-7.
32. Action to Control Cardiovascular Risk in Diabetes Study Group, Gerstein HC, Miller ME, Byington RP, Goff DC Jr, Bigger JT, Buse JB, Cushman WC, Genuth S, Ismail-Beigi F, Grimm RH Jr, Probstfield JL, Simons-Morton DG, Frie-dewald WT. Effects of intensive glucose lowering in type 2 diabetes. N Engl J Med 2008;358:2545-59.
33. ADVANCE Collaborative Group, Patel A, MacMahon S, Chalmers J, Neal B, Billot L, Woodward M, Marre M, Coo-per M, Glasziou P, Grobbee D, Hamet P, Harrap S, Heller S, Liu L, Mancia G, Mogensen CE, Pan C, Poulter N, Rodgers A, Williams B, Bompoint S, de Galan BE, Joshi R, Travert F. Intensive blood glucose control and vascular outcomes in patients with type 2 diabetes. N Engl J Med 2008;358: 2560-72.
34. Duckworth W, Abraira C, Moritz T, Reda D, Emanuele N, Reaven PD, Zieve FJ, Marks J, Davis SN, Hayward R, Warren SR, Goldman S, McCarren M, Vitek ME, Hender-son WG, Huang GD; VADT Investigators. Glucose control and vascular complications in veterans with type 2 diabe-tes. N Engl J Med 2009;360:129-39.