Are platelet indices useful in the evaluation
of type 2 diabetic patients?
Os índices plaquetários são úteis na avaliação de pacientes diabéticos tipo 2?
Kamilla R. Alhadas; Sandra N. Santos; Marcela Mara S. Freitas; Sophia Mara S. A. Viana; Luiz Cláudio Ribeiro; Mônica B. Costa Universidade Federal de Juiz de Fora, Minas Gerais, Brasil.
First submission on 24/08/15; last submission on 09/03/16; accepted for publication on 09/03/16; published on 20/04/16
ABSTRACT
Introduction: Long-term complications of diabetes mellitus are a leading cause of death in people with diabetes. Recent studies suggest that platelets with altered morphology could be associated with an increased risk for developing vascular complications in diabetes. Objective: To evaluate the platelet parameters in diabetic patients and correlate these indices with microvascular and macrovascular complications
of the disease. Materials and methods: We analyzed platelet parameters and biochemical data of patients seen in outpatient clinics of a university hospital. Individuals aged between 30 and 60 years were included, 100 patients with type 2 diabetes mellitus (T2DM) (DM group) and 100 non-diabetic patients (control group). Results: We observed increase in plateletcrit (PCT): 0.21 ± 0.054% vs 0.20 ± 0.045% (p =
0.020); in mean platelet volume (MPV): 8.69 ± 1.288 l vs 8.27 ± 1.244 l (p = 0.018); and in platelet distribution width (PDW): 17.8 ±
1.06 l vs 17.5 ± 0.87 l (p = 0.039) in the DM and control groups, respectively. Values of MPV, PCT, and PDW were higher among patients with complications of T2DM (p < 0.001). In those with macrovascular disease, we observed a correlation between glycated hemoglobin
(A1C) and MPV (p = 0.015) and PDW (p = 0.009) levels. Among patients with microvascular complications, there was a correlation
between platelet count and MPV with A1C levels (p < 0.001). Conclusion: The study indings point to signiicant differences in platelet parameters in patients with T2DM, suggesting the presence of more reactive and aggregatable platelets in this group of individuals. These results suggest that platelet evaluation may be useful in the early detection of long-term complications in diabetic patients, considering that it is a simple and low-cost tool.
Key words: platelets; diabetes mellitus; hyperglycemia; mean platelet volume.
INTRODUCTION
Type 2 diabetes mellitus (T2DM) is a serious public health problem, considering its epidemic prevalence levels and high
morbidity and mortality rate(1). This type of diabetes that results from
resistance to insulin action associated with a relative deiciency of this hormone, has an insidious development and is often diagnosed due to the presence of microvascular or macrovascular complications(2).
The development of long-term complications has a close relationship with endothelial dysfunction mainly caused by poor glycemic control, and is the leading cause of death and poor quality of life in this group of individuals(3). The search for assessment tools
to establish an early diagnosis of these complications is a challenge, but in recent years, several studies have highlighted the participation
of platelets as one of the coagulation system elements involved in the
genesis of these events(4-7).
In the process of atherogenesis, the activity of the platelets and their potential aggregation actively participate in the development of thrombi. Furthermore, the function of these cells seems to be related to their sizes. Some studies have shown that large
platelets are most reactive and aggregatable, have high amounts of dense granules, and present increased thrombotic potential when compared with smaller and less active platelets(8-10). Recent
studies have shown signiicant increases in platelet parameters in diabetic subjects when compared with controls, particularly in mean platelet volume (MPV) and platelet distribution width (PDW). These studies suggest that platelets with altered morphology could be associated with increased risk of vascular complications
in diabetes(5-7, 11). Hyperglycemia, in turn, contributes to increase
in platelet reactivity by exerting direct effects on this cells and promoting glycosylation of platelet proteins(5, 6, 12, 13).
OBJECTIVE
The aim of this study is to evaluate the platelet parameters in patients with T2DM, in order to demonstrate a potential correlation between these indices and the microvascular and macrovascular complications of the disease.
MATERIALS AND METHODS
Selection of patients
This descriptive study includes analysis of platelet parameters and biochemical data of subjects seen at the Hospital of the Universidade Federal de Juiz de Fora (UFJF) from February 2013 to January 2014. The cohort study included two groups: patients with T2DM (DM group) and non-diabetic subjects as the control group.
To include patients in the DM group, we analyzed the electronic medical records of 420 outpatients seen at the Diabetes Clinic, of which 127 were selected and invited to participate in the study during their routine medical appointment. We included patients with T2DM regardless ethnicity and gender, aged between 30 and 60 years. In the control group, there were 152 individuals of both sexes and of any ethnicity, selected through analysis of electronic records to be age-matched to the DM group.
In both groups, we excluded subjects with anemia, leukopenia or leukocytosis, thrombocytopenia or thrombocytosis,
hypertriglyceridemia, hypercreatininemia, human
immunodeiciency virus (HIV) infection, hepatitis B, hepatitis C, systemic lupus erythematosus, thrombosis and/or hematologic disorders, as well as smokers and pregnant women. Subjects with fasting blood glucose levels ≥ 100 mg/dl or with a previous diagnosis of coronary artery disease were not included in the control group.
The study was approved by UFJF Hospital Institutional Ethics Committee, and registered under number 186,039. All participants illed out a free and informed consent form (FICF).
Medical history
After signing the FICF, we obtained from both groups the clinical history data by the analysis of medical records available in
electronic iles. These data included age, gender, duration of diabetes, medications in use, and previous diagnosis of microvascular (retinopathy or nephropathy) or macrovascular (coronary artery disease, stroke, and peripheral artery disease) complications.
Laboratory analysis
Venous blood samples were collected between 7 a.m. and 9 a.m. after a 12-hour fasting period in the Laboratory Professor Maurílio Baldi, UFJF. The following laboratory tests were performed: RBC count, hematocrit, hemoglobin, total WBC count, platelet count, MPV, PCT, PDW, fasting blood glucose, creatinine, total cholesterol, high density lipoprotein cholesterol (HDL-cholesterol), and triglycerides levels. In the DM group, glycated hemoglobin (A1C) levels were also measured.
Blood sample (approximate volume 4 ml) for complete blood count, platelet parameters, and A1C tests, was collected in vacuum tubes containing the anticoagulant ethylenediaminetetraacetic acid (K3 EDTA). The samples were kept at room temperature and processed within two hours ater collection. For the biochemical tests, blood samples (5 ml) were collected in tubes without anticoagulant, and were centrifuged in LS-3 Plus (CELM) equipment for 5 minutes at 3,400 rpm for serum separation.
Hematological analysis
The complete blood count was determined in a Cell-Dyn®3700SL (Abbott Diagnostics) hematology analyzer, which
uses electrical impedance/low cytometry, light/laser scattering, and spectrophotometry method.
The following reference values were adopted for the erythrocyte count: 4.3 to 6.0 million/mm3 and 3.9 to 5.3 million/mm3; for
hemoglobin: 13.5 to 17.8 g/dl and 12.0 to 16.0; for hematocrit: 41% to 54% and 36% to 48% for men and women, respectively; for total leukocyte count: 3,600 to 11,000/mm3; for platelet count
140,000 to 400,000/mm3; for MPV: 6.2 to 11.8 l. For PCT and PDW
there are no standardized reference values(14).
Biochemical analysis
To analyze the biochemical parameters, namely, fasting glucose levels – 70 to 99 mg/dl; total cholesterol levels: 140 to 200 mg/dl; HDL-cholesterol levels: 40 to 60 mg/dl; triglycerides levels: 65 to 150 mg/dl; and creatinine levels: 0.7 to 1.4 mg/dl for men, and 0.6 to 1.1 mg/dl for women we adopted the reference values according to the kit manufacturer’s speciications. For A1C, we used the reference value 4.8% to 5.9%. Friedewald(15) formula
was used for estimation of LDL-cholesterol levels: LDL-chol = total-chol – HDL-chol – (TG/5).
Statistical analysis
The data were analyzed with the software for statistical analysis SPSS, version 15. We applied descriptive statistics and exploratory data analysis to obtain means and standard deviations. For the qualitative variables, the Chi-square test was performed and provided the number of patients for each gender in both groups. Analysis of variance (ANOVA) and independent t test were used to test the difference between means. To verify the association between fasting blood glucose and A1C levels with platelet parameters, we applied Pearson correlation, considering a statistically signiicant result when p < 0.05 and a strong correlation when r > 0.60. Furthermore, we used linear regression analysis to verify the clinical signiicance of glucose concentration and duration of diabetes between patients in the control group and DM group.
A total of 279 subjects were considered eligible, of which 79 were excluded due to abnormal laboratory results deined in the exclusion criteria. Among the 200 patients studied, 100 were
included in the control group and 100 in the DM group. The mean duration of diabetes among the cases was 6.5 ± 3 years.
RESULTS
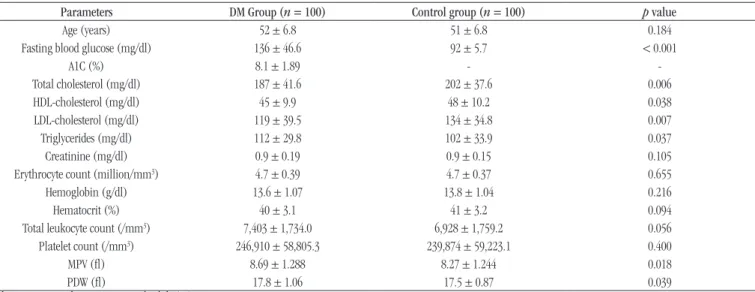
The groups were homogeneous regarding age and there was a female predominance in both groups, with sex ratio (male/ female) of 0.4 in the DM group and 0.3 in the control group. The red blood cells and leukocyte count were within the reference values and showed no statistical difference between the groups. The biochemical and hematological indings in the studied groups are presented in Table 1.
Although the platelet counts were similar between the groups, there was an increase in PCT in the DM group: 0.214 ± 0.0540% and 0.198 ± 0.0447% (p = 0.020), in the DM and control groups,
respectively.
When we analyzed a possible correlation between fasting blood glucose levels and platelet parameters in the DM group, we observed a positive correlation with MPV (p = 0.005) and PDW (p = 0.008), indicating that patients with higher fasting blood
glucose levels tended to present higher values of MPV and PDW. However, the correlation was weak (r < 0.60). In the control
group, Pearson correlation was not signiicant (Table 2).
We also observed a positive and signiicant correlation between platelet parameters and A1C levels in the DM group, but a weak correlation for MPV, PCT, and PDW, suggesting that patients with higher A1C levels tend to have higher MPV, PCT, and PDW values
(Table 3).
TABLE 1 – Biochemical and hematological analysis of the studied subjects
Parameters DM Group (n = 100) Control group (n = 100) p value
Age (years) 52 ± 6.8 51 ± 6.8 0.184
Fasting blood glucose (mg/dl) 136 ± 46.6 92 ± 5.7 < 0.001
A1C (%) 8.1 ± 1.89 -
-Total cholesterol (mg/dl) 187 ± 41.6 202 ± 37.6 0.006
HDL-cholesterol (mg/dl) 45 ± 9.9 48 ± 10.2 0.038
LDL-cholesterol (mg/dl) 119 ± 39.5 134 ± 34.8 0.007
Triglycerides (mg/dl) 112 ± 29.8 102 ± 33.9 0.037
Creatinine (mg/dl) 0.9 ± 0.19 0.9 ± 0.15 0.105
Erythrocyte count (million/mm3) 4.7 ± 0.39 4.7 ± 0.37 0.655
Hemoglobin (g/dl) 13.6 ± 1.07 13.8 ± 1.04 0.216
Hematocrit (%) 40 ± 3.1 41 ± 3.2 0.094
Total leukocyte count (/mm3) 7,403 ± 1,734.0 6,928 ± 1,759.2 0.056
Platelet count (/mm3) 246,910 ± 58,805.3 239,874 ± 59,223.1 0.400
MPV (l) 8.69 ± 1.288 8.27 ± 1.244 0.018
PDW (l) 17.8 ± 1.06 17.5 ± 0.87 0.039
Values are expressed as mean ± standard deviation.
Long-term complications of diabetes were present in 41% of patients with T2DM, and they are distributed as follows – atherosclerotic vascular disease (coronary artery disease/stroke): 12%, retinopathy: 11%, nephropathy: 9%, both macrovascular and microvascular complications: 8%, both nephropathy and retinopathy: 1%. When comparing platelet parameters in diabetics with and without complications, we found that patients with complications showed MPV, PCT, and PDW higher than patients without complications (p < 0.001). The results of the platelet
parameters in diabetic patients are shown in Table 4.
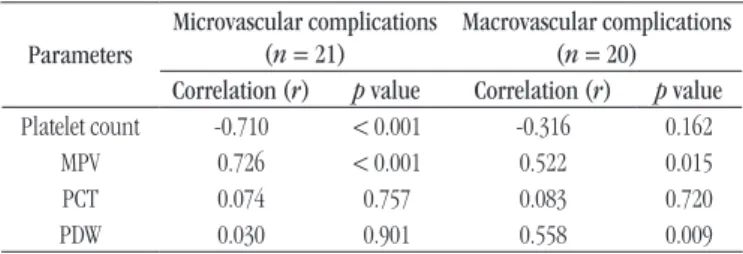
Moreover, in patients with macrovascular complications, there was a statistically signiicant correlation between MPV and PDW with A1C levels (p = 0.015 and p = 0.009, respectively). For both parameters Pearson correlation coeficient was positive, indicating that among these patients, those with higher A1C levels tended to show higher values of MPV and PDW. Among patients with microvascular complications, we observed a statistically signiicant correlation between platelet count and MPV with A1C
levels (p < 0.001) and, regarding MPV, Pearson correlation was
strong positive. Platelet count had a strong negative Pearson correlation with A1C levels (Table 5). The linear regression analyzes were not signiicant.
DISCUSSION
In this study, we observed an increase in PCT, MPV, and PDW, and a positive correlation between platelet parameters and fasting blood glucose, and A1C levels in patients with T2DM. In the presence of macrovascular complications, there was a signiicant correlation between A1C levels, MPV and PDW. Furthermore, a signiicant correlation between A1C, platelet count and MPV was found in the presence of microvascular complications, supporting the idea that the presence of more reactive and aggregatable platelets may be one of the factors involved in the development of diabetes complications.
In fact, several authors have described platelets changes associated with diabetes. Furthermore, the wide use of electronic counters in laboratories has allowed the quantiication of platelet parameters(16-18), which may relect the functionality of these
cells. Among these parameters, MPV and PDW stand out due to their involvement in the development of thromboembolic complications(19).
In the present study, the analysis of hematological parameters showed that the mean platelet count was higher in the diabetic group than in the control group, although the difference was not statistically signiicant. This was similar to other studies(13, 16, 20)
indings. However, Hekimsoy et al. (2004)(6) observed an increased
number of platelets in a group of non-diabetic patients compared with diabetic patients, this fact can be explained by the presence of other factors that may have inluenced the platelet count, such as the mean platelet survival, and the platelet production and turnover rate in T2DM.
Another aspect that deserves attention is the platelet size seems to be related to their function. Studies have shown that platelets with greater volume are more reactive and aggregatable, have a greater amount of dense granules, and present increased thrombotic potential when compared with
TABLE 5 – Pearson’s correlation and p values for the association
between glycated hemoglobin levels and platelet parameters in diabetic patients with chronic complications
Parameters
Microvascular complications (n = 21)
Macrovascular complications (n = 20) Correlation (r) pvalue Correlation (r) pvalue
Platelet count -0.710 < 0.001 -0.316 0.162
MPV 0.726 < 0.001 0.522 0.015
PCT 0.074 0.757 0.083 0.720
PDW 0.030 0.901 0.558 0.009
MPV: mean platelet volume; PCT: plateletcrit; PDW: platelet distribution width.
TABLE 2 – Pearson correlation for the association between
platelet parameters and fasting blood glucose
Parameters DM group (n = 100) Control group (n = 100) Correlation (r) p value Correlation (r) p value
MPV 0.279 0.005 -0.032 0.755
PCT 0.196 0.051 0.018 0.858
PDW 0.262 0.008 -0.012 0.904
DM: diabetes mellitus; MPV: mean platelet volume; PCT: plateletcrit; PDW: platelet distribution width.
TABLE 3 – Pearson correlation for the association between platelet
parameters and glycated hemoglobin in diabetic patients Parameters Correlation (r) p value
MPV 0.393 < 0.001
PCT 0.331 0.001
PDW 0.361 < 0.001
MPV: mean platelet volume; PCT: plateletcrit; PDW: platelet distribution width.
TABLE 4 – Platelet parameters in diabetic individuals
with and without chronic complications
Parameters Diabetics with complication (n = 41)
Diabetics without
complication (n = 59) p value
MPV (l) 9.83 ± 0.998 7.90 ± 0.769 < 0.001
PCT (%) 0.25 ± 0.0351 0.19 ± 0.0389 < 0.001
PDW (l) 18.30 ± 1.090 17.40 ± 0.870 < 0.001
smaller and less active platelets(5, 6, 8-10, 13, 16-18, 21-24). Hyperglycemia
is also a factor that contributes to an increase in platelet reactivity, since it exerts direct effects on these cells and promotes glycosylation of platelet proteins(5, 6, 12, 13). Therefore,
large circulating platelets are relected by increase in MPV, and the elevation of this parameter is considered an independent risk factor for thromboembolism, stroke and acute myocardial infarction(25-27). In diabetic patients, a high MPV is an important
inding and could predict an increased risk for thrombosis and chronic complications(13, 20, 23).
Several authors have suggested that patients with T2DM have increased MPV when compared with non-diabetic and, among the diabetics, those with vascular complications presented higher MPV values(5, 6, 17, 18, 23, 24, 28-31). The present study showed higher
MPV values for the diabetics and in those with complications, although no signiicant difference related to the type of chronic complication (microvascular or macrovascular). In a study by Zuberi et al. (2008)(20), MPV was signiicantly higher in diabetic
patients with vascular complications than in diabetics without complications. However, Papanas et al. (2004)(28) found higher
MPV values in diabetics with microvascular complications, and in the studies of Ates et al. (2009)(23) and Tuzcu et al. (2014)(31),
the MPV was higher in patients with retinopathy. In contrast, Kodiatte et al. (2012)(13) found higher MPV values in patients
with microvascular complications, although no signiicant difference was found. In the present study, both patients with microvascular and macrovascular complications showed positive association between of A1C levels and MPV, a inding that was also reported by other authors(13, 16, 17, 24).
Regarding PDW, the present study showed that diabetic patients had higher PDW when compared to those without diabetes, a inding that has also been described by Dalamaga et al. (2010)(17). The activated platelets differ in size
from non-activated ones mainly due to a change from a discoid to a spherical shape and pseudopodia formation, leading to a change in the PDW, as observed by Vagdatli et al. (2010)(32). In
addition, signiicant differences were found in PDW parameter in diabetic patients with complications when compared with diabetics without complications, corroborating the results of Jindal et al. (2011)(5). These indings can be attributed to the
accelerated production of platelets in patients with T2DM. Thus, qualitative changes such as different sizes of platelets can be found. Consequently, the base of the histogram plotting the platelet distribution is enlarged, increasing the PDW(32).
Moreover, a positive correlation was found between fasting blood glucose levels and PDW in diabetic patients and, in those with macrovascular complications, positive correlation between A1C and PDW was found. When this group was analyzed for A1C, there was a also positive correlation for MPV and PCT. Changes in PDW and MPV may be related to poor glycemic control, possibly due to the osmotic effect resulting from increased glucose levels and some of its metabolites in blood(17).
There are a few reports in the literature on PCT, and in the present study, we found higher levels in diabetic subjects. Moreover, this parameter was signiicantly higher in the presence chronic complications. Considering that the platelet mass or PCT must be constant, as the platelet volume increases, the platelet count tends to decrease to maintain a normal PCT. Since in diabetic patients the platelets are larger and more reactive, the platelet mass increases, thereby increasing the PCT(33, 34).
Another important aspect is related to dyslipidemia that is considered to be an important risk factor for atherosclerosis in diabetic patients(3, 30). In the present study, diabetic patients
had higher levels of triglycerides and lower levels of HDL-cholesterol, this inding was also reported in the study by Abali et al. (2014)(30). However, the DM group showed lower
total cholesterol levels when compared to the control group, a inding that may be attributed to the use of statins by a large number of diabetics.
Due to ethical issues, medications commonly used by diabetics were kept, which was a limitation of the present study. On the other hand, this fact has contributed to an assessment of these individuals in a real scenario. In addition, other factors such as physical activity, diet, and family history may have inluenced the results.
CONCLUSION
RESUMO
Introdução: O desenvolvimento das complicações crônicas relacionadas com diabetes mellitus representa a principal causa de mortalidade nesse grupo de indivíduos. Estudos recentes sugerem que plaquetas com morfologia alterada poderiam estar associadas ao aumento do risco de complicações vasculares no diabetes. Objetivo: Avaliar os índices plaquetários em diabéticos, correlacionando-os com as complicações micro e macrovasculares da doença. Materiais e métodos: Foi realizada a análise de índices plaquetários e dados bioquímicos de pacientes atendidos nos ambulatórios de um hospital universitário. Foram incluídos indivíduos com idade entre 30 e 60 anos, sendo 100 diabéticos (grupo DM) e 100 não diabéticos (grupo-controle). Resultados:
Observou-se elevação do plaquetócrito: 0,21 ± 0,054% versus 0,20 ± 0,045% (p = 0,020); do volume plaquetário médio (VPM): 8,69 ± 1,288 fl versus 8,27 ± 1,244 fl (p = 0,018); e da distribuição de plaquetas (PDW): 17,8 ± 1,06 fl versus 17,5 ± 0,87 fl (p = 0,039), nos grupos DM e controle, respectivamente. Os valores de VPM, plaquetócrito e PDW apresentaram-se mais elevados entre os indivíduos com complicações do diabetes mellitus tipo 2 (DM2) (p < 0,001). Naqueles com complicações macrovasculares, observou-se correlação entre os níveis de hemoglobina glicada (A1C) e VPM (p = 0,015) e PDW (p = 0,009). Entre os pacientes com complicações microvasculares, observou-se correlação entre a plaquetometria e o VPM com os níveis de A1C (p < 0,001).
Conclusão: Os dados do presente estudo apontam para diferenças significativas nos índices plaquetários em pacientes com DM2, sugerindo presença de plaquetas mais reativas e agregáveis nesse grupo de indivíduos. Tais resultados sugerem que a avaliação plaquetária pode ser útil na detecção precoce de complicações crônicas em diabéticos, sobretudo por ser ferramenta de fácil obtenção e baixo custo.
Unitermos: plaquetas; diabetes mellitus; hiperglicemia; volume plaquetário médio.
REFERENCES
1. International Diabetes Federation. IDF Diabetes Atlas. 6 ed. Brussels, Belgium: International Diabetes Federation; 2013. Available at: http:// www.idf.org/diabetesatlas.
2. American Diabetes Association. Classiication and diagnosis of diabetes. Diabetes Care. 2015; 38: S8-S16.
3. Sociedade Brasileira de Diabetes. Diretrizes da Sociedade Brasileira de Diabetes. 2013-2014. São Paulo: AC Farmacêutica.
4. Balasubramaniam K, Viswanathan GN, Marshall SM, Zaman AG. Increased atherothrombotic burden in patients with diabetes mellitus and acute coronary syndrome: a review of antiplatelet therapy. Cardiol Res Pract [Internet]. 2012; 2012. Available at: http://downloads.hindawi. com/journals/crp/2012/909154.pdf.
5. Jindal S, Gupta S, Gupta R, et al. Platelet indices in diabetes mellitus: indicators of diabetic microvascular complications. Hematology. 2011 Mar; 16(2): 86-9. PubMed PMID: 21418738.
6. Hekimsoy Z, Payzin B, Ornek T, Kandoğan G. Mean platelet volume in type 2 diabetic patients. J Diabetes Complications. 2004 May-Jun; 18(3): 173-6. PuMeb PMID: 15145330.
7. Wendland AE, Farias MG, Manfroi WC. Volume plaquetário médio e doença cardiovascular. J Bras Patol Med Lab [Internet]. 2009 Oct; 45(5): 371-8. Available at: http://www.scielo.br/pdf/jbpml/v45n5/v45n5a05.pdf. 8. Endler G, Klimesch A, Sunder-Plassmann H, et al. Mean platelet volume is an independent risk factor for myocardial infarction but not for coronary artery disease. Br J Haematol. 2002 May; 117(2): 399-404. PubMed PMID:11972524.
9. Kiliçli-Camur N, Demirtunç R, Konuralp C, Eskiser A, Başaran Y. Could mean platelet volume be a predictive marker for acute myocardial infarction? Med Sci Monit. 2005 Aug; 11(8): CR387-92. PubMed PMID: 16049381.
10. Farias MG, Dal Bó S. Importância clínica e laboratorial do volume plaquetário médio. J Bras Patol Med Lab [Internet]. 2010 Aug; 46(4): 275-81. Available at: http://www.scielo.br/pdf/jbpml/v46n4/03.pdf. 11. Osuna PP, Ballesteros FN, Muñoz JLM, et al. Inluencia del volumen plaquetario medio sobre el prognóstico a corto plazo del infarto agudo de miocardio. Rev Esp de Cardiol [Internet]. 1998 Oct; 51(10): 816-22. Available at: http://www.revespcardiol.org/es/pdf/359/S300/.
12. Schneider DJ. Factors contributing to increased platelet reactivity in people with diabetes. Diabetes Care. 2009 Apr; 32(4): 525-7. PubMed PMCID: PMC2660482.
13. Kodiatte TA, Manikyam UK, Rao SB, et al. Mean platelet volume in type 2 diabetes mellitus. J Lab Physicians. 2012 Jan-Jun; 4(1): 5-9. PubMed PMCID: PMC3425267.
14. Oliveira RAG. Hemograma: como fazer e interpretar. 1 ed. São Paulo: Livraria Médica Paulista Editora; 2007.
15. Friedewald WT, Levy RI, Friesrickson DS. Estimation of the concentration of low-density lipoprotein cholesterol in plasma, without use of the preparative ultracentrifuge. Clin Chem. 1972 Jun; 18(6): 499-502. PubMed PMID: 4337382.
CORRESPONDING AUTHOR
Kamilla Rocha Alhadas
Rua Mariano Procópio, 1406/606; Mariano Procópio; CEP: 36080-010; Juiz de Fora-MG, Brasil; e-mail: [email protected]. 17. Dalamaga M, Karmaniolas K, Lekka A, et al. Platelet markers correlate
with glycemic indices in diabetic, but not diabetic-myelodysplastic patients with normal platelet count. Dis Markers. 2010; 29(1): 55-61. PubMed PMID: 20826918.
18. Ekici B, Erkan AF, Alhan A, Sayin I, Ayli M, Töre HF. Is mean platelet volume associated with the angiographic severity of coronary artery disease? Kardiol Pol. 2013; 71(8): 832-8. PubMed PMID: 24049023. 19. Jabeen F, Fawwad A, Rizvi HA, Alvi F. Role of platelet indices, glycemic control and hs-CRP in pathogenesis of vascular complications in type-2 diabetic patients. Pak J Med Sci. 2013 Jan-Mar; 29(1): 152-6. PubMed PMCID: PMC3809177.
20. Zuberi BF, Akhtar N, Afsar S. Comparison of mean platelet volume in patients with diabetes mellitus, impaired fasting glucose and nondiabetic subjects. Singapore Med J. 2008 Feb; 49(2): 114-6. PubMed PMID: 1830183.
21. Gawaz M, Langer H, May AE. Platelets in inlammation and atherogenesis. J Clin Invest. 2005 Dec; 115(12): 3378-84. PubMed PMID: 16322783.
22. Coppinger JA, Cagney G, Toomey S, et al. Characterization of the proteins released from activated platelets leads to localization of novel platelet proteins in human atherosclerotic lesions. Blood. 2004 Mar 15; 103(6): 2096-104. PubMed PMID: 14630798.
23. Ateş O, Kiki I, Bilen H, et al. Association of mean platelet volume with the degree of retinopathy in patients with diabetes mellitus. Eur J Gen Med [Internet]. 2009; 6(2): 99-102. Available at: http://www.bioline.org. br/pdf?gm09022.
24. Vernekar PV, Vaidya KA. Comparison of mean platelet volume in type 2 diabetics on insulin therapy and on oral hypoglycemic agents. J Clin Diagn Res. 2013 Dec; 7(12): 2839-40. PMCID: PMC3919346.
25. Bath P, Algert C, Chapman N, Neal B; Progress Collaborative Group. Association of mean platelet volume with risk of stroke among 3,134
individuals with history of cerebrovascular disease. Stroke. 2004 Mar; 35(3): 622-6. PubMed PMID: 14976328.
26. Khandekar MM, Khurana AS, Deshmukh SD, Kakrani AL, Katdare AD, Inamdar AK. Platelet volume indices in patients with coronary artery disease and acute myocardial infarction: an Indian scenario. J Clin Pathol. 2006 Feb; 59(2): 146-9. PubMed PCMID: PMC1860313. 27. O’Malley T, Langhorne P, Elton RA, Stewart C. Platelet size in stroke patients. Stroke. 1995 Jun; 26(6): 995-9. PubMed PMID: 7762052. 28. Papanas N, Symeonidis G, Maltezos E, et al. Mean platelet volume in patients with type 2 diabetes mellitus. Platelets. 2004 Dec; 15(8): 475-8. PubMed PMID: 15763888.
29. Tufano A, Cimino E, Di Minno MND, et al. Diabetes mellitus and cardiovascular prevention: the role and the limitations of currently available antiplatelet drugs. Int J Vasc Med [Internet]; 2011; 2011. Available at: http://downloads.hindawi.com/journals/ijvm/2011/250518. pdf.
30. Abali G, Akpinar O, Soylemez N. Correlation of the coronary severity scores and mean platelet volume in diabetes mellitus. Adv Ther. 2014 Jan; 31(1): 140-8. PubMed PMID: 24318519.
31. Tuzcu EA, Arica S, Ilhan N, et al. Relationship between mean platelet volume and retinopathy in patients with type 2 diabetes mellitus. Graefes Arch Clin Exp Ophthalmol [Internet]. 2014 Feb; 252(2): 237-40. Available at: http://link.springer.com/article/10.1007%2Fs00417-013-2444-y. 32. Vagdatli E, Gounari E, Lazaridou E, Katsibourlia E, Tsikopoulou F, Labrianou I. Platelet distribution width: a simple, practical and speciic marker of activation of coagulation. Hippokratia. 2010 Jan; 14(1): 28-32. PubMed PMID: 20411056.