INTRODUCTION
Invasive species have become a serious socioeco-nomic problem worldwide. The costs of control-ling invasive species have been increasing in recent years (Pimentel et al., 2005). A clear understanding of mechanisms the occurrence of invasive species in the environment (Usseglio-Polatera et al., 2000) would therefore be advantageous in creating effi-cient measures for the better management of inva-sive species.
In general, the more diverse a community is, the higher the chance that a particular taxon lives in a given habitat with various combinations of species traits (Usseglio-Polatera et al., 2000). Species traits therefore will provide useful information about spe-cies invasiveness, although there are some technical issues, e.g., local idiosyncrasies and phylogenetic constraints (Lloret et al., 2005). A growing body of research suggests that the success of invasive plants is controlled by a series of key processes or traits (Theoharides and Dukes, 2007). Consequently,
some researchers recommend identifying groups of organisms with similar relationships among their species traits.
Functional groupings (Fox and Brown, 1993; Gitay and Noble, 1997; Wilson, 1999) denote species sharing common attributes. They have been used in different fields of ecological research, including vegetation studies, conservation, and so on (Salmaso and Padisak, 2007 and the references therein). Irrespective of the organisms studied, a common assumption within such a grouping is that the char-acteristics of a community can be better understood if species are grouped into classes that possess simi-lar characteristics or behave simisimi-larly (Salmaso and Padisak, 2007).
Functional grouping analysis has some advan-tages in examining traits on an individual level because many traits manifest advantages only when acting synergistically (Lambdon et al., 2007). There are many works applying the concept of functional groups, for example, ones dealing with conservation
Functional grouping and establishment oF distribution patterns oF invasive plants in china using selF-organizing maps and indicator species analysis
ZI-BO WANG1, YOU-FANG CheN2, YOU-hUA CheN1,3
1School of Biology and Chemistry, Tianshui Normal College, Gansu Province, China 2Lianzhou Middle School, Guangxi Province, China
3College of Life Sciences, Wuhan University, hubei Province, China
Abstract — In the present study, we introduce two techniques – self-organizing maps (SOM) and indicator species analy-sis (INDVAL) – for understanding the richness patterns of invasive species. We first employed SOM to identify functional groups and then used INDVAL to identify the representative areas characterizing these functional groups. Quantitative traits and distributional information on 127 invasive plants in 28 provinces of China were collected to form the matri-ces for our study. The results indicate Jiangsu to be the top province with the highest number of invasive species, while Ningxia was the lowest. Six functional groups were identified by the SOM method, and five of them were found to have significantly representative provinces by the INDVAL method. Our study represents the first attempt to combine self-organizing maps and indicator species analysis to assess the macro-scale distribution of exotic species.
Key words: Functional groups, invasive plants, self-organizing map, indicator species analysis
UDC581.9:58:63(510):574:630*7
target setting (Zhu et al., 2004) and invasive species management (Lososova et al., 2007; Statzner et al., 2007).
China is a vast country with rich biodiversity and regarded as a hotspot around the world (http://www. biodiversityhotspots.org/). however, it is also a very vulnerable country suffering from the ill effects of invasive species due to economic development (Ding et al., 2008). There is a long history of introduction of exotic species to China, especially those having economical benefits (Yan et al., 2001). however, negative feedbacks brought by exotic species have in recent decades been increasingly reported owing to global human activities and climate change. China is also a highly concerned nation (Yan et al., 2001; Ding et al., 2006; huang et al., 2008).
Understanding the functional grouping and distributional patterns of invasive species will be beneficial in establishing relevant controlling strate-gies and rapid assessment methods. In the present study, we apply two methods – self-organizing maps (SOM) and indicator species analysis (INDVAL) – to identify the functional groups of invasive plant species of China and select representative distribu-tional provinces.
MATeRIAL AND MeThODS Distribution data
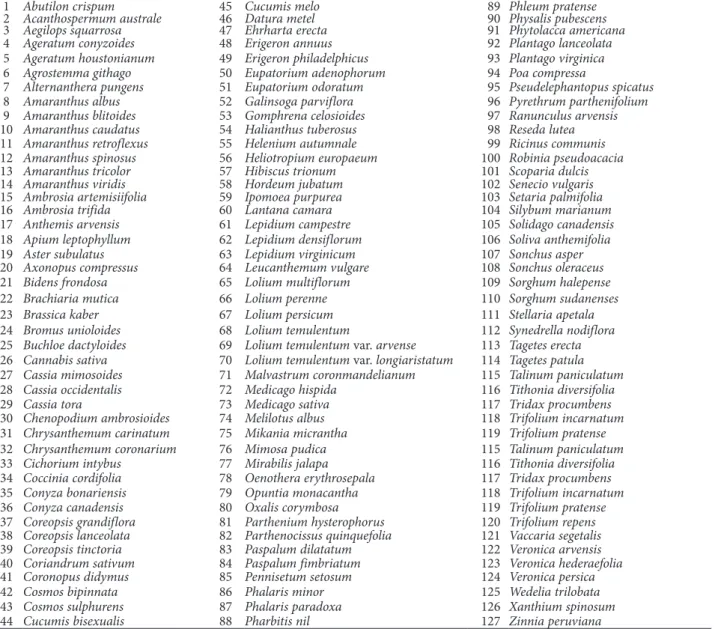
The provincial distributional information of 127 invasive plants of China was compiled from an online source (CSIS; China Species Information Service; http://www.chinabiodiversity.com/) and previously published papers (e.g., Yan et al., 2001; huang et al., 2008). Table 1 lists all the invasive plants and their corresponding numbers for subse-quent analysis.
Physiological traits
The following physiological traits have been men-tioned in previous works (e.g., Lososova et al., 2006, 2007; Lambdon et al., 2007; huang et al., 2008) as revealing the functional groups of invasive plants. For each attribute, its different states were quantita-tively encoded in a series of binary variables.
a) Life span: annual grass, perennial grass, liane, shrub, and arbor.
b) Invasive seriousness: common, middle, and strong.
c) Regions of origin: Americas, europe, Australasia, Asia, or Africa.
d) Introduction mode: accidental, human, fruit, ornamental, officinal, or pasture.
e) Propagation habitat: human-related areas, wild natural areas, or both.
f) Flowering season: spring, summer, autumn, win-ter, or all year.
g) Reproduction mode: seed or seed and vegetative. h) Suitable range size: provincial or national.
Functional grouping analysis
We used self-organizing maps to group all species based on their functional similarity. After obtaining the resulting map, a cluster analysis using euclidean distance was performed to identify the final func-tional groupings.
1. SOM model
Self-organizing maps represent an artificial neural network model (Kohonen, 1982) aiming to clas-sify high dimensional data, performing a non-linear projection of multidimensional data space onto two-dimensional space (Lek et al., 1996; Park et al., 2003a, 2003b). The SOM neural network consists of two layers of neurons: the input layer and the out-put layer. The outout-put layer is represented by a map or a rectangular gird with l x m neurons (or cells), laid out in a hexagonal lattice (Worner and Gevrey, 2006).
Laboratory of Information and Computer Science, helsinki University of Technology (http://www.cis. hut.fi/projects/somtoolbox/documentation/somalg. shtml). The geographic maps were generated by the software ArcView 3.2 (eSRI; http://www.esri.com/).
2. Cluster analysis
Sites that are neighbors on the grid are expected to be more similar to each other, whereas sites remote from each are expected to be distant in the feature space (Worner and Gevrey, 2006). To detect cluster boundaries on the map, cluster analysis was applied to the SOM model output (Park et al., 2003a, 2003b). hierarchical cluster analysis can give cluster bound-aries that are crisper than in the unified-matrix approach. A simple bootstrapping method was used to justify the choice of the number of clusters (hernandez et al., 2005).
Indicator species analysis
The indicator species analysis (INDVAL) meth-od aims to identify representative species which can characterize groups of samples (Dufrene and Legendre, 1997). This analysis was performed using the INDVAL for PC package (http://biodiversite. wallonie.be/outils/indval/home.html). herein we use INDVAL to select representative areas for each functional invasive group. Significance was calculat-ed using the method of computing the weightcalculat-ed dis-tance between randomized values and the observed value (t-test). The Monte Carlo test was run using 50000 random iterations and five seeds per random number generator. The significance level was set at P<0.05 (Casazza et al., 2008).
ReSULTS AND DISCUSSION
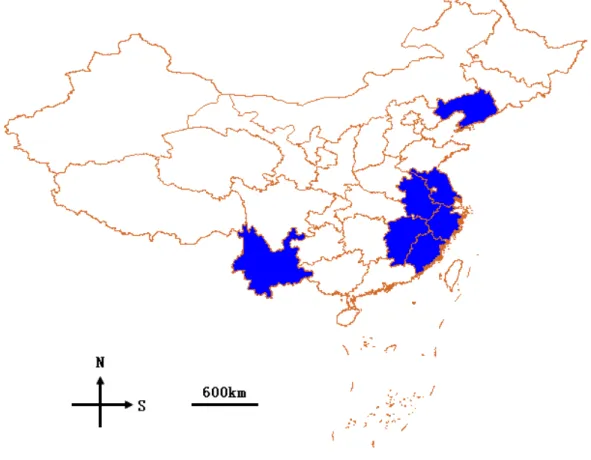
We ascertained that Jiangsu had the highest richness
out of 28 provinces, followed by Yunnan, Anhui, and Zhejiang. In contrast, Ningxia had the lowest rich-ness. ‘hotspot’ provinces containing more than 50 species include Jiangsu, Yunnan, Anhui, Zhejiang, Jiangxi, Fujian, and Liaoning. Most of these prov-inces are circumlittoral areas (Fig. 1).
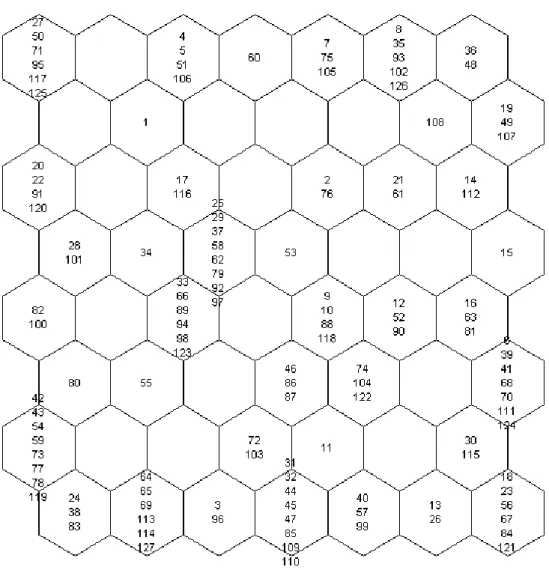
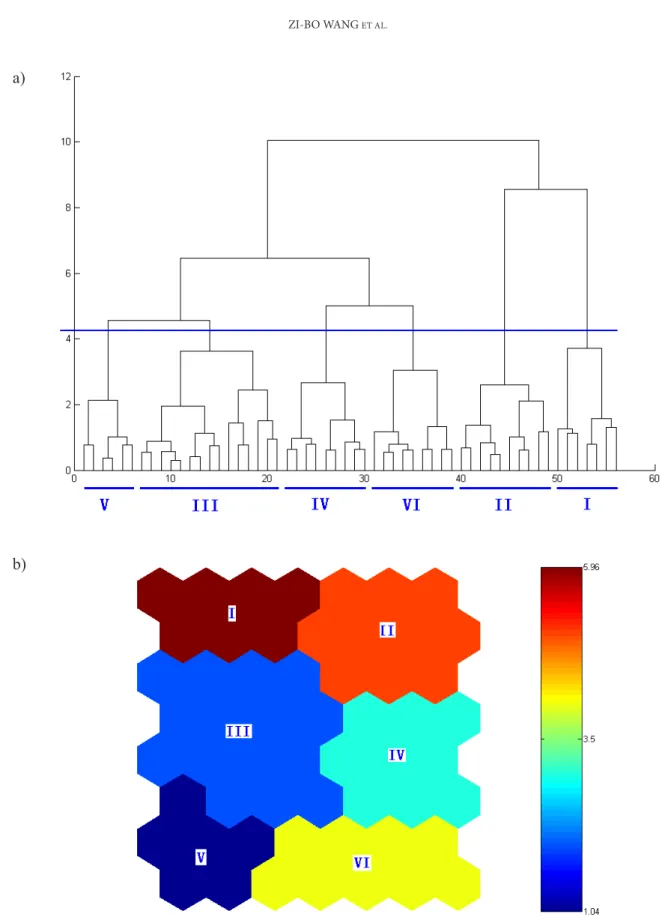
The initial SOM model grouped species in a grid cell system (8×7) according to their trait simi-larities (Fig. 2). After applying hierarchical cluster analysis on the basis of the initial SOM map (Fig. 3a), our study revealed six functional groups based on their biological traits (Fig. 3b). Indicator species analysis identified representative invaded provinces
for each functional group. Given below are detailed discussions of each group and relevant representa-tive areas.
Group I included 12 species, which mostly had the flowering season in winter and the seed and vegetative reproduction mode. The representative species were Abutilon crispum, Lantana camara, and Wedelia trilobata. The conducted INDVAL analysis demonstrated that this group is distributed in the southern part of China and does not occur in Northern China. Representative provinces hav-ing significant indicator values (InV) were Fujian (InV=17.9, P<0.05), Guangdong (InV=29.8, P<0.05),
1 Abutilon crispum 45 Cucumis melo 89 Phleum pratense
2 Acanthospermum australe 46 Datura metel 90 Physalis pubescens
3 Aegilops squarrosa 47 Ehrharta erecta 91 Phytolacca americana
4 Ageratum conyzoides 48 Erigeron annuus 92 Plantago lanceolata
5 Ageratum houstonianum 49 Erigeron philadelphicus 93 Plantago virginica
6 Agrostemma githago 50 Eupatorium adenophorum 94 Poa compressa
7 Alternanthera pungens 51 Eupatorium odoratum 95 Pseudelephantopus spicatus
8 Amaranthus albus 52 Galinsoga parviflora 96 Pyrethrum parthenifolium
9 Amaranthus blitoides 53 Gomphrena celosioides 97 Ranunculus arvensis
10 Amaranthus caudatus 54 Halianthus tuberosus 98 Reseda lutea
11 Amaranthus retroflexus 55 Helenium autumnale 99 Ricinus communis
12 Amaranthus spinosus 56 Heliotropium europaeum 100 Robinia pseudoacacia
13 Amaranthus tricolor 57 Hibiscus trionum 101 Scoparia dulcis
14 Amaranthus viridis 58 Hordeum jubatum 102 Senecio vulgaris
15 Ambrosia artemisiifolia 59 Ipomoea purpurea 103 Setaria palmifolia
16 Ambrosia trifida 60 Lantana camara 104 Silybum marianum
17 Anthemis arvensis 61 Lepidium campestre 105 Solidago canadensis
18 Apium leptophyllum 62 Lepidium densiflorum 106 Soliva anthemifolia
19 Aster subulatus 63 Lepidium virginicum 107 Sonchus asper
20 Axonopus compressus 64 Leucanthemum vulgare 108 Sonchus oleraceus
21 Bidens frondosa 65 Lolium multiflorum 109 Sorghum halepense
22 Brachiaria mutica 66 Lolium perenne 110 Sorghum sudanenses
23 Brassica kaber 67 Lolium persicum 111 Stellaria apetala
24 Bromus unioloides 68 Lolium temulentum 112 Synedrella nodiflora
25 Buchloe dactyloides 69 Lolium temulentum var. arvense 113 Tagetes erecta
26 Cannabis sativa 70 Lolium temulentum var. longiaristatum 114 Tagetes patula
27 Cassia mimosoides 71 Malvastrum coronmandelianum 115 Talinum paniculatum
28 Cassia occidentalis 72 Medicago hispida 116 Tithonia diversifolia
29 Cassia tora 73 Medicago sativa 117 Tridax procumbens
30 Chenopodium ambrosioides 74 Melilotus albus 118 Trifolium incarnatum
31 Chrysanthemum carinatum 75 Mikania micrantha 119 Trifolium pratense
32 Chrysanthemum coronarium 76 Mimosa pudica 115 Talinum paniculatum
33 Cichorium intybus 77 Mirabilis jalapa 116 Tithonia diversifolia
34 Coccinia cordifolia 78 Oenothera erythrosepala 117 Tridax procumbens
35 Conyza bonariensis 79 Opuntia monacantha 118 Trifolium incarnatum
36 Conyza canadensis 80 Oxalis corymbosa 119 Trifolium pratense
37 Coreopsis grandiflora 81 Parthenium hysterophorus 120 Trifolium repens
38 Coreopsis lanceolata 82 Parthenocissus quinquefolia 121 Vaccaria segetalis
39 Coreopsis tinctoria 83 Paspalum dilatatum 122 Veronica arvensis
40 Coriandrum sativum 84 Paspalum fimbriatum 123 Veronica hederaefolia
41 Coronopus didymus 85 Pennisetum setosum 124 Veronica persica
42 Cosmos bipinnata 86 Phalaris minor 125 Wedelia trilobata
43 Cosmos sulphurens 87 Phalaris paradoxa 126 Xanthium spinosum
44 Cucumis bisexualis 88 Pharbitis nil 127 Zinnia peruviana
Table 1. Latin names of 127 invasive species of China and associated numbers assigned to them for purposes of analysis.
Guangxi (InV=19.8, P<0.05), hainan (InV=24.8, P<0.05), and Taiwan (InV=20.8, P<0.05).
Group II was composed of 27 species. The life mode of most species in this group was the annual grass mode. This group has the flowering season in spring. Representative species were Axonopus compressus, Cassia tora, and Hordeum jubatum. The conducted INDVAL analysis indicated that this group has no biased geographic distribution and is homogeneously invasive throughout the whole
nation. No representative provinces were found. Group III consisted of 18 species, which are gen-erally distributed throughout the whole nation and have a range that is broader than for other groups. The typical species in this group were Mirabilis jala-pa, Talinum paniculatum, and Ipomoea purpurea. The representative areas selected by INDVAL analy-sis were Southwestern China, principally including Yunnan Province (InV=18.1, P<0.05).
Fig. 3. he inal six functional groups determined by hierarchical cluster analysis. a) he dendrogram generated by cluster analysis with the optimal cluster line using a bootstrapping technique. b) he corresponding SOM map (species occupying each cell can be identiied in Fig. 2).
a)
have a dispersal mode related to abiotic factors, for example, hydrochory or anemochory. Representative species were Erigeron annuus, Senecio vulgaris, and Amaranthus albus. Typical distribution provinces were mainly located in the western part of China, including two provinces: Inner Mongolia (InV=12.5, P<0.05) and Xizang (InV=12.9, P<0.05).
Group V consisted of 24 species, most of which have been documented by published reports to have strong invasiveness and to be dangerous for eco-systems. examples include Ambrosia artemisiifolia, Lepidium virginicum, and Agrostemma githago. The conducted INDVAL analysis demonstrated that this group has biased distribution in the northern part of China, principally in Jilin Province (InV=10.1, P<0.05).
Group VI was composed of 26 species gener-ally originating from African and Mediterranean regions. examples include Amaranthus retroflexus, Pennisetum setosum, and Sorghum halepense. As indicated by INDVAL, the typical distribution prov-ince was hunan (InV=15.9, P<0.05), representing the central part of China.
From the above analysis, we find that the SOM technique is a simple way to illustrate the asso-ciations of studied objectives through reducing the data dimensions. Its advantage is its ability to group objectives at a high speed compared to conventional cluster analysis. Thus, the SOM method is suitable for dealing with large data sets.
In our study, we not only ascertained functional groups of invasive species on the basis of their physi-ological traits, but also tried to understand the geo-graphic patterns of these groups. By implementing the INDVAL method, we can better understand the distributional biases of functional groups of China’s invasive plants. As far as we know, this represents the first attempt to combine SOM and INDVAL in application to distribution patterns of invasive spe-cies. In further studies including native species, the distributional overlapping and associated resource partition (Lambdon et al., 2007) between functional groups of exotic and native species could be com-pared using the methods introduced here.
ReFeReNCeS
Casazza, G., Zappa, E., Mariotti, M. G., Medail, F., and L. Minuto (2008). ecological and historical factors affecting distribution pattern and richness of endemic plant spe-cies: the case of the Maritime and Ligurian Alps hotspot.
Divers. Distrib. 14, 47-58.
Ding, J., Reardon, R., Wu, Y., Zheng, H., and W. Fu (2006). Biological control of invasive plants through collabora-tion between China and the United States of America: a perspective. Biol. Invasions8, 1439-1450.
Ding, J., Mack, R. N., Lu, L., Ren, M., and H. Huang (2008). China’s booming economy is sparking and accelerating biological invasions. BioScience 58, 317-324.
Dufrene, M., and P. Legendre (1997). Species assemblages and indicator species: the need for a flexible asymmetrical approach. Ecol. Monogr. 67, 345-366.
Fox, B. J., and J. Brown (1993). Assembly rules for functional groups in North American desert rodent communities.
Oikos 67, 358-370.
Gitay, H., and I. R. Noble (1997). What are functional types and how should we seek them? In: Plant Functional Types: Their Relevance to Ecosystem Properties and Global Change (eds. T. M. Smith, h. h. Shugart, and F. I. Woodward), 3-19. Cambridge University Press, Cambridge, UK.
Hernandez, C. E., Moreno, R. A., and N. Rozbaczylo (2005). Biogeographical patterns and Rapoport’s rule in south-eastern Pacific benthic polychaetes of the Chilean coast.
Ecography 28, 363-373.
Huang, Q. Q., Wu, J. M., Bai, Y. Y., Zhou, L., and G. X. Wang
(2008). Identifying the most noxious invasive plants in China: role of geographical origin, life form, and means of introduction. Biodivers. Conserv. DOI 10.1007/ s10531-008-9485-2.
Kohonen, T. (1982). Self-organized formation of topologically correct feature maps. Biol. Cybern. 43, 59-69.
Kohonen, T. (2001). Self-Organizing Maps. Springer, Berlin, Germany.
Lambdon, P. W., Lloret, F., and P. E. Hulme (2007). Do alien plants on Mediterranean islands tend to invade different niches occupied by native species? Biol. Invasions, DOI 10.1007/s10530-007-9163-4.
Lek, S., Delacoste, M., Baran, P., Dimopoulos, I., Lauga, J., and
S. Aulagnier (1996). Application of neural networks to modeling nonlinear relationships in ecology. Ecol. Model.90, 39-52.
Lloret, F., Medail, F., Brundu, G., Camarda, I., Moragues, E., Rita, J., Lambdon, P., and P. E. Hulme (2005). Species attributes and invasion success by alien plants on Mediterranean islands. J. Ecol. 93, 512-520.
european arable land. J. Biogeogr. DOI 10.1111/j.1365-2699.2007.01778.x.
Lososova, Z., Chytry, M., Kuhn, I., Hajek, O., Horakova, V., Pysek, P., and L. Tichy (2006). Patterns of plant traits in annual vegetation of man-made habitats in Central europe. Perspect. Plant Ecol. 8, 69-81.
Mathworks (2001). MATLAB, Version 6.5. The Mathworks, Natick, MA.
Park, Y. S., Cereghino, R., Compin, A., and S. Lek (2003a). Applications of artificial neural networks for patterning and predicting aquatic insect species richness in running waters. Ecol. Model. 160, 265-280.
Park, Y. S., Chang, J. B., Lek, S., Cao, W. X., and S. Brosse
(2003b). Conservation strategies for endemic fish species threatened by the Three Gorges Dam. Conserv. Biol. 17, 1748-1758.
Pimentel, D., Zuniga, R., and D. Morrison (2005). Update on the environmental and economic costs associated with alien-invasive species in the United States. Ecol. Econ.
52, 273-288.
Salmaso, N., and K. Padisak (2007). Morpho-functional groups and phytoplankton development in two deep lakes (Lake Garda, Italy and Lake Stechlin, Germany). Hydrobiologia
578, 97-112.
Statzner, B., Bonada, N., and S. Doledec (2007). Biological attributes discriminating invasive from native european stream macroinvertebrates. Biol. Invasions, DOI 10.1007/ s10530-007-9148-3.
Theoharides, K. A., and J. S. Dukes (2007). Plant invasion across space and time: factors affecting nonindigenous species success during four stages of invasion. New Phytol. 176, 256-273.
Usseglio-Ploatera, P., Bournaud, M., Richoux, P., and H. Tachet
(2000). Biological and ecological traits of benthic fresh-water macroinvertebrates: relationships and definition of groups with similar traits. Freshwater Biol. 43, 175-205.
Wilson, J. B. (1999). Guilds, functional types, and ecological groups. Oikos 86, 507-522.
Worner, S. P., and M. Gevrey (2006). Modelling global insect pest species assemblages to determine risk of invasion. J. Appl. Ecol. 43, 858-867.
Yan, X., Li, Z., Gregg, W. P., and D. Li (2001). Invasive species in China – an overview. Biodivers. Conserv. 10, 1317-1341.
Zhu, H., Qin, P., and H. Wang (2004). Functional group classifi-cation and target species selection for Yancheng Nature Reserve, China. Biodivers. Conserv. 13, 1335-1353.
ФУНКЦИОНАЛНО ГРУПИСАЊЕ И ТИПОВИ ДИСТРИБУЦИЈЕ ИНВАЗИВНИХ БИЉАКА У КИНИ ДОБИЈЕНИ МАПИРАЊЕМ И АНАЛИЗОМ ВРСТА ИНДИКАТОРА
ZI-BO WANG1, YOU-GANG CheN2 и YOU-hUA CheN1, 3
1School of Biology and Chemistry, Tianshui Normal College, Gansu Province, Кина 2Lianzhou Middle School, Guangxi Province, Кина
3College of Life Sciences, Wuhan University, hubei Province, Кина
У овој стдији коришћн с дв тник – самоорганизјћ мап (S��) и ана�иза врстаS��) и ана�иза врста индикатора (INDVAL), а са циљм размвања богатства инвазивни врста. За иднтификациј фнкциона�ни грпа најпр ј коришћна мтода S��, а потом INDVAL да би с иднтификова�а рпрзнтативна подрја која од�икј спомн-т фнкциона�н грп. Квантитативна својства и особности дистрибциј за 127 инвазивни биљака из 28 провинција Кин с искоришћни за