Extending the stability of red and blue colors of
malvidin-3-glucoside-lipophilic derivatives in the presence of SDS micelles.
Johan Mendoza,a Fernando Pina,a Nuno Basílio,a,* Marta Guimarães,b Victor de Freitasb and Luís Cruzb,*
*Corresponding authors: [email protected] (Nuno Basílio) and [email protected] (Luís Cruz).
aLAQV, REQUIMTE, Departamento de Química, Faculdade de Ciências e Tecnologia, Universidade
NOVA de Lisboa, 2829-516 Caparica, Portugal.
bREQUIMTE/LAQV, Departamento de Química e Bioquímica, Faculdade de Ciências, Universidade
do Porto, Rua do Campo Alegre, 687, 4169-007 Porto, Portugal.
Abstract
Anthocyanins lipophilization recently emerged as an efficient tool to deliver oil-soluble dyes aiming to expand their applications in lipophilic matrices such as cosmetics formulations. Sodium dodecyl sulfate (SDS) micelles were used to solubilize malvidin-3-glucoside derivatives bearing an ester chain derived from dodecanoic and hexanoic fatty acids. Detailed investigations on the kinetic and thermodynamic behavior of the pigments towards pH variations was carried out by means of UV-Vis spectroscopy. It was found that the pH domain of the red flavylium cation is extended in ca 0.3-0.4 pH units. The mole fraction of the quinoidal base at neutral conditions increased by 40% when compared with malvidin-3-glucoside in the same micellar media, which provides a great blue color stabilization. The results presented herein report for the first time the blue color stabilization of these lipophilic 1 2 3 4 5 6 7 8 9 10 11 12 13 14 15 16 17 18 19 20 21 22 23 24 25 26
anthocyanin bioactives, opening new application fields as novel colorants for lipid-based foods and cosmetics.
Introduction
Anthocyanins belong to the class of water-soluble polyphenols responsible for the coloration of many fruits and flowers found in nature [1]. Due to their appealing colors from red-orange to blue and health-promoting properties such as anti-proliferative, antioxidant activity and wound-healing among others [2-4], they are nowadays very attracting dyes for industrial applications namely as food colorants and more recently in cosmetic products. However, their pH-dependence color variation and hydrophilic character constitute a major drawback for applications mainly in lipophilic matrices. To overcome this solubility limitation, a series of anthocyanin-fatty acid conjugates with variable chain length from C4 to C16 (oil-soluble derivatives) have already been prepared [5]. Some of these novel compounds demonstrated already superior antioxidant activity and lipophilic properties rather than their anthocyanin precursors without altering their chromatic features [5, 6]. These promising results suggest that this kind of anthocyanin derivatives have great potential to be incorporated in cosmetic formulations. However, for future technological applications in cosmetics, it is very important to study the color stability of anthocyanins to pH change, since the attractive colors of the red and blue forms (flavylium cation and quinoidal base, respectively) of anthocyanins are normally unstable at moderate to neutral pH values. Despite the lack of solubility of these anthocyanin derivatives in pure water they can still be studied in aqueous solutions of sodium dodecyl sulphate (SDS) micelles, which also mimics a potential lipophilic formulation. Moreover, the fatty acid chain could allow co-micellization with SDS 27 28 29 30 31 32 33 34 35 36 37 38 39 40 41 42 43 44 45 46 47 48 49 50 51
because the fatty acid chain has affinity to the more hydrophobic core of the SDS micelles.
The use of SDS micelles to solubilize and extend the pH stability of colored forms of anthocyanins was reported previously [7, 8]. SDS micelles extend the pH domain of the red flavylium cation and increases the mole fraction distribution of the blue quinoidal base in moderately to neutral pH values up to 20%. Moreover, for anthocyanin concentrations of the order of magnitude of 10-4 M, negative cotton effects in the CD spectra have been observed and attributed to anthocyanin self-aggregation [9].
Experimental Reagents
A universal buffer of Theorell and Stenhagen [10] was made by dissolving 2.25 mL of phosphoric acid (85 % w/w), 7.00 g of monohydrated citric acid, 3.54 g of boric acid and 343 mL of NaOH 1M solution in millipore water until 1 L. Solutions were made using millipore water. All other chemicals were obtained from Sigma-Aldrich (Madrid, Spain). Malvidin-3-glucoside (mv3glc) extract was obtained from red wine isolation through the method described previously [6] and compounds 1 and 2 were obtained by enzymatic synthesis [5].
Kinetic and thermodynamic studies
Stock solutions of compounds 1 and 2 were prepared in aqueous SDS solution (0.1M) at pH = 3 (0.001 M HCl). The pH jumps were carried out by addition of NaOH (direct) or HCl (reverse) to equilibrated solutions of 1 or 2. The pH of the solutions was adjusted by addition of HCl, NaOH, or Theorell and Stenhagen’s universal buffer 52 53 54 55 56 57 58 59 60 61 62 63 64 65 66 67 68 69 70 71 72 73 74 75 76
and pH was measured in a Radiometer Copenhagen PHM240 pH/ion meter. UV-Vis absorption spectra were recorded in a Varian Cary 100 Bio or Varian Cary 5000 spectrophotometers. The stopped-flow experiments were conducted in an Applied Photophysics SX20 stopped-flow spectrometer provided with a PDA.1/UV photodiode array detector. All pKa values were determined from the absorbance versus pH experimental data. The observed rate constants were obtained fitting the absorbance versus time data to the integrated first order rate equation. The thermodynamic and kinetic results were globally fitted to the reported equations using the Solver tool in an Excel spreadsheet.
Results and Discussion
In moderately acidic solutions, both anthocyanins and synthetic flavylium salts give rise to a pH dependent multistate of four different chemical reactions involving five species (Scheme 1). At sufficiently acidic medium the system converges to the flavylium cation.
Scheme 1. Multistate of chemical species of the malvidin-3-glucoside. At sufficiently high proton
concentrations the system converges to the flavylium cation.
The most convenient way to study the kinetics and thermodynamics of the anthocyanin based multistate is to take equilibrated solutions of the flavylium cation at pH≤1 and add base (direct pH jumps) or start with equilibrated solutions at 77 78 79 80 81 82 83 84 85 86 87 88 89 90 91 92 93 94 95 96 97 98 99
moderately to neutral pHs and add acid (reverse pH jumps). Stopped flow is an indispensable tool to follow the fast kinetic processes (Scheme 2).
Scheme 2. Energy level diagram and kinetic steps of oenin [11].
The relative energy level diagram of the five species of the multistate can be easily constructed assuring that the four equilibrium constants of Scheme 1 have been calculated [12, 13]. After a direct pH jump, the acid-base equilibrium flavylium cation/quinoidal base is established during the mixing time of the stopped flow, eq. (1). In the next kinetic steps these two species are maintained in equilibrium.
k1d= ka+ k-a[H+] (1)
The second kinetic step corresponds to the hydration of the flavylium cation followed by the tautomerization. At the pH values reached after a direct pH jump, the former is much slower than the latter and by consequence it is the rate determining step, permitting to deduce eq.(2)
k2d= [H+] [H+]+ K a kh+ 1 1+ Ktk-h[H +] (2) 100 101 102 103 104 105 106 107 108 109 110 111 112 113 114 115 116 117 118 119 120 121 122
At this point, species AH+, A, B and Cc can be considered at equilibrium because the formation of Ct is much slower. A pseudo-equilibrium constant is defined eq.(3)
AH+ + H2O CB^ + H3O+ K^a=Ka + Kh+ KhK
t (3)
The system reaches the equilibrium through eq.(4)
k3d= KhKt
[H+]+ K^
a
ki+ k-i
(4) The final equilibrium is defined by eq.(5)
AH+ + H2O CB + H3O+ K’a=Ka + Kh+ KhKt + KhK
tKi (5)
In order to get all the rate and equilibrium constants of the system it is necessary to carry out reverse pH jumps. For sufficient acidic conditions the so called change of regime occurs. The hydration, which apparent rate constant is proportional to the proton concentration, becomes faster than tautomerization. In this case, A is immediately converted into AH+ during the mixing time of the acid, and a kinetic step due to the conversion of B into more AH+ is observed, eq.(6).
k2r = [H+] [H+]+ K
a
kh+ k-h[H+]
(6) Eq.(6) is different from eq.(2) due to the fact that there is no equilibrium between B and Cc. The system reaches the equilibrium at acidic pH from conversion of Cc into AH+, via B, eq.(7). There is no back reaction from B to give Cc, because as soon as B is formed it is rapidly transformed in AH+. The term kH-t accounts for the acidic catalysis of the tautomerization. The constant Kt can be evaluated from the ratio of the amplitudes of the slow and fast steps. In order to minimize the uncertainty in the constants a global fitting of all the data should be performed.
k3r = k-t+ k-tH[H+] (7) 123 124 125 126 127 128 129 130 131 132 133 134 135 136 137 138 139 140 141 142 143 144
In this work, the rate and equilibrium constants of the multistate of the two malvidin-3-glucoside-fatty acid conjugates (Scheme 3) in the presence of SDS micelles was completely characterized and compared with natural malvidin-3-glucoside and the effect of the co-micellization on the properties of the malvidin-3-glucoside multistate evaluated.
Scheme 3. Chemical structures of compound 1 and compound 2.
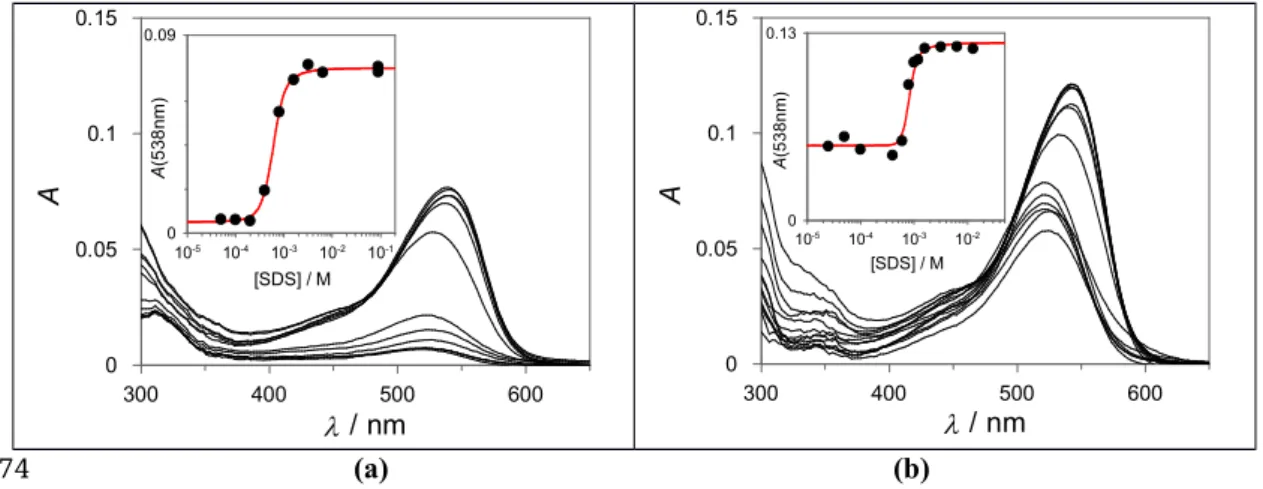
Both compounds 1 and 2 are sparingly soluble in water but readily solubilize in microheterogenous systems such as SDS micelles. The compounds were dissolved in methanol:water solution (9:1, 0.1 M HCl). Aliquots of this solution were placed in different vials, the solvent was allowed to evaporate under a gentle flow of nitrogen and aqueous solutions of SDS (containing HCl 0.1 M to stabilize the flavylium form) were added to the vials at different concentrations. The pigment was readily solubilized for SDS concentrations in the millimolar range while for more dilute surfactant solutions complete solubilization was not observed (even after sonication). After incubation in the dark at room temperature for 18 hours the absorption spectrum of the solutions (or supernatant in the case of partial solubilization) was registered (Figure 1). As seen from Figure 1, an abrupt increase in the absorption intensity is noticed at concentrations above 2x10⁻⁴ M of SDS. The CMC of SDS in the presence 145 146 147 148 149 150 151 152 153 154 155 156 157 158 159 160 161 162 163 164
of the dyes can be taken from the inflexion point of the absorption intensity (at 538 nm) versus SDS concentration plots. The obtained CMCs (7x10⁻⁴ M in the presence of compound 1 8x10⁻⁴ M for compound 2) are one order of magnitude lower than the value observed for SDS in the absence of pigment (CMC = 8x10⁻³ M), which can be attributed, at least in part, to the presence of 0.1 M HCl. It is known that electrolytes in the solutions decrease the CMC of ionic surfactants [14]. However, it is worth noting that the oppositely charged lipophilic pigments can also contribute to the formation of micelles at lower concentrations (co-micellization) [15].
/ nm 300 400 500 600 A 0 0.05 0.1 0.15 / nm 300 400 500 600 A 0 0.05 0.1 0.15 (a) (b)
Figure 1. Absorption spectra of (a) compound 1 (4.5x10⁻⁶ M for completely solubilized dye) and (b)
compound 2 (4.7x10⁻⁷ M for completely solubilized dye) in water at pH=1.0 with increasing
concentrations of SDS. The anthocyanin is not completely solubilized at low concentrations of SDS. An increase in the pigment solubility can be observed around the CMC of the surfactant.
Compounds 1 and 2 are completely solubilized in 0.1M of SDS (Figure 1). Thus, pH-dependent reaction networks of both compounds were completely characterized in this medium through pH jumps monitored by UV-Vis spectroscopy. Because similar results are observed for both compounds, the data for compound 1 is presented and discussed in the manuscript while the data for compound 2 is reported in the Supporting Information. The spectral variations observed by stopped flow taken 10
[SDS] / M 10-5 10-4 10-3 10-2 10-1 A (5 38 nm ) 0 0.09 [SDS] / M 10-5 10-4 10-3 10-2 A (5 3 8 n m ) 0 0.13 165 166 167 168 169 170 171 172 173 174 175 176 177 178 179 180 181 182 183 184 185
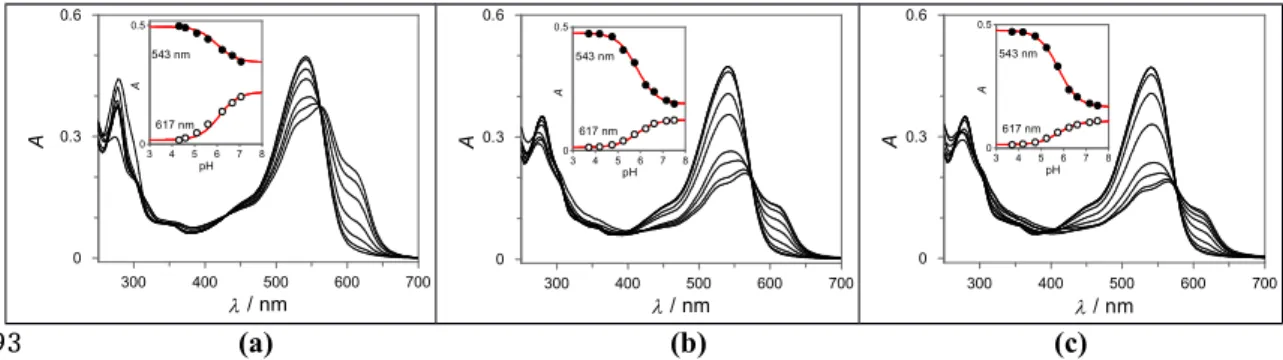
ms after a direct pH jump, are reported in Fig. 2(a). In this time scale no other process takes place and the flavylium cation (AH+) and the quinoidal base (A) are the only species formed, with pKa=6.0. The spectra reported in Fig. 2(a) evolve in the time scale of minutes to the pseudo-equilibrium due to the transformation of AH+/A in hemiketal (B) and cis-chalcone (Cc), Fig. 2(b), with pK^
a=5.75. Finally the
equilibrium is attained by formation of trans-chalcone (Ct), pK’a=5.65, Fig. 2(c).
/ nm 300 400 500 600 700 A 0 0.3 0.6 / nm 300 400 500 600 700 A 0 0.3 0.6 / nm 300 400 500 600 700 A 0 0.3 0.6 (a) (b) (c)
Figure 2. (a) Spectral variations of compound 1, 3.1x10⁻⁵ M in the presence of SDS micelles 0.1 M
taken 10 ms after a direct pH jump monitored by stopped flow pKa=6.0; (b) the same at the
pseudo-equilibrium pK^
a=5.75; (c) the same at the equilibrium pK’a=5.65.
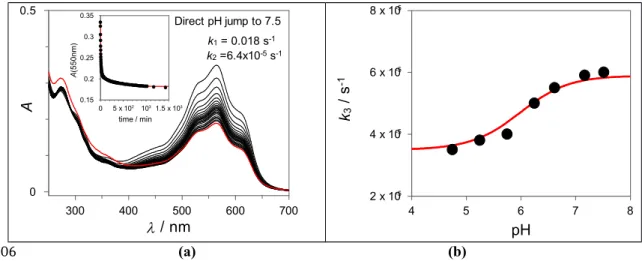
The kinetic process of the direct pH jumps is shown in Fig. 3, and illustrate the second and third kinetic processes described in the introduction. The initial absorbance is due to the quinoidal base formed during the mixing time of the base in the direct pH jump. The faster decay was fitted with eq.(2) (not shown) and is coherent with the data for the hydration reaction reported below for the reverse pH jumps. The slowest step was fitted with eq.(4) for the following parameters: KhKtki= 1.1x10⁻¹¹ Ms-1; pK^a=5.75; k-i=3.5x10⁻⁵ s-1. pH 3 4 5 6 7 8 A 0 0.5 543 nm 617 nm pH 3 4 5 6 7 8 A 0 0.5 543 nm 617 nm pH 3 4 5 6 7 8 A 0 0.5 543 nm 617 nm 186 187 188 189 190 191 192 193 194 195 196 197 198 199 200 201 202 203 204 205
/ nm 300 400 500 600 700 A 0 0.5 Direct pH jump to 7.5 k1 = 0.018 s-1 k2 =6.4x10⁻⁵ s-1 pH 4 5 6 7 8 k3 / s -1 -5 2 x 10 -5 4 x 10 -5 6 x 10 -5 8 x 10 (a) (b)
Figure 3. (a) Spectral variations after a direct pH jump to pH=7.5 of compound 1, 3.1x10⁻⁵ M in the
presence of SDS micelles 0.1 M; (b) Representation of the isomerization rate constants. Fitting was achieved with eq.(4) for KhKtki= 3.2x10⁻¹¹ Ms-1; pK^a=5.9; k-i=3.2x10⁻⁵ s-1.
A series of reverse pH jumps monitored by stopped flow from equilibrated solutions at pH=7.2 was carried out (Figure 4). Immediately after the addition of acid, all quinoidal base initially at pH=7.2 is rapidly converted in flavylium cation during the mixing time of the stopped flow experiment. The next kinetic step is the conversion of the hemiketal initially at pH=7.2 in flavylium cation, assuring that the pH is sufficiently low to make the hydration faster than tautomerization (change of regime), eq.(6) [16]. The equilibrium at acidic pH is reached by slower formation of more flavylium from Cc, through B, eq.(7).
/ nm 300 400 500 600 700 A 0 0.5 time / s 0 2 4 6 8 10 A(5 42 n m ) 0 0.5 A B Cc Kt = 0.45 khyd = 4.1 s-1 k-t = 0.53 s-1 pH 2 3 4 5 6 7 8 khyd / s -1 0 10 20 30 (a) (b) (c) time / min 0 5 x 10² 1031.5 x 103 A (5 5 0n m ) 0.15 0.2 0.25 0.3 0.35 pH 2 3 4 5 6 7 k-t / s -1 0 1 2 3 206 207 208 209 210 211 212 213 214 215 216 217 218 219 220 221
Figure 4. (a) Spectral variations of compound 1, 3.1x10⁻⁵ M in the presence of SDS micelles 0.1 M
upon a reverse pH jump from pH=7.2 to 4.2 monitored by stopped flow; (b) kinetic trace of the faster process at 542 nm. (c) representation of the rate constants of the faster process. Fitting was achieved with eq.(6) for pKa=5.95, kh=0.02 s-1 and k-h=4x10⁴ M-1s-1; inset: the same for the slowest process.
Fitting was achieved with eq.(7) for k-t=0.05 and k-tH= 4000 M-1s-1
Representation of the two rates as a function of pH is shown in Figure 4(c). The dehydration process was fitted by means of eq.(6) for pKa=6.0, kh=0.02 s-1 and k-h=4x10⁴ M-1s-1. The last and slowest kinetics, inset of Figure 4(c), was fitted with eq. (7) for k-t=0.016 and k-tH= 4000 M-1s-1. A global fitting using eq.(2), eq.(4), eq.(6) and eq.(7) leads to the equilibrium and rate constants reported in Table 1. Comparing the values reported in Table 1 with those reported for malvidin-3-glucoside in the absence of SDS micelles [11] (the fatty acid chain is not expected to influence the reactivity in a major extent) puts in evidence that the flavylium species is greatly stabilized in the presence of the anionic self-assembled aggregates as previously reported [7, 11]. This behavior can be attributed both to the anionic nature of micellar interface that establish attractive interactions with the cationic flavylium and to the increase in the local concentrations of H+ at the same interface (which increases the microscopic acidity of the micellar surface) [17]. The most remarkable differences in the kinetic parameters of Table 1 with respect to malvidin-3-glucoside in water is found for the hydration reaction. While kh is about 6 times lower in SDS micelles (0.02 vs 0.12 s-1) reflecting probably the stabilization of the flavylium cation with respect to the transition state, k-h is larger by 3 orders of magnitude in the micelles (4x10⁴ vs 35 M -1s-1). Thus, assuming the same transition state for hydration and de-hydration elemental reaction, it would be difficult to explain the observed difference only based on the destabilization of the hemiketal in SDS micelles. The most likely explanation
222 223 224 225 226 227 228 229 230 231 232 233 234 235 236 237 238 239 240 241 242 243 244 245 246 247
for this apparent k-h lies in a significant increase in the local concentration of H+ at the micelle surface which greatly differ from the bulk pH values used to obtain k-h and suggests that this effect dominates the stabilization of flavylium species in this medium.
Table 1. Equilibrium and rate constants of compound 1 and 2 obtained from pH jumps in the presence
of SDS 0.1 M.(a) Compound pK’a pKa pK^a Kh / M Kt Ki 1 5.65 6.0 5.75 5x10⁻⁷ 0.5 2 2 5.7 6.1 5.9 3.3x10⁻⁷ 0.6 4 Oenin [11] 2.3 3.8 2.4 3.4x10⁻³ 0.12 -kh / s−1 k−h / M−1 s−1 kt / s−1 k−t / s−1 ki / s−1 k−i / s−1 1 0.02 4x10⁴ 0.008 0.016 6.8 × 10⁻⁵ 3.5 × 10⁻⁵ 2 0.02 6x10⁴ 0.012 0.02 1.1 × 10⁻⁴ 2.9 × 10⁻⁵ Oenin [11] 0.12 35 0.06 0.5 -
-(a)Estimated error: 20%
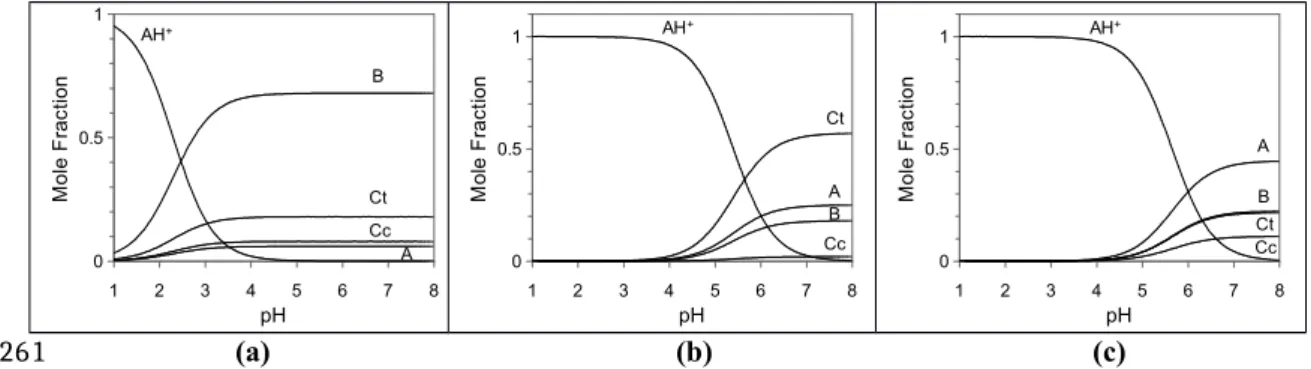
The mole fraction distribution of malvidin-3-glucoside 2x10⁻⁵ M in the absence of SDS micelles [11] (Figure 5a) is compared with malvidin-3-glucoside 2x10⁻⁵ M in the presence of SDS micelles 0.1 M (Figure 5b) and compound 1 in SDS micelles 0.1 M (Figure 5c). pH 1 2 3 4 5 6 7 8 M o le F ra ct io n 0 0.5 1 AH+ B A Ct Cc pH 1 2 3 4 5 6 7 8 M o le F ra ct io n 0 0.5 1 AH+ B A Ct Cc pH 1 2 3 4 5 6 7 8 M o le F ra ct io n 0 0.5 1 AH+ B A Ct Cc (a) (b) (c)
Figure 5. (a) Mole fraction distribution of oenin 2x10⁻⁵ M in the absence of SDS; (b) the same in the
presence of SDS 0.1 M; (c) compound 1, 2x10⁻⁵ M in the presence of SDS 0.1 M.
Figure 5 gives information about the interaction of the pigments with the micelles. SDS has a huge effect on the stabilization of the flavylium cation following the order 248 249 250 251 252 253 254 255 256 257 258 259 260 261 262 263 264 265 266
pK’a=2.3; 5.4 and 5.65 respectively for Figure 5 (a), (b) and (c). When malvidin-3-glucoside and compound 1 are compared there is a very significant increase of the quinoidal base (A) in the neutral region with the concomitant increase of the blue color. Attaching a fatty acid chain to the sugar of malvidin-3-glucoside allows to obtain co-micellization with SDS and increase the fraction of quinoidal base at moderately acidic and neutral conditions (Figure 6). Noteworthy, the apparent increase in the stability of the blue colored quinoidal base of compounds 1 and 2 does not arise from an improved stabilization of this species as the pKa is practically the same for oenin in SDS micelles (pKa = 6) [7, 8]. Conversely, the fatty acid chain does affect the stability of the quinoidal base with respect to the flavylium cation. As seen from Figure 5, the Ct species is more stable for oenin than for compounds 1 and 2 and thus the high stability of the quinoidal base arises from a decrease in the stability of the Ct for the lipophilic pigments.
Figure 6. Aqueous solutions of malvidin-3-glucoside (left) and malvidin-3-glucoside-dodecanoic acid
conjugate 1 (right) in SDS 0.1 M at pH 7.
This is a very interesting and new result since this is the first time that a significant stabilization of the blue quinoidal base at higher pH of an anthocyanin monoglucoside derivative is reported. This opens a new application window of anthocyanin derivatives presenting beautiful colors where neutral pH matrices are required. The 267 268 269 270 271 272 273 274 275 276 277 278 279 280 281 282 283 284 285 286 287 288
rate and equilibrium constants of compound 1 and 2 are similar, however, it seems that the longer chain (C12) gives more quinoidal base at the equilibrium (45%) compared with the shorter one (C6) (37%). This trend is coherent with the data of oenin in SDS micelles, where ca 25% of the quinoidal base is observed at the plateau. The present system illustrates the possibility of introducing a fatty chain to the pigments to allow co-micellization. This is a strategy that could be followed to confer color in several applications.
Acknowledgments
This research was supported by a research project grant (PTDC/QEQ-QFI/1971/2014) with financial support from FCT/MEC through national funds and co-financed by FEDER, under the Partnership Agreement PT2020 (UID/QUI/50006/2013 – POCI/01/0145/FEDER/007265). L.C. gratefully acknowledges the investigator contract (NORTE-01-0145-FEDER-000011). The Portuguese FCT/MEC is thanked for the award of a postdoctoral grant (SFRH/BPD/84805/2012) to N.B. The doctoral grant for J.M. was awarded by CONACYT (MEX/Ref. 288188).
ReferencesX
[1] Clifford MN. Anthocyanins - nature, occurrence and dietary burden. J Sci Food Agric. 2000;80(7):1063-72.
[2] Evora A, de Freitas V, Mateus N, Fernandes I. The effect of anthocyanins from red wine and blackberry on the integrity of a keratinocyte model using ECIS. Food Funct. 2017.
[3] Fernandes I, Faria A, Azevedo J, Soares S, Calhau C, De Freitas V, et al. Influence of Anthocyanins, Derivative Pigments and Other Catechol and Pyrogallol-Type Phenolics on Breast Cancer Cell Proliferation. J Agric Food Chem. 2010;58(6):3785-92.
[4] Fernandes I, Marques F, de Freitas V, Mateus N. Antioxidant and antiproliferative properties of methylated metabolites of anthocyanins. Food Chem. 2013;141(3):2923-33. 289 290 291 292 293 294 295 296 297 298 299 300 301 302 303 304 305 306 307 308 309 310 311 312 313 314 315 316 317 318 319
[5] Cruz L, Guimarães M, Araújo P, Évora A, de Freitas V, Mateus N. Malvidin 3-Glucoside–Fatty Acid Conjugates: From Hydrophilic toward Novel Lipophilic Derivatives. J Agric Food Chem. 2017;65(31):6513-8.
[6] Cruz L, Fernandes I, Guimaraes M, de Freitas V, Mateus N. Enzymatic synthesis, structural characterization and antioxidant capacity assessment of a new lipophilic malvidin-3-glucoside-oleic acid conjugate. Food Funct. 2016;7(6):2754-62.
[7] Lima JC, Vautier-Giongo C, Lopes A, Melo E, Quina FH, Macanita AL. Color stabilization of anthocyanins: Effect of SDS micelles on the acid-base and hydration kinetics of malvidin 3-glucoside (Oenin). J Phys Chem A. 2002;106(24):5851-9. [8] Mulinacci N, Romani A, Pinelli P, Gallori S, Giaccherini C, Vincieri FF. Stabilisation of natural anthocyanins by micellar systems. Int J Pharm. 2001;216(1-2):23-31.
[9] Pina F. Thermodynamic and Kinetic Processes of Anthocyanins and Related Compounds and their Bio-Inspired Applications. Recent Advances in Polyphenol Research: John Wiley & Sons, Ltd; 2014. p. 341-70.
[10] Küster WF, Thiel A. Tabelle per le analisi chimiche e chimico-fisiche. 12 ed.; Hoepli: Milano1982.
[11] Leydet Y, Gavara R, Petrov V, Diniz AM, Jorge Parola A, Lima JC, et al. The effect of self-aggregation on the determination of the kinetic and thermodynamic constants of the network of chemical reactions in 3-glucoside anthocyanins. Phytochemistry. 2012;83:125-35.
[12] Basilio N, Pina F. Chemistry and Photochemistry of Anthocyanins and Related Compounds: A Thermodynamic and Kinetic Approach. Molecules. 2016;21(11):25. [13] Pina F, Melo MJ, Maestri M, Ballardini R, Balzani V. Photochromism of 4'-methoxyflavylium perchlorate. A ''write-lock-read-unlock-erase'' molecular switching system. J Am Chem Soc. 1997;119(24):5556-61.
[14] Mukerjee P, Mysels K, Kapauan P. Counterion Specificity in the Formation of Ionic Micelles - Size, Hydration, and Hydrophobic Bonding Effects. The Journal of Physical Chemistry. 1967;71(13):4166-75.
[15] Al-Soufi W, Piñeiro L, Novo M. A model for monomer and micellar concentrations in surfactant solutions: Application to conductivity, NMR, diffusion, and surface tension data. J Colloid Interface Sci. 2012;370(1):102-10.
[16] Pina F. Anthocyanins and related compounds. Detecting the change of regime between rate control by hydration or by tautomerization. Dyes Pigm. 2014;102(0):308-14.
[17] Bunton CA, Nome F, Quina FH, Romsted LS. Ion binding and reactivity at charged aqueous interfaces. Acc Chem Res. 1991;24(12):357-64.
320 321 322 323 324 325 326 327 328 329 330 331 332 333 334 335 336 337 338 339 340 341 342 343 344 345 346 347 348 349 350 351 352 353 354 355 356 357