AMTD
7, 3159–3251, 2014AquaVIT-1 water vapor intercomparison
D. W. Fahey et al.
Title Page
Abstract Introduction
Conclusions References
Tables Figures
◭ ◮
◭ ◮
Back Close
Full Screen / Esc
Printer-friendly Version Interactive Discussion
Discussion
P
a
per
|
D
iscussion
P
a
per
|
Discussion
P
a
per
|
Discuss
ion
P
a
per
Atmos. Meas. Tech. Discuss., 7, 3159–3251, 2014 www.atmos-meas-tech-discuss.net/7/3159/2014/ doi:10.5194/amtd-7-3159-2014
© Author(s) 2014. CC Attribution 3.0 License.
Atmospheric Measurement
Techniques
Open Access
Discussions
This discussion paper is/has been under review for the journal Atmospheric Measurement Techniques (AMT). Please refer to the corresponding final paper in AMT if available.
The AquaVIT-1 intercomparison of
atmospheric water vapor measurement
techniques
D. W. Fahey1,2, R.-S. Gao1, O. Möhler3, H. Saathoff3, C. Schiller4,†, V. Ebert5,6,7, M. Krämer4, T. Peter8, N. Amarouche9, L. M. Avallone10,*, R. Bauer4, Z. Bozóki11, L. E. Christensen12, S. M. Davis1,2, G. Durry13, C. Dyroff14, R. L. Herman12, S. Hunsmann7, S. M. Khaykin15,***, P. Mackrodt5, J. Meyer4, J. B. Smith16, N. Spelten4, R. F. Troy12, H. Vömel1,2,**, S. Wagner4,6, and F. G. Wienhold8
1
National Oceanic and Atmospheric Administration, Earth System Research Laboratory, Boulder, CO, USA
2
Cooperative Institute for Research in Environmental Sciences, University of Colorado, Boulder, CO, USA
3
Karlsruhe Institute of Technology, Institute for Meteorology and Climate Research, Atmospheric Aerosol Research (IMK-AAF), Karlsruhe, Germany
4
Institute for Energy and Climate Research, Stratosphere (IEK-7), Forschungszentrum Jülich, Jülich, Germany
5
AMTD
7, 3159–3251, 2014AquaVIT-1 water vapor intercomparison
D. W. Fahey et al.
Title Page
Abstract Introduction
Conclusions References
Tables Figures
◭ ◮
◭ ◮
Back Close
Full Screen / Esc
Printer-friendly Version Interactive Discussion
Discussion
P
a
per
|
D
iscussion
P
a
per
|
Discussion
P
a
per
|
Discuss
ion
P
a
per
|
6
Physikalisch-Technische Bundesanstalt (PTB, National Metrology Institute of Germany), Bundesallee 100, Braunschweig, Germany
7
Technical University Darmstadt, Center of Smart Interfaces (CSI), Darmstadt, Germany 8
Institute for Atmospheric and Climate Science, ETH Zurich, 8092 Zurich, Switzerland 9
Division Technique de l’Institut National des Sciences de l’Univers, UPS 855 CNRS, Meudon, France
10
Department of Atmospheric and Oceanic Sciences, University of Colorado, Boulder, CO USA
11
MTA-SZTE Research Group on Photoacoustic Spectroscopy, University of Szeged, Szeged, Hungary
12
Jet Propulsion Laboratory, California Institute of Technology, Pasadena, CA, USA 13
Groupe de Spectrométrie Moléculaire et Atmosphérique, UMR CNRS 7331, Université de Reims-Champagne-Ardenne, Reims, France
14
Karlsruhe Institute of Technology (KIT), Institute for Meteorology and Climate Research, Atmospheric Trace Gases and Remote Sensing (IMK-ASF), Karlsruhe, Germany
15
Central Aerological Observatory, Moscow, Russia 16
School of Engineering and Applied Sciences, Harvard University, Cambridge, MA, USA *
now at: the National Science Foundation, Washington DC **
now at: Meteorologisches Observatorium Lindenberg, Lindenberg, Germany ***
now at: CNRS/INSU, LATMOS, IPSL, Université de Versailles St. Quentin, Guyancourt, France
†
deceased
Received: 5 January 2014 – Accepted: 6 February 2014 – Published: 1 April 2014
Correspondence to: D. W. Fahey ([email protected])
AMTD
7, 3159–3251, 2014AquaVIT-1 water vapor intercomparison
D. W. Fahey et al.
Title Page
Abstract Introduction
Conclusions References
Tables Figures
◭ ◮
◭ ◮
Back Close
Full Screen / Esc
Printer-friendly Version Interactive Discussion
Discussion
P
a
per
|
D
iscussion
P
a
per
|
Discussion
P
a
per
|
Discuss
ion
P
a
per
Abstract
The AquaVIT-1 Intercomparison of Atmospheric Water Vapor Measurement Tech-niques was conducted at the aerosol and cloud simulation chamber AIDA at the Karl-sruhe Institute of Technology, Germany, in October 2007. The overall objective was to intercompare state-of-the-art and prototype atmospheric hygrometers with each other
5
and with independent humidity standards under controlled conditions. This activity was conducted as a blind intercomparison with coordination by selected referees. The ef-fort was motivated by persistent discrepancies found in atmospheric measurements involving multiple instruments operating on research aircraft and balloon platforms, par-ticularly in the upper troposphere and lower stratosphere where water vapor reaches
10
its lowest atmospheric values (less than 10 ppm). With the AIDA chamber volume of 84 m3, multiple instruments analyzed air with a common water vapor mixing ratio, either by extracting air into instrument flow systems, locating instruments inside the chamber, or sampling the chamber volume optically. The intercomparison was successfully con-ducted over 10 days during which pressure, temperature, and mixing ratio were
sys-15
tematically varied (50 to 500 hPa, 185 to 243 K, and 0.3 to 152 ppm). In the absence of an accepted reference instrument, the reference value was taken to be the ensemble mean of a core subset of the measurements. For these core instruments, the agree-ment between 10 and 150 ppm of water vapor is considered good with variation about the reference value of about±10 % (±1σ). In the region of most interest between 1 and
20
10 ppm, the core subset agreement is fair with variation about the reference value of ±20 % (±1σ). The upper limit of precision was also derived for each instrument from the reported data. These results indicate that the core instruments, in general, have intrinsic skill to determine unknown water vapor mixing ratios with an accuracy of at least±20 %. The implication for atmospheric measurements is that the substantially
25
AMTD
7, 3159–3251, 2014AquaVIT-1 water vapor intercomparison
D. W. Fahey et al.
Title Page
Abstract Introduction
Conclusions References
Tables Figures
◭ ◮
◭ ◮
Back Close
Full Screen / Esc
Printer-friendly Version Interactive Discussion
Discussion
P
a
per
|
D
iscussion
P
a
per
|
Discussion
P
a
per
|
Discuss
ion
P
a
per
|
or other species that are focused on improving the analytical quality of atmospheric measurements on moving platforms.
1 Introduction
Water vapor is the most important greenhouse gas in the atmosphere, representing a major feedback to warming and other changes in the climate system (Trenberth
5
et al., 2007). Knowledge of the distribution of water vapor and how it is changing as cli-mate changes is especially important in the upper troposphere and lower stratosphere (UT/LS) where water vapor plays a critical role in determining atmospheric radiative balance, cirrus cloud formation, and photochemistry. Trends in UT/LS water vapor have the potential to alter surface radiative forcing (Solomon et al., 2010; Dessler, 2013). The
10
dehydration process reduces water vapor amounts to part per million (ppm) values in the tropical UT air before it enters the LS. Ice microphysics and cirrus cloud nucleation that characterize the dehydration process are not fully understood at present, limiting our ability to accurately model the dehydration process and, hence, our ability to fully describe the interaction of the UT/LS water vapor distribution with climate change.
15
Our understanding of water vapor processes in the UT/LS has been limited, in part, by large uncertainties in available water measurements. The 2000 SPARC Assess-ment of Upper Tropospheric and Stratospheric Water Vapor (SPARC, 2000) is the most recent comprehensive assessment of water vapor observations. It includes intercom-parisons of satellite, aircraft, balloon-borne, and ground-based water vapor
instrumen-20
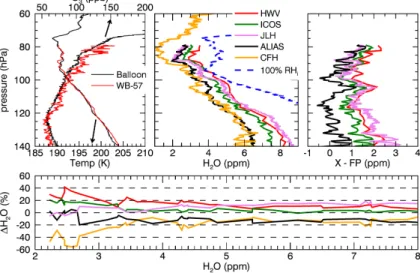
tation that show discrepancies in the critical range of 1 to 10 ppm. Since the SPARC report, discrepancies have remained between key datasets. An example of tropical profile measurements that reveal substantial disagreements is shown in Fig. 1 (Vömel et al., 2007a; Jensen et al., 2008; Weinstock et al., 2009; Rollins et al., 2014). One im-portant consequence of these systematic differences is that in some cases large values
25
AMTD
7, 3159–3251, 2014AquaVIT-1 water vapor intercomparison
D. W. Fahey et al.
Title Page
Abstract Introduction
Conclusions References
Tables Figures
◭ ◮
◭ ◮
Back Close
Full Screen / Esc
Printer-friendly Version Interactive Discussion
Discussion
P
a
per
|
D
iscussion
P
a
per
|
Discussion
P
a
per
|
Discuss
ion
P
a
per
based on our understanding of the fundamental microphysics of ice formation. In con-trast, in other aircraft and balloon measurements, liquid water supersaturation was not observed (Krämer et al., 2009).
The Intercomparison Campaign of Water Vapor Measurement Techniques (AquaVIT-1) was undertaken at the AIDA chamber at the Karlsruhe Institute of Technology (KIT)
5
as an effort to clarify uncertainties in UT/LS water vapor measurements and help iden-tify the cause(s) of the discrepancies such as instrument calibration and artifacts. The campaign did not include an evaluation of instrument sampling issues related to plat-form configuration, the ambient environment, or inlets, all of which can affect in-flight performance and inherently are more difficult to evaluate; nor an evaluation of
instru-10
ment calibration procedures.
AquaVIT-1 was a controlled, refereed, and blind intercomparison of a large group of water vapor instruments using the AIDA chamber. The ranges of pressure, tempera-ture and water vapor in the chamber included those found in the tropical UT/LS. The principal objective of AquaVIT-1 was to compare instruments in a controlled
ground-15
based facility with the expectation that systematic measurement problems and per-haps their causes could be identified more readily and with less expense and effort than in airborne campaigns. In addition, the campaign included instruments that were relatively new to atmospheric studies or still under development in order to acceler-ate their progress in becoming reliable and accuracceler-ate instruments for use in future field
20
measurement campaigns.
The AquaVIT-1 experiments were initially planned as part of a SPARC workshop on Upper Tropospheric Humidity in June 2007 (Peter et al., 2008) and subsequently occurred in two one-week phases in October 2007 in Karlsruhe, Germany. The first phase was devoted to static intercomparisons with a separate experiment each day
25
AMTD
7, 3159–3251, 2014AquaVIT-1 water vapor intercomparison
D. W. Fahey et al.
Title Page
Abstract Introduction
Conclusions References
Tables Figures
◭ ◮
◭ ◮
Back Close
Full Screen / Esc
Printer-friendly Version Interactive Discussion
Discussion
P
a
per
|
D
iscussion
P
a
per
|
Discussion
P
a
per
|
Discuss
ion
P
a
per
|
conditions and with or without ice clouds present. In this paper, only the static experi-ments and their results are described.
2 AIDA chamber
The Aerosol Interaction and Dynamics in the Atmosphere (AIDA) chamber is located at KIT. The chamber is an aluminum vessel of volume 84 m3 with facility to control
pres-5
sure from one atmosphere to as low as 0.01 hPa and temperature from 313 K to as low as 183 K (Möhler et al., 2003). This range of conditions allows for simulating atmo-spheric aerosol and cloud formation processes under tropoatmo-spheric and lower strato-spheric conditions on short (minutes) to long (hours) time scales. Important features of the AIDA chamber for AquaVIT-1 were, first, the operation of the chamber allowed for
10
conditions of near-constant pressure (±1 hPa) and temperature (±0.3 K). Under these conditions, water vapor amounts were constant or slowly changing for periods of many minutes, thereby allowing adequate time for all instruments to sample chamber air and make multiple determinations of water vapor content. Second, the water vapor mixing ratio and humidity could be altered by the addition of water vapor or dry air, or the partial
15
removal of chamber air by pumping. Third, the large chamber volume has a small wall-to-volume ratio and allows multiple instruments to be located inside the chamber or to sample air from outside the chamber without significantly disturbing internal conditions. To this end, customized, extractive sampling probes were implemented for AquaVIT-1 to deliver chamber air to instruments located outside the chamber. The probes were
20
made of stainless steel and heated to avoid water adsorption on the probe inner walls at low chamber temperatures.
3 Data protocol
All investigators signed the data protocol adopted for AquaVIT-1. The protocol encour-aged rapid assessment and use of the results from the AquaVIT-1 tests while upholding
AMTD
7, 3159–3251, 2014AquaVIT-1 water vapor intercomparison
D. W. Fahey et al.
Title Page
Abstract Introduction
Conclusions References
Tables Figures
◭ ◮
◭ ◮
Back Close
Full Screen / Esc
Printer-friendly Version Interactive Discussion
Discussion
P
a
per
|
D
iscussion
P
a
per
|
Discussion
P
a
per
|
Discuss
ion
P
a
per
the rights of the individual scientists and treating all participants equitably. Key features of the protocol are:
– Quick-look data. Preliminary or quick-look data obtained during the AquaVIT-1 campaign were made available to the referees as soon as possible following each day’s experiments (<24 h). In the event of obvious difficulties, this allowed the
5
referees to suggest corrections or amendments to data processing, instrument configuration, or instrument operation be made as soon as possible, thereby im-proving the overall outcome of the intercomparison. All water vapor mixing ratio values were archived as molar fractions in units of ppm (i.e., µmol mol−1) unless otherwise noted.
10
– Blind intercomparison. A blind intercomparison was established so that prelim-inary data submitted during the campaign (typically within 48 h) and the short evaluation period immediately following the campaign were available only to the referees (O. Möhler, D. W. Fahey, and R. S. Gao) who were not affiliated with any participating instrument team.
15
– Final data. After the end of the short evaluation period (4 December 2007) the submitted datasets were released to all participants. Any further changes to a sub-mitted dataset required documentation from an instrument’s investigator and ap-proval by the referees. All datasets were considered final on 10 January 2008.
A dedicated wikipage with password protection enabled archiving and interchange
20
of datasets among the participants and access to other AquaVIT-1 documents and information.
4 Instruments
AMTD
7, 3159–3251, 2014AquaVIT-1 water vapor intercomparison
D. W. Fahey et al.
Title Page
Abstract Introduction
Conclusions References
Tables Figures
◭ ◮
◭ ◮
Back Close
Full Screen / Esc
Printer-friendly Version Interactive Discussion
Discussion
P
a
per
|
D
iscussion
P
a
per
|
Discussion
P
a
per
|
Discuss
ion
P
a
per
|
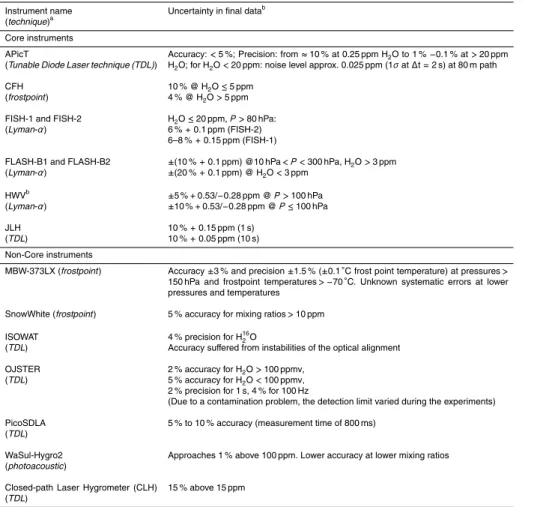
UT/LS water-vapor community. A subset of 15 instruments divided into core and non-core groups in Table 1 is the focus of this paper. This subset participated in the formal, blind, refereed intercomparison. The remaining instruments did not participate in the formal intercomparison or acquired insufficient science-quality data for analysis.
The core instrument subgroup includes APicT, CFH, FISH-1, FISH-2, FLASH-B1,
5
FLASH-B2, HWV, JLH (see Appendix A). The APicT, as an AIDA facility instrument, has been involved in many AIDA chamber experiments. The other instruments have a long history of field measurements and intercomparisons on balloon and aircraft plat-forms operating in the upper troposphere and stratosphere. The mixing ratio discrepan-cies noted at low values in these regions derive from a number of datasets from these
10
instruments. Establishing the accuracy of the core instruments under controlled labo-ratory conditions was one primary objective of AquaVIT-1. The reported uncertainty for each of the core instruments is listed in Table 2.
The non-core instrument subgroup includes MBW-373LX, SnowWhite, ISOWAT, OJSTER, PicoSDLA, WaSul-Hygro2 and CLH. This group includes mature instruments
15
that have also been used in field measurements as well as instruments that were in the initial to later stages of development.
Following extensive discussion among the organizers and investigators, the decision was made that no AquaVIT-1 instrument would serve as the reference instrument. No participating instrument had played this role previously for a multi-instrument
intercom-20
parison in a chamber configuration and no sufficiently objective and analytical basis could be developed by the group prior to or following the campaign to determine which instrument(s) would qualify as a reference. See Sect. 6.5 for further discussion of ref-erence choices.
The intercomparison results are expressed in units of water-vapor molar mixing ratio.
25
AMTD
7, 3159–3251, 2014AquaVIT-1 water vapor intercomparison
D. W. Fahey et al.
Title Page
Abstract Introduction
Conclusions References
Tables Figures
◭ ◮
◭ ◮
Back Close
Full Screen / Esc
Printer-friendly Version Interactive Discussion
Discussion
P
a
per
|
D
iscussion
P
a
per
|
Discussion
P
a
per
|
Discuss
ion
P
a
per
measurement techniques and is conserved in the atmosphere and within extractive in-strument systems (in the absence of the condensed phase). As a consequence, mixing ratio is a customary unit found in scientific interpretation and modeling studies.
Brief descriptions of the intercompared instruments, their configuration in the AIDA chamber, their performance during the static experiments and lessons learned from
5
AquaVIT-1 are included in Appendix A. Fundamental differences exist between the lab-oratory and flight environments (e.g., ambient pressure, temperature, flow rates, solar environment, and inlet sampling strategy) that generally represent some limit in the rel-evance of the laboratory results to instrument operation on moving platforms under am-bient conditions. The nature of these differences and their impact on the measurements
10
is different for each instrument. All flight instruments were modified or reconfigured to adapt to the laboratory setting, and in some cases, sources of error or uncertainty as-sociated with the laboratory implementation degraded instrument performance. While the AIDA configuration is not ideal in this regard, the value of a systematic laboratory in-tercomparison was clear in advance of AquaVIT-1 given the large discrepancies found
15
in field observations.
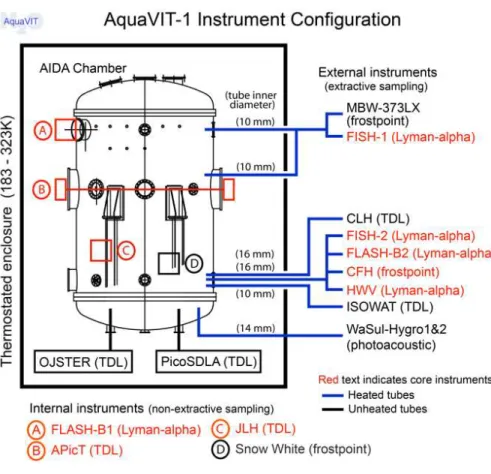
5 AIDA chamber instrument configuration
The overall configuration of instruments in the AIDA chamber facility is shown in Fig. 2. The instrument sampling techniques used in AquaVIT-1 can be classified into two dis-tinct types. The first type is extractive sampling, which requires gas to be removed
20
through a probe located inside the chamber that connects to a sample line that passes through the chamber and/or thermal enclosure walls. Most of the core instruments used extractive sampling with heated probes (Fig. 3). Three instruments were located outside the chamber but inside the chamber thermal enclosure.
The second type is internal or non-extractive sampling. Three core instruments and
25
AMTD
7, 3159–3251, 2014AquaVIT-1 water vapor intercomparison
D. W. Fahey et al.
Title Page
Abstract Introduction
Conclusions References
Tables Figures
◭ ◮
◭ ◮
Back Close
Full Screen / Esc
Printer-friendly Version Interactive Discussion
Discussion
P
a
per
|
D
iscussion
P
a
per
|
Discussion
P
a
per
|
Discuss
ion
P
a
per
|
a chamber window to measure Lyman-α fluorescence produced directly inside the chamber walls. Principal optical components of APicT and FLASH-B1 were mounted outside the chamber but inside the thermal enclosure. The JLH laser, detector, and open-path mirrors were mounted entirely inside the chamber (Fig. 3), as was the SnowWhite instrument sensor. For these two instruments, the associated control and
5
data recording electronics remained outside the thermal enclosure. The open-path white cell used by APicT was mounted completely inside the AIDA chamber. By folding its optical path between the inner chamber walls, APicT was the only instrument that provided a measurement of the water-vapor abundance averaged over the full diameter of the chamber.
10
6 AquaVIT-1 static experiments
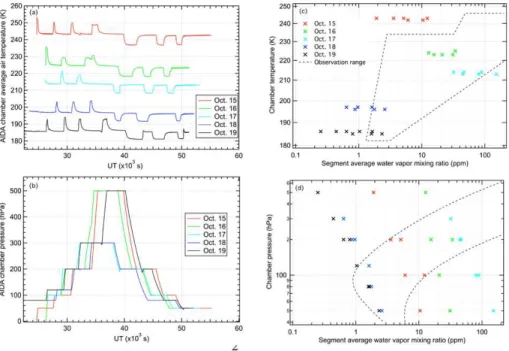
6.1 AIDA chamber conditions
The chamber pressures and temperatures for the static experiments are shown in Fig. 4. Also shown are the nominal domains from approximately a decade of HWV observations in the tropics and midlatitudes (Weinstock et al., 2009) that show
substan-15
tial overlap with the AquaVIT-1 experimental domains. In the experiments, temperature was reduced in daily steps from∼240 K on the first day to ∼185 K on the last day. The transient temperature changes in Fig. 4a are the quasi-adiabatic responses to the pressure changes in Fig. 4b that occur while the chamber walls and enclosure remain at a constant temperature. The reported value was stable to ±0.2 K (1σ) during the
20
measurement segments. Transient temperature excursions in the time series of up to 10 K are the adiabatic responses to the occasional rapid addition or removal of air from the chamber. Chamber pressure was held constant to ±1 hPa in 0.5–1 h intervals or segments (between 5 and 8) during each day. Water-vapor mixing ratio values varied depending on the amount of water added directly to the chamber at the beginning of
25
AMTD
7, 3159–3251, 2014AquaVIT-1 water vapor intercomparison
D. W. Fahey et al.
Title Page
Abstract Introduction
Conclusions References
Tables Figures
◭ ◮
◭ ◮
Back Close
Full Screen / Esc
Printer-friendly Version Interactive Discussion
Discussion
P
a
per
|
D
iscussion
P
a
per
|
Discussion
P
a
per
|
Discuss
ion
P
a
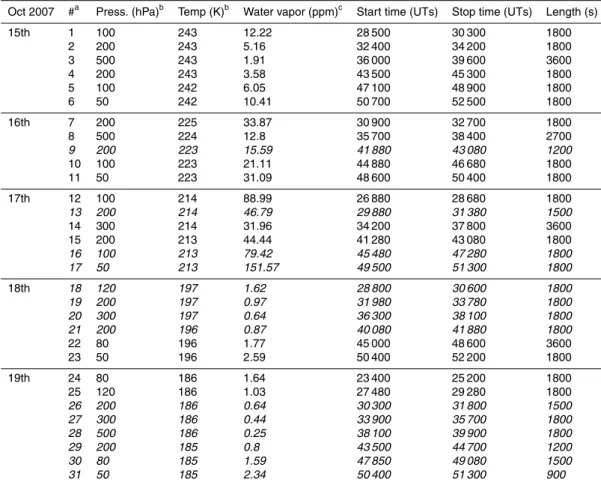
per
For the static intercomparisons, data segments were selected that provided nearly constant pressures and temperatures. Table 3 shows the average pressure, tempera-ture, and water-vapor mixing ratio values for the segments used in the accuracy and precision analyses presented below. During each segment, the total extractive sam-pling flow in the range 50 to 140 standard L min−1 depending on the instrument
con-5
figuration and chamber pressure corresponds to a removal of 0.05 to 0.16 % of the total chamber volume (84 m3) each minute. To maintain the AIDA pressure constant within±1 hPa a servo control system added dry air (<3 ppm H2O) as needed. During the static segments with constant pressure, the gas temperatures measured at various chamber locations deviated by less than 0.3 K from the average AIDA air
tempera-10
ture. A large vane-axial fan inside the chamber was used routinely to promote uniform mixing ratio and temperature conditions throughout the chamber (Möhler et al., 2003). With the use of the fan and extractive sampling points away from the chamber walls (Fig. 3), mixing ratio gradients are expected to be negligible for the purposes of this intercomparison.
15
Overnight between experiments the chamber was evacuated to less than 0.01 hPa. Each morning, an amount of pure water vapor (not disclosed to the instrument inves-tigator teams) was added to the chamber and then subsequently mixed with dry air as the pressure was increased stepwise to 500 hPa. The resulting water vapor mixing ratios in the static measurement segments varied from 0.2 to 150 ppm as shown in
20
Table 3. Values were kept below ice saturation except on the last two experiment days. In certain situations the gas-phase water-vapor mixing ratio is not conserved in the AIDA chamber. The first situation occurs when the water vapor mixing ratio of the syn-thetic air that is added for constant pressure regulation during sampling periods or for increasing the chamber total pressure differs from the water vapor mixing ratio present
25
AMTD
7, 3159–3251, 2014AquaVIT-1 water vapor intercomparison
D. W. Fahey et al.
Title Page
Abstract Introduction
Conclusions References
Tables Figures
◭ ◮
◭ ◮
Back Close
Full Screen / Esc
Printer-friendly Version Interactive Discussion
Discussion
P
a
per
|
D
iscussion
P
a
per
|
Discussion
P
a
per
|
Discuss
ion
P
a
per
|
at saturation values. Non-conservation was also observed to a lesser extent in the ice-free static experiments due to the adsorption and desorption of water on the walls and other chamber internal components. Examples of this are shown by the time series in Fig. 5 in which the water vapor mixing ratio increases when the chamber pressure is re-duced in the second half of the day’s experiment. If there are no other sources of water
5
vapor then the mixing ratio should remain constant as air is pumped from the chamber. However, non-conservation of water vapor does not interfere fundamentally with the AquaVIT-1 results because the water vapor mixing ratios always changed slowly with time within an intercomparison segment and the stirring fan forced complete internal mixing within about 1 min (see discussion below).
10
6.2 Data processing
For each day of the static experiment series, the instrument teams submitted a data file reporting water vapor mixing ratios vs. UT time. The measurement interval for most instruments was 1 s. As an example, the 1 s datasets for 15 October are plotted in Fig. 5.
15
The data processing steps taken for the combined dataset were the following:
a. Define segments. The time series were divided into constant pressure and near constant temperature segments for statistical analysis. Not all segments were used in the intercomparison analysis. The criteria for selecting a segment were near-constant or slowly and linearly varying water vapor mixing ratios within the
20
segment and the availability of water vapor data for the segment from a majority of the core instruments. The first criterion ensured uniform mixing ratio condi-tions in the chamber and, hence, each sample line. Data gaps between segments generally correspond to rapidly changing chamber pressure (Fig. 4). Constant or linearly varying water vapor values in a segment were also required for the
pre-25
AMTD
7, 3159–3251, 2014AquaVIT-1 water vapor intercomparison
D. W. Fahey et al.
Title Page
Abstract Introduction
Conclusions References
Tables Figures
◭ ◮
◭ ◮
Back Close
Full Screen / Esc
Printer-friendly Version Interactive Discussion
Discussion
P
a
per
|
D
iscussion
P
a
per
|
Discussion
P
a
per
|
Discuss
ion
P
a
per
The times and lengths of the segments used in the analysis along with average pressure, temperature, and water-vapor mixing ratios are provided in Table 3.
b. Calculate linear fits for each instrument segment. Core-instrument linear fits to water vapor mixing ratios as a function of time were calculated from the respective time series data for each segment, thereby defining the mean values and their
5
rates of change.
c. Calculate reference water vapor mixing ratios. The reference water-vapor mixing ratio for each segment was obtained using only the core instrument data. The exception was that data from the FLASH instruments were excluded because of offsets discovered during the data evaluation (see Appendix). A two-step
pro-10
cess was adopted to provide a consistent basis of comparison across and within segments. First, a single linear fit was performed on the complete set of core-instrument linear fits. This combined fit was chosen over a simple unweighted average of all core instrument data in order to give the same weight to each core instrument in deriving the reference value. This combined fit defines the reference
15
function for the segment, which in turn defines the time evolution of values within the segment. Second, the reference water-vapor mixing ratio for the segment was defined to be the average of the reference function over the segment. These ref-erence mixing ratios as listed in Table 3 are used throughout the analysis and plots presented here. Note that the number of instruments reporting data for each
20
segment generally influences the reference value. Also note that it would be incor-rect to use the reference values to infer the absolute accuracy of any instrument averages (see Sect. 6.5).
d. Calculate 1 s probability distribution functions (PDFs) for each segment. For each instrument the differences between the instrument time series of 1 s mixing ratios
25
AMTD
7, 3159–3251, 2014AquaVIT-1 water vapor intercomparison
D. W. Fahey et al.
Title Page
Abstract Introduction
Conclusions References
Tables Figures
◭ ◮
◭ ◮
Back Close
Full Screen / Esc
Printer-friendly Version Interactive Discussion
Discussion
P
a
per
|
D
iscussion
P
a
per
|
Discussion
P
a
per
|
Discuss
ion
P
a
per
|
segment. These values appear for each instrument segment as separate symbols in Figs. 6 and 7.
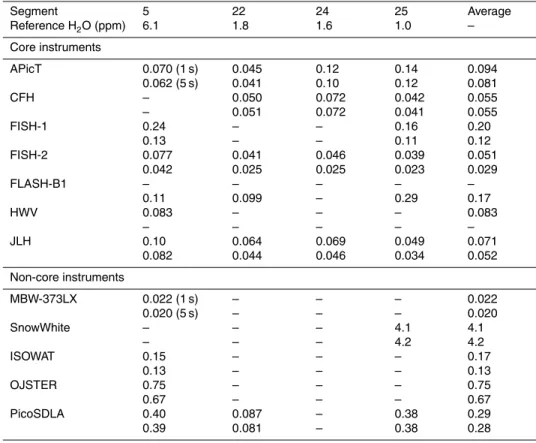
e. Calculate instrument precision. The standard deviation (±1σ) of each Gaussian fit to differences from the reference function is defined to be the instrument preci-sion for a segment. Values represent an upper limit sinceσ includes error in the
5
reference function and non-linear variation of water vapor in the chamber over the segment period. Examples of instrument precision values are shown in Table 4 for core and non-core instruments.
6.3 Core instrument results
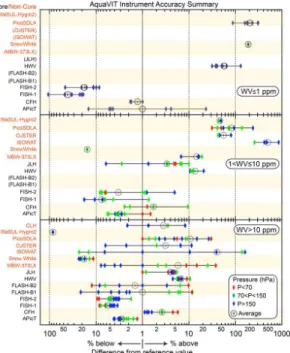
6.3.1 Reference value comparisons 10
A summary of the instrument intercomparison results for the 5 day static experiment series is shown in the plots in Figs. 6 and 7. The symbols represent the average difference within a segment from the reference water vapor value for that segment. Summary points for the core instruments are:
– 10–150 ppm H2O: good agreement occurs in this range. Except for a few
seg-15
ments, all the segment values and the all-segment averages (circle/plus symbols in Fig. 6) for each instrument agree with the reference within±10 %. The FLASH-B instrument shows the greatest segment-to-segment variability and the largest differences due to experimental setup issues described in Appendix A4. The in-struments other than FLASH-B(1)/B(2) show a small segment-to-segment
vari-20
ability (∼5 %) indicating good instrument stability and systematic uncertainties that are constant throughout these experiments. There is some tendency of the largest differences to occur for the lowest pressure range (<70 hPa).
– 1≤H2O≤10 ppm: fair agreement occurs in this range. All the segment values
and the all-segment averages for each instrument agree with the reference within
AMTD
7, 3159–3251, 2014AquaVIT-1 water vapor intercomparison
D. W. Fahey et al.
Title Page
Abstract Introduction
Conclusions References
Tables Figures
◭ ◮
◭ ◮
Back Close
Full Screen / Esc
Printer-friendly Version Interactive Discussion
Discussion
P
a
per
|
D
iscussion
P
a
per
|
Discussion
P
a
per
|
Discuss
ion
P
a
per
about ±20 %. The segment-to-segment variability for each instrument is about 10 % or greater indicating, in comparison to the results for 10–150 ppm H2O,
in-strument stability issues and systematic uncertainties that are more important.
– 0.2≤H2O≤1 ppm: poor agreement occurs in this range. Fewer instruments re-ported data for these segments than for the other two mixing ratio ranges. In this
5
range more so than in the two higher ranges, the reference value is influenced more strongly by the FISH results since the FISH-1 and FISH-2 data are essen-tially equal and fewer instruments contribute to the reference value calculation. All core instrument segment values agree with the reference and with each other within a range of about −100 % to +150 % with absolute differences less than
10
0.4 ppm. All segments have pressures>150 hPa. Although mixing ratios in this range occur rarely in the UT/LS, these measurements help define the detection limits and performance limits of the instruments.
6.3.2 Uncertainties
The uncertainties of the core instruments as provided by the investigators are listed
15
in Table 2 and further documented in Appendix A. Since no absolute reference value was established for AquaVIT-1, no independent conclusion can be drawn concerning whether the individual uncertainty ranges include the correct value for each segment. Since the core instrument uncertainties are derived with independent calibration pro-cedures, there is an expectation of agreement within the combined uncertainties of the
20
measurements. With the accuracy values given in Table 2 and data in Fig. 7, agree-ment can be expected within ±20 % for the 1–150 ppm range and about ±100 % for values<1 ppm.
The precision upper limits calculated for the core instrument measurements for sev-eral example segments are shown in Table 4. PDFs of FISH-2 data for all segments are
25
AMTD
7, 3159–3251, 2014AquaVIT-1 water vapor intercomparison
D. W. Fahey et al.
Title Page
Abstract Introduction
Conclusions References
Tables Figures
◭ ◮
◭ ◮
Back Close
Full Screen / Esc
Printer-friendly Version Interactive Discussion
Discussion
P
a
per
|
D
iscussion
P
a
per
|
Discussion
P
a
per
|
Discuss
ion
P
a
per
|
measurements and treatment of the raw data. Most of the segment PDFs show a good Gaussian fit indicating good stochastic behavior of the detection module in each instru-ment. The magnitude of the precision limits is typically in the range of 0.1 to 0.2 ppm, which suggests that the 1 s measurement precision is not a large component of the uncertainty in the 1–150 ppm range when averaging over segment lengths of 1800–
5
3600 s. A comparison of precision derived from 1 s and 5 s time series measurements is also shown in Table 4. If the measurement variability is truly random, then the PDF of 5 s measurements should be a factor of 50.5=2.2 smaller than the 1 s precision values. Table 4 shows that this is not the case for most of the core and non-core instruments. The largest ratios of about 1.7 are found for the FISH instruments. This suggests that
10
the measurement variability is not completely random on the 1 to 5 s timescale for most of the instruments and may contain significant contributions from instrument drift and varying conditions of instrument components. Rollins et al. (2014) further discuss pre-cision and accuracy issues related to a suite of water vapor instruments that includes some AquaVIT-1 core instruments.
15
6.4 Non-core instrument results
Figure 6 includes results for the non-core instruments for the same segments. Non-core results do not influence the segment reference values as discussed above. Summary points for these results are:
– 10–150 ppm H2O: the best overall agreement with the core reference values
oc-20
curs in this range. Segment differences show a wider range than core instru-ments, varying from about−100 % to+200 % with most of the data falling within the−30 % to+50 % range. Instrument averages also show a wider range, varying from about−90 % to+40 %.
– 1 ≤H2O≤10 ppm: poorer agreement with the core reference values occurs in
25
AMTD
7, 3159–3251, 2014AquaVIT-1 water vapor intercomparison
D. W. Fahey et al.
Title Page
Abstract Introduction
Conclusions References
Tables Figures
◭ ◮
◭ ◮
Back Close
Full Screen / Esc
Printer-friendly Version Interactive Discussion
Discussion
P
a
per
|
D
iscussion
P
a
per
|
Discussion
P
a
per
|
Discuss
ion
P
a
per
varying from about−20 % to +1000 % with most instruments significantly higher than the reference value.
– 0.2≤H2O≤1 ppm: the poorest agreement with the core reference values occurs
in this range as also found for the core instruments. Only two instruments submit-ted data for these low values. The results are 90–300 % higher than the reference
5
value.
6.5 Absolute reference values
The ensemble average of the core instrument values was used as the reference value in the intercomparison in lieu of designating a single instrument as the reference. How-ever, three AquaVIT-1 instruments have special merit in serving as absolute reference
10
standards: the KIT MBW-373LX, APicT, and the German PTB water vapor permeation source (PTB-WVPS). The first and last have direct links to international, metrological primary standards. APicT evaluations show that its values are very consistent with ice saturation values expected in AIDA chamber ice-cloud measurements.
The MBW-373LX is a chilled-mirror frostpoint hygrometer from MBW Calibration Ltd.
15
in Switzerland (http://www.mbw.ch) that is used regularly in the AIDA facility (Appendix A7). The unit has a frost-point accuracy of±0.1 K (corresponding to less than±2 % in water vapor mixing ratio) according to the manufacturer’s calibration, which is linked to international standards. The KIT MBW-373LX unfortunately was not configured to oper-ate with sample line pressures less than 500 hPa or sample flows below 0.2 L min−1and
20
thus could not be suitably intercompared in AquaVIT-1 for all conditions (Appendix A7). Near 1000 hPa, however, the KIT MBW hygrometer has intercompared well with the APicT in many previous AIDA experiments.
APicT values, derived from in-situ absorption profiles, are only based on H2O spec-tral data (taken from the HITRAN2008 data base and from PCI/KIT reference
mea-25
AMTD
7, 3159–3251, 2014AquaVIT-1 water vapor intercomparison
D. W. Fahey et al.
Title Page
Abstract Introduction
Conclusions References
Tables Figures
◭ ◮
◭ ◮
Back Close
Full Screen / Esc
Printer-friendly Version Interactive Discussion
Discussion
P
a
per
|
D
iscussion
P
a
per
|
Discussion
P
a
per
|
Discuss
ion
P
a
per
|
in-field calibration procedures (i.e., a direct comparison to a reference H2O instrument or generator). As an absolute performance check, APicT water vapor mixing ratios were compared to equilibrium ice-saturation values during the AquaVIT-1 dynamic experi-ments. During these experiments, dense ice clouds were present in the AIDA chamber under almost constant pressure and temperature conditions. As a consequence, the
5
water vapor mixing ratios inside the chamber can be assumed to be ice-saturation values at the respective gas temperatures. Within estimated uncertainty limits of about 5 %, APicT values agreed with the expected ice-saturation values (see Appendix A1.1), thereby validating APicT measurement accuracy.
The PTB-WVPS was provided to the AquaVIT-1 team during the experiment period
10
by PTB Braunschweig, Germany (Appendix A14). The source was calibrated to the German national, primary humidity standard (coloumetric) (Mackrodt, 2012; Brewer et al., 2011) over a mixing ratio range of 0.5 to 5 ppm. The total expanded relative uncertainty (k=2) of the PTB-WVPS is 2 %. The source output flow was sampled by the CFH and MBW-373LX instruments, and the FISH MBW-DP30 unit, which all
15
reported differences less than±5 %.
The combination of these additional intercomparisons adds substantial confidence that the core-ensemble reference value is accurate to±5 %.
7 Atmospheric implications of the AquaVIT-1 static experiment results
The AquaVIT-1 results have implications for atmospheric measurements of water vapor
20
made by the core instruments in the UT/LS region. The experiment mixing ratio values spanned the range of <1–150 ppm, which is highly relevant for the tropical UT/LS where dehydration processes produce the lowest mixing ratios generally observed in the atmosphere. The core instrument results showed agreement in the key 1–10 ppm range within about±20 %. Part of the motivation for AquaVIT-1 was to provide an
ex-25
AMTD
7, 3159–3251, 2014AquaVIT-1 water vapor intercomparison
D. W. Fahey et al.
Title Page
Abstract Introduction
Conclusions References
Tables Figures
◭ ◮
◭ ◮
Back Close
Full Screen / Esc
Printer-friendly Version Interactive Discussion
Discussion
P
a
per
|
D
iscussion
P
a
per
|
Discussion
P
a
per
|
Discuss
ion
P
a
per
Peter et al., 2006). In some cases, these discrepancies are large enough (50–100 %) to interfere with answering important scientific questions about water vapor in the UT/LS. An example of differences associated with core instruments is shown in Fig. 1. An im-portant conclusion from AquaVIT-1 is that such differences as observed in the airborne field studies are significantly larger than those found for CFH and HWV in this
labora-5
tory study. However, the qualitative differences are similar, with CFH values less than HWV values. Further conclusions may follow from a systematic assessment of the field observations by instrument investigators that takes into account the AquaVIT-1 results. Caution must be taken in using these results to infer instrument performance on mov-ing platforms (e.g., balloons and aircraft) because AquaVIT-1 did not fully reproduce
10
UT/LS instrument or sampling conditions for the diverse set of instruments involved, nor could it be expected to. Some instruments were modified from their flight config-uration in order to adapt to the laboratory setting (see Appendix A). For those instru-ments mounted outside the AIDA chamber, environmental pressures and/or temper-atures were generally significantly higher than typically encountered in UT/LS flights.
15
Similarly, sample flows internal to the instruments were in some cases significantly lower than in flight and were often at higher temperatures than those encountered in the UT/LS. A closer simulation of external and internal pressures and temperatures oc-curred for JLH and SnowWhite because both were located inside the chamber. How-ever, sample-volume flow rates that occur in flight for these two instruments (aircraft
20
and balloon, respectively) were not well simulated in the chamber tests because of the limited stirring of chamber air. There are potentially other factors that influence in-flight performance in the UT/LS that did not influence the AquaVIT-1 experiments, such as rapid changes in mixing ratio, pressure and temperature. These effects will need to be carefully evaluated to make appropriate and optimal use of the results presented here.
25
8 Summary of the AquaVIT-1 experiments
AMTD
7, 3159–3251, 2014AquaVIT-1 water vapor intercomparison
D. W. Fahey et al.
Title Page
Abstract Introduction
Conclusions References
Tables Figures
◭ ◮
◭ ◮
Back Close
Full Screen / Esc
Printer-friendly Version Interactive Discussion
Discussion
P
a
per
|
D
iscussion
P
a
per
|
Discussion
P
a
per
|
Discuss
ion
P
a
per
|
– AquaVIT-1 successfully integrated a variety of instruments to measure water va-por in the AIDA chamber using extractive and non-extractive sampling methods. The scientific and technical participant group developed procedures and protocols to carry out the physical experiments and post-experiment data processing and analysis. For five days in October 2007, static experiments were conducted with
5
chamber conditions covering a range of pressures (50–500 hPa), temperatures (185–243 K) and water vapor mixing ratios (<1–150 ppm) in order to simulate conditions typically found in the UT/LS.
– The subset of the instruments examined here was divided into two categories: core and non-core instruments. Core instruments have been extensively used in
10
field campaigns on moving platforms and some participated in campaigns, partic-ularly in the tropics, that revealed large systematic discrepancies in the UT/LS.
– Time series of water vapor mixing ratios from the core and non-core instrument were divided into 31 segments of 900–3600 s duration for analysis. The intercom-parison was based on reference values derived for each segment using linear fits
15
to the core instrument data.
– The core instrument values are in fair to good agreement in the 1–150 ppm H2O range with instrument averages over all segments agreeing within about±20 %. For individual segments, agreement is generally found to be close or within the combined uncertainties for any instrument pair. Below 1 ppm H2O, fewer
instru-20
ments reported data and overall agreement is poorer.
– The non-core instrument group included mature instruments and newly developed prototypes. This group demonstrated generally poorer agreement with each other and with the core reference values than the core instruments.
– No statement can be made about the absolute accuracy of the instruments
be-25
AMTD
7, 3159–3251, 2014AquaVIT-1 water vapor intercomparison
D. W. Fahey et al.
Title Page
Abstract Introduction
Conclusions References
Tables Figures
◭ ◮
◭ ◮
Back Close
Full Screen / Esc
Printer-friendly Version Interactive Discussion
Discussion
P
a
per
|
D
iscussion
P
a
per
|
Discussion
P
a
per
|
Discuss
ion
P
a
per
calibrates (or validates) their respective instrument and links it to one or more absolute reference sources. Most pairs of core instruments agree within the re-spective combined uncertainties over the water vapor range of 1–150 ppm. Thus, it is highly likely that the correct water vapor value for each segment is between the maximum and minimum of the segment averages of the core instruments.
5
This corresponds to about±10 % of the reference value for the 1–150 ppm range. The APicT results from the dynamic experiments strengthen the conclusion that the correct water vapor values are bounded by the core instrument averages.
– The AquaVIT-1 results alone do not resolve the water vapor discrepancies ob-served in the atmosphere. Caution must be taken in using these results to infer
10
instrument performance on moving platforms (e.g., balloons and aircraft) because AquaVIT-1 did not fully reproduce operating and sampling conditions in the UT/LS for the diverse set of instruments involved. All flight instruments were modified or reconfigured for chamber operation. In some cases, adaptation to laboratory envi-ronment introduced other sources of error or uncertainty. Furthermore, there are
15
potentially other factors that influence in-flight performance that did not influence the AquaVIT-1 experiments. It is possible that these additional factors are respon-sible for the larger discrepancies observed in intercomparisons of some moving platform measurements.
– The success of AquaVIT-1 provides a template for future intercomparison efforts
20
AMTD
7, 3159–3251, 2014AquaVIT-1 water vapor intercomparison
D. W. Fahey et al.
Title Page
Abstract Introduction
Conclusions References
Tables Figures
◭ ◮
◭ ◮
Back Close
Full Screen / Esc
Printer-friendly Version Interactive Discussion
Discussion
P
a
per
|
D
iscussion
P
a
per
|
Discussion
P
a
per
|
Discuss
ion
P
a
per
|
Appendix A
Instrument descriptions
A1 AIDA-PCI-in-cloud-TDL (APicT)
The APicT spectrometer is a near infrared, diode-laser based, fiber-coupled, high spec-tral resolution, absorption spectrometer with an open-path absorption cell mounted on
5
the inner surface of the walls of the AIDA vessel. This open-path configuration avoids any gas sampling and allows a selective detection of the interstitial water vapor in-side clouds and a continuous determination of the absolute water-vapor molar fraction inside the AIDA chamber. APicT was designed to investigate cloud formation within AIDA and thus can be used not only in particle-free conditions but also when clouds
10
are formed within the APicT absorption path.
The main goal of the APicT design was – aside from high chemical selectivity and sensitivity, and sufficient temporal resolution – to achieve a highly accurate, absolute, water vapor measurement by complete avoidance of gas sampling and gas treatment. Special attention was given to providing absolute H2O detection levels without the need
15
for a regular calibration of the instrument response (i.e., by using water vapor gen-erators). APicT’s measurement volume is distributed equally over a central intersect through the AIDA chamber, which delivers representative, spatially averaged H2O
con-centrations over the respective AIDA cross section with very little influence from wall effects or gas sampling problems.
20
The APicT instrument (Giesemann, 2003, Giesemann et al., 2003; Ebert, 2004, 2005, 2008) is based on the extensive tunable diode laser absorption spectroscopy (TDLAS) experience of the Ebert group previously located at the Physical Chemistry Institute (PCI) at the University of Heidelberg (now at PTB and Technical University Darmstadt). Extensive knowledge, particularly from very robust, laser-based,
open-25
AMTD
7, 3159–3251, 2014AquaVIT-1 water vapor intercomparison
D. W. Fahey et al.
Title Page
Abstract Introduction
Conclusions References
Tables Figures
◭ ◮
◭ ◮
Back Close
Full Screen / Esc
Printer-friendly Version Interactive Discussion
Discussion
P
a
per
|
D
iscussion
P
a
per
|
Discussion
P
a
per
|
Discuss
ion
P
a
per
instrument (CHILD) for simultaneous H2O and CH4detection (Gurlit et al., 2005; Ebert, 2006), has been combined for the development of the APicT spectrometer. APicT also takes advantage of knowledge of highly stable, open, White-type (White, 1942) multi-path cells at AIDA developed by KIT (Wagner et al., 2008).
Since 2003, APicT has been used in more and more cloud formation studies at
5
AIDA in order to determine absolute water vapor and super saturation values dynamics during cloud formation (Murray, 2010; Wagner et al., 2008; Möhler et al., 2008a, b, 2005; Mangold, 2005).
APicT uses direct absorption spectroscopy (Schulz et al., 2007; Ebert and Wolfrum, 2001) (instead of the more common 2f wavelength modulation technique (Fernholz
10
et al., 2002) to avoid calibration, while simultaneously permitting an efficient distur-bance correction (e.g., for the strong, spectrally broad-band optical losses caused by the cloud particles). This technique has been derived from even more demanding mea-surements in extremely dust-laden combustion chambers (Dreier et al., 2011; Schulz et al., 2007; Awtry, 2006; Teichert et al., 2003; Ebert, 1998).
15
APict detects H2O vapor molecules via the (110–211) line (7299 cm
−1
) in theν1+ν3
combination band (or for higher H2O concentrations via the (211 322) line in the 2ν1
-overtone-band) both around at 1.37 µm (Giesemann, 2003; Ebert et al., 2004, 2005, 2006; Hunsmann, 2006).
APicT consist of three basic parts (Fig. A1) (Giesemann, 2003; Ebert et al., 2005):
20
a. The outer part, placed within the user accessible space outside the AIDA in-sulated chamber, contains a fiber-coupled temperature-stabilized distributed-feedback (DFB) diode laser module in an N2-purged container and all electronics (Laser/Peltier driver, signal generator, detector preamplifiers, data acquisition, and computer).
25
b. The middle, opto-mechanical part is a cryogenic transfer optic (including two de-tectors for I and I0) directly attached to the outside wall of the AIDA chamber.
AMTD
7, 3159–3251, 2014AquaVIT-1 water vapor intercomparison
D. W. Fahey et al.
Title Page
Abstract Introduction
Conclusions References
Tables Figures
◭ ◮
◭ ◮
Back Close
Full Screen / Esc
Printer-friendly Version Interactive Discussion
Discussion
P
a
per
|
D
iscussion
P
a
per
|
Discussion
P
a
per
|
Discuss
ion
P
a
per
|
beam is formed, which is then focused through wedged CaF2 windows into the absorption cell in the inner chamber. Through a second identical window the laser light behind the measurement zone is collected and directed onto an uncooled InGaAs detector (1 mm diam.) using a 2.54 cm spherical mirror. In the middle section, which is at atmospheric pressure but at cryogenic AIDA chamber
tem-5
peratures, the total path length of the free space beam from the fiber end to the detector is 36 cm.
c. The inner part is the cryogenic, open, White-type, multi-path absorption cell with heated mirrors. The cell is permanently mounted onto the walls inside the AIDA chamber (3.74 m mirror separation) and enables path lengths of up to 250 m.
10
A path of 82 m was mostly used during AquaVIT-1.
For the measurements the laser is scanned across the target H2O line with a
rep-etition frequency of 139.8 Hz. The resulting absorption profiles are co-added up to 100 times to yield a 1–2 s time resolution. The averaged, in-situ raw signal is cor-rected for spectrally broad-band optical losses, electric-optical offsets, converted from
15
time to frequency space and evaluated via a proprietary Labview-based fitting soft-ware taking into account (i) the ideal gas law and an extended Beer–Lambert law (Giesemann, 2003; Schulz et al., 2007; Ebert and Wolfrum, 2001; Teichert et al., 2003; Ebert et al., 2005), (ii) a Voigt line-shape-based spectral model that is fitted to the raw data using a non-linear Levenberg–Marquardt fitting algorithm, taking into
20
account measured pressure, temperature and absorption path length inside AIDA, (iii) a highly precise characterization of the dynamic laser tuning (using a 10 cm air-spaced precision etalon), and (iv) H2O spectral data like our measured air broaden-ing coefficient (gair=0.0981±0.0002 cm
−1
atm−1at 296 K) and temperature coefficient (n=0.74±0.01) (Hunsmann et al., 2006) and the tabulated H2O line strength from
HI-25
AMTD
7, 3159–3251, 2014AquaVIT-1 water vapor intercomparison
D. W. Fahey et al.
Title Page
Abstract Introduction
Conclusions References
Tables Figures
◭ ◮
◭ ◮
Back Close
Full Screen / Esc
Printer-friendly Version Interactive Discussion
Discussion
P
a
per
|
D
iscussion
P
a
per
|
Discussion
P
a
per
|
Discuss
ion
P
a
per
for by using either a secondary detector channel on the cryo-transfer optics board, or the known ratio between the parasitic and the inner absorption path (0.36 m/82 m). No calibration or scaling parameters are used in order to derive absolute water mixing ratios.
With that procedure, APicT can report absolute H2O molar fractions from above
5
10 000 to below 1 ppm at pressure/temperature ranges from 1000 to 1 hPa and 300 to 180 K and achieve precision (1 s) in the 20 ppb range (Ebert et al., 2004, 2005, 2006, 2008). The absolute accuracy estimated from an error budget is better than 5 % and dominated by the line strength uncertainty (±3 %). Optical losses by cloud particles of 99 % have been handled without additional systematic errors (even higher losses
10
of 99.99 % have been compensated for in combustion applications using dedicated digital-signal-processing (DSP) based electronics (Awtry et al., 2006)).
The instrument, parts thereof, as well as the principles behind the APicT software and absolute evaluation procedure, was successfully validated in numerous cases in view of achieving absolute accuracy without a regular calibration. Tuning accuracy has
15
been checked via retrieved Doppler line widths at AIDA (yielding 0.15 % deviation). APicT water vapor values were compared at AIDA with the MBW-373LX and FISH instruments during cloud-particle free conditions yielding typically less than 3 % devi-ation (Hunsmann et al., 2006). A similar open-path TDLAS spectrometer for CH4was
compared at atmospheric background levels of CH4with a NOAA calibrated, extractive
20
gas chromatograph and yielded<1 % average deviation over 36 h (Lauer et al., 2007). Recently an improved, extractive version of our TDLAS hygrometer series (using the same data evaluation principles) was investigated in a smaller water vapor intercom-parison at FZ Jülich (Buchholz et al., 2013) and yielded an average offset of −3.9 % with respect to a frost point hygrometer and a Lyman-αabsorption hygrometer.
Partic-25
AMTD
7, 3159–3251, 2014AquaVIT-1 water vapor intercomparison
D. W. Fahey et al.
Title Page
Abstract Introduction
Conclusions References
Tables Figures
◭ ◮
◭ ◮
Back Close
Full Screen / Esc
Printer-friendly Version Interactive Discussion
Discussion
P
a
per
|
D
iscussion
P
a
per
|
Discussion
P
a
per
|
Discuss
ion
P
a
per
|
During the AquaVIT-1 static experiments APicT performance however was hampered by a software problem that caused a sensitivity loss of nearly a factor of 10, which should not have impaired measurement accuracy. This precision loss was compen-sated by reducing the instrument temporal response. During the dynamic experiments (second week) this error was corrected.
5
A1.1 APicT ice-saturation experiments
The second phase of AquaVIT-1 was focused on dynamic experiments characterized by almost constant average temperature conditions each day (22–26 October) in the chamber superimposed with quick variations of pressure, temperature and humidity conditions. Dense ice clouds were generated during 10 segments (600 s to 2400 s
du-10
ration) with almost constant pressure and temperature. During these segments, the average relative humidity inside the chamber was maintained at ice-saturation tions at the respective gas temperature. At constant pressure and temperature condi-tions, the variability of the gas temperatures measured throughout the chamber volume is typically less than±0.2◦C, which means that the variability of the water saturation
15
pressure above the ice-crystal phase is less than about±3 %. The average values of water vapor and temperature in the ice-saturated segments were in the range 0.01– 40 Pa and 185–243 K, respectively. Figure A2 (top) shows the percentage differences between the APicT water vapor partial pressures and ice-saturation values (pwsat) derived from measured temperatures for segments in the dynamic AquaVIT-1
exper-20
iments (Table 1). Figure A2 (bottom) shows the water vapor partial pressures from APicT measurements (pw APicT) and ice-saturation calculations (pwice sat), and the
chamber water vapor mixing ratio for each segment. During the segments, the water-vapor partial pressure measured in situ with the APicT instrument deviated by less than±3 % from the ice-saturation pressures calculated from laboratory vapor-pressure
25
AMTD
7, 3159–3251, 2014AquaVIT-1 water vapor intercomparison
D. W. Fahey et al.
Title Page
Abstract Introduction
Conclusions References
Tables Figures
◭ ◮
◭ ◮
Back Close
Full Screen / Esc
Printer-friendly Version Interactive Discussion
Discussion
P
a
per
|
D
iscussion
P
a
per
|
Discussion
P
a
per
|
Discuss
ion
P
a
per
the widths of the Gaussian fits to the probability distribution functions of 1 s APicT and ice-saturation water-vapor partial pressure data in each segment. Within its estimated uncertainty limits of about±5 %, APicT correctly measured the expected ice saturation conditions, with a slight tendency of a low bias at the higher water concentrations and higher temperatures, and a slight high bias at the lower water concentrations and lower
5
temperatures (i.e., at high segment numbers).
A2 Cryogenic Frostpoint Hygrometer (CFH)
A2.1 Instrument description
The CFH is a small balloon borne instrument that measures water vapor continuously between the surface and the middle stratosphere (Vömel et al., 2007a) (See Fig. A3
10
and Table A1). It is based on the chilled mirror principle by measuring the temperature of a mirror carrying a thin dew or frost layer that is maintained in equilibrium with am-bient water vapor. An optical phase-sensitive detector and light-emitting diode (LED) combination measures the bulk reflectivity of the mirror. A microprocessor feedback controller regulates the mirror temperature to maintain a constant bulk reflectivity and,
15
hence, a constant condensate layer. Under this condition the condensate layer on the mirror is in thermal equilibrium with the water vapor in the ambient air passing over the mirror. The mirror temperature is then equal to the ambient dew point or frost point tem-perature and the water vapor mixing ratio and relative humidity can be calculated from this temperature using a variation of the Clausius–Clapeyron equation and a measure
20
of ambient pressure.
The CFH is currently flown with an electrochemical concentration cell (ECC) ozone sonde, Global Positioning System (GPS), and a radiosonde, which is also used as data transmitter. Therefore, in addition to water vapor mixing ratio, every CFH payload provides ozone mixing ratio and radiosonde pressure, temperature and humidity data,
25
AMTD
7, 3159–3251, 2014AquaVIT-1 water vapor intercomparison
D. W. Fahey et al.
Title Page
Abstract Introduction
Conclusions References
Tables Figures
◭ ◮
◭ ◮
Back Close
Full Screen / Esc
Printer-friendly Version Interactive Discussion
Discussion
P
a
per
|
D
iscussion
P
a
per
|
Discussion
P
a
per
|
Discuss
ion
P
a
per
|
A2.2 CFH configuration during AquaVIT-1
Laboratory instrument configuration
During AquaVIT-1 a laboratory version of the balloon instrument was used because the latter cannot be operated at subambient pressures (i.e., is not vacuum sealed). A stainless steel sensor housing was built that has largely the same geometry as the
5
balloon borne instrument, but allows the connection to a vacuum system and a sepa-rate pressure measurement near the sample volume. The optical path of the laboratory instrument is nearly identical to the balloon instrument, with the only difference being that the detector lens was slightly recessed to allow the addition of a sapphire window, which acted as vacuum seal. The detector and electronics were taken from a balloon
10
instrument. The mirror holder is made of a thin-walled stainless steel tube, which was glued to the mirror disk and acted both as vacuum seal and thermal insulator to the sensor housing. Unlike the balloon instrument, the mirror of the laboratory instrument was fitted with two identical thermistors, each of which was independently calibrated. The dimensions of the mirror, mirror stem and heater coil are identical to the balloon
15
instrument as are the location of the thermistors. This ensures that the thermal proper-ties of the assembly are the same as those of the balloon instrument. The cold finger, which is the part of the mirror assembly that is immersed in the cryogen, was longer than that of the balloon instrument, since accessibility to the sensor housing required a larger separation between the cryogen container and sensor housing. The cooling
20
rate of the instrument, however, is determined by the dimensions of the thin mirror stem, which remained unchanged. Thus the laboratory instrument differs from the bal-loon instrument largely in the use of different materials, which allowed the connection to a vacuum system. All key parameters of the laboratory version are identical to those in the balloon instrument.
25