www.atmos-meas-tech.net/9/1767/2016/ doi:10.5194/amt-9-1767-2016
© Author(s) 2016. CC Attribution 3.0 License.
The automated multiwavelength Raman polarization and
water-vapor lidar Polly
XT
: the neXT generation
Ronny Engelmann1, Thomas Kanitz1, Holger Baars1, Birgit Heese1, Dietrich Althausen1, Annett Skupin1, Ulla Wandinger1, Mika Komppula2, Iwona S. Stachlewska3, Vassilis Amiridis4, Eleni Marinou4,5, Ina Mattis6, Holger Linné7, and Albert Ansmann1
1Leibniz Institute for Tropospheric Research (TROPOS), Leipzig, Germany 2Finnish Meteorological Institute, Kuopio, Finland
3University of Warsaw, Faculty of Physics, Institute of Geophysics, Warsaw, Poland
4National Observatory of Athens, Institute for Astronomy, Astrophysics, Space Application and
Remote Sensing, Athens, Greece
5Aristotle University of Thessaloniki, Department of Physics, Laboratory of Atmospheric Physics,
Thessaloniki, Greece
6Deutscher Wetterdienst, Hohenpeißenberg Meteorological Observatory, Hohenpeißenberg, Germany 7Max Planck Institute for Meteorology, Hamburg, Germany
Correspondence to:Ronny Engelmann (ronny@tropos.de)
Received: 24 June 2015 – Published in Atmos. Meas. Tech. Discuss.: 24 July 2015 Revised: 26 February 2016 – Accepted: 18 March 2016 – Published: 25 April 2016
Abstract.The atmospheric science community demands au-tonomous and quality-assured vertically resolved measure-ments of aerosol and cloud properties. For this purpose, a portable lidar called Polly was developed at TROPOS in 2003. The lidar system was continuously improved with gained experience from the EARLINET community, involve-ment in worldwide field campaigns, and international insti-tute collaborations within the last 10 years. Here we present recent changes of the setup of the portable multiwavelength Raman and polarization lidar PollyXT and discuss the
im-proved capabilities of the system by means of a case study. The latest system developments include an additional near-range receiver unit for Raman measurements of the backscat-ter and extinction coefficient down to 120 m above ground, a water-vapor channel, and channels for simultaneous mea-surements of the particle linear depolarization ratio at 355 and 532 nm. Quality improvements were achieved by sys-tematically following the EARLINET guidelines and the international PollyNET quality assurance developments. A modified ship radar ensures measurements in agreement with air-traffic safety regulations and allows for 24/7 monitoring
of the atmospheric state with PollyXT.
1 Introduction
Lidar profiling of atmospheric aerosol and cloud layers has become important for climate research during recent decades. More recently, the volcanic eruption hazards of Ey-jafjallajökull and Grimsvötn (Ansmann et al., 2010; Tesche et al., 2012) for aircraft safety have shown the need for a height-resolved monitoring of the aerosol concentration on continental scales. There are a few examples of how this can be achieved either by spaceborne applications, e.g., with the Cloud-Aerosol Lidar and Infrared Pathfinder Satellite Ob-servations mission (CALIPSO, Winker et al., 2009) or by networks of ground-based aerosol profilers as organized in the European Aerosol Research Lidar Network (EARLINET, Bösenberg and Hoff, 2008; Pappalardo et al., 2014) and by the ceilometer network of the German Meteorological Ser-vice (DWD, Flentje et al., 2010). The disadvantage of the polar-orbiting lidar aboard CALIPSO is the low temporal resolution, because it overpasses the same area only every 16th day. Ceilometer networks are operated 24/7, but are not
In-fraStructure (ACTRIS1and ACTRIS-22), aerosol and cloud
profiling and characterization is performed with different Raman and polarization lidars three times per week. EAR-LINET members have developed lidar techniques and algo-rithms in order to harmonize the lidar measurements in Eu-rope, to set up quality standards, to perform systematic test routines, and to improve data evaluation (e.g., Freudenthaler, 2008; Freudenthaler et al., 2010; Pappalardo et al., 2014; Belegante et al., 2016). However, most of those lidar systems are prototypes leading to a huge variety of partly manually controlled system setups.
For more than 10 years, at TROPOS the aim has been to develop sophisticated, portable lidar systems (Polly) with the capabilities of advanced EARLINET lidars and EARLINET quality standards, but dedicated to stand-alone operation at remote places. In previous years, these systems were success-fully used within EARLINET and showed also promising ap-plicability for 24/7 operation at supersites combined with
cloud-radar measurements, e.g., the Leipzig Aerosol and Cloud Remote Observations System (LACROS, Wandinger et al., 2012). An important advantage of the Polly systems is the uniform data structure and therefore the easy-to-adjust software updates. All Polly lidars are operated within a net-work called PollyNET (Althausen et al., 2013; Baars et al., 2016; PollyNET, 2016) which ensures data backup, instru-ment monitoring, and an international transfer of knowledge. The very first Polly (first generation), a single-wavelength Raman lidar, was developed in 2003 (Althausen et al., 2009). Since then, further lidar systems along the line of Polly have been developed and permanently upgraded. Since 2006, two multiwavelength Raman and polarization lidar systems with eXTended capabilities (PollyXT, second generation) have
been developed and operated by TROPOS and FMI. These systems enabled the determination of the particle backscatter coefficients at 355, 532, and 1064 nm and extinction coef-ficients at 355 and 532 nm (therefore often called 3+2 li-dars). The spectral backscatter and extinction coefficients al-low for aerosol classification by optical properties of aerosol particles (Müller et al., 2007) and applying inversion algo-rithms (Müller et al., 1999; Baars et al., 2012) to derive the particle size distribution and concentration. In addition, a polarization-sensitive channel (+1) was installed to deter-mine the shape of the aerosol particles from measurements of the (particle) linear depolarization ratio (Kanitz et al., 2013), to separate dust and non-dust particles in mixed aerosol layers (Baars et al., 2011), and to investigate mixed-phase clouds (Kanitz et al., 2011). In the framework of worldwide field campaigns these 3+2+1 PollyXT systems achieved a unique lidar data set in the Amazonian basin, India, China, South Africa, Finland, Chile, and over the Atlantic aboard the research vesselsPolarsternandMeteor. Figure 1 shows
1http://www.actris.net 2http://actris2.nilu.no
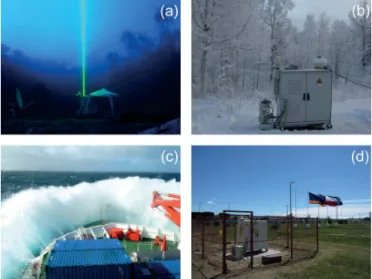
Figure 1.Autonomous measurements of PollyXTin(a)the
Ama-zon basin, 2◦S, at>90 % relative humidity,(b)at Kuopio, Finland, 62◦N, in winter,(c)aboard the RVPolarsternduring 8 m ground swell, and(d)at the southern edge of Latin America, Punta Arenas,
Chile, 52◦S.
impressions from a selection of the very different measure-ment locations.
In 2009 and 2010, two additional PollyXTlidars were
de-veloped with the setup described in Althausen et al. (2009). One has been operated stationary as a new EARLINET sta-tion (Preißler et al., 2013) at the Geophysics Centre of Évora (CGE, University of Évora, Portugal, now Institute for Earth Sciences, UE-ICT). The other one has been mounted at the meteorological monitoring station on Baengnyeong Island, Korea and has been operated by the Korean National Insti-tute for Environmental Research (NIER).
In 2011, the PollyXTsystems of TROPOS and FMI
under-went overall maintenance, upgrades of the optical setup, and were equipped with an additional water-vapor Raman chan-nel (407 nm). The third generation of the systems was started in 2013, when another two systems with two depolariza-tion channels at 532 and 355 nm were set up in cooperadepolariza-tion with the University of Warsaw (UW) and in the framework of the mobile sea facility OCEANET-Atmosphere (Kanitz et al., 2013). The latter includes a second receiver unit for the near range at 532 and 607 nm with a full overlap in 120 m height above ground (Sect. 5.3) and an improved data acqui-sition unit (Sect. 2.3). In 2015, a similar near-range receiver with four channels (355, 387, 532, and 607 nm) was devel-oped for the PollyXT_UW system. Recently, two more
Table 1.Measurement capabilities of the different Polly systems at UV (355 nm), VIS (532 nm), and IR (1064 nm) wavelengths. Water-vapor
(W/V) channels and absolute calibration of the depolarization channels (δ-cal.) have been installed in most of the systems. The four most
recent systems include a near-range (N/R) telescope in addition at 532 and 607 nm wavelengths. A new setup with additional N/R channels at 355 and 387 nm wavelengths has been recently developed. Three different data acquisition (DAQ) systems have been in use so far (see Sect. 2.3).
System Generation Data since UV VIS IR W/V δ-cal. N/R VIS N/R UV DAQ
Polly 1st 1 Dec 2002 α,β P7882
IFT∗ 2 Oct 2006 α,β α,β,δ β × × P7882
TROPOSv 2 Jan 2015 α,β,δ α,β,δ β × × CNT80
FMI 2 May 2007 α,β α,β,δ β × × P7882
UE-ICT 2 Feb 2009 α,β α,β,δ β P7882
NIER 2 Jan 2010 α,β,δ P7882
OCEANET 3 Oct 2012 α,β,δ α,β,δ β × × × from Aug 2015 CNT80
UW 3 Jun 2013 α,β,δ α,β,δ β × × × from Apr 2016 CNT80
NOA 3 Sep 2014 α,β,δ α,β,δ β × × × CNT80
DWD 3 Apr 2015 α,β α,β,δ β × × CNT80
∗The system labeled IFT (former abbreviation of the Institute for Tropospheric Research) was upgraded with an additional UV depolarization channel and the new data acquisition in January 2015 and is now labeled TROPOS.
Since the system’s presentation in 2009 (Althausen et al., 2009) the numerous improvements of PollyXT build up
a neXT generation of PollyXTs that are the topic of the
present paper. At the beginning of the paper, we give an overview about the first developed third-generation system PollyXT_OCEANET. Afterwards, we show recent
improve-ments of PollyXTin terms of an additional detection channel
for water-vapor profiling (Sect. 3), adjustments in the opti-cal setup to determine the particle linear depolarization ratio (Sect. 4), and achievements in the critical overlap range for lidar systems (Sect. 5). Finally, we present a case study of observed marine and dust layers from measurements aboard the research vesselMeteorto show the capabilities of the new
generation of our sophisticated Pollys. A conclusion and out-look section is given at the end.
2 Systems
This section gives an overview of the general concept of the PollyXT lidars. The optical setup and the new
photon-counting data-acquisition system are described. The quality-assurance procedures which we apply are presented at the end.
2.1 Overview
Figure 2 presents the simple concept of our lidar. The Polly systems are housed in an outdoor cabinet, or in the case of PollyXT_OCEANET, in a container to allow the
opera-tion under various climatic condiopera-tions. The systems run au-tonomously by programmed measurement procedures and can be fully controlled by remote access via the Internet. In case of rain events, measurements are automatically inter-rupted and resumed thereafter. When required by air-safety
regulations, the system can be attached to a modified FU-RUNO radar (Duck et al., 2005) in order to shut off the laser beam in case an airplane is detected in a±15◦ cone above the lidar.
In terms of maintenance, the systems require much less attendance than many manually operated research Raman lidars used in EARLINET. The Pollys only need cleaning of the exit windows (if necessary), laser maintenance (flash lamp replacement) every 3 months, occasional realignment of the laser beam, and exchange of neutral-density filters (if aerosol conditions change significantly). In extreme climatic conditions, the internal heating has to be adapted. Since PollyXT_OCEANET (generation 3) we apply a laser system
which requires an external coolant-water supply whereas be-fore (generation 2) the laser systems were cooled by air. By using the external-coolant water, the cabinet temperature can be kept more constant and also the laser system operates more reliable and independent of external climatic condi-tions.
Figure 2.The general concept of Polly. These unattended aerosol
Raman lidars have already been deployed worldwide for campaigns with periods on the order of 1 year. They are completely controlled via remote access, automatically shut down in events of rain, can be connected to an air-safety radar, and transfer the data to a central-ized data server where the data are archived and automatically eval-uated. Issues with data quality can thus be quickly identified and the users are informed. The system’s mass is approximately 500 kg, but they can be easily moved on the four wheels.
measurements within PollyNET are presented in Baars et al. (2016).
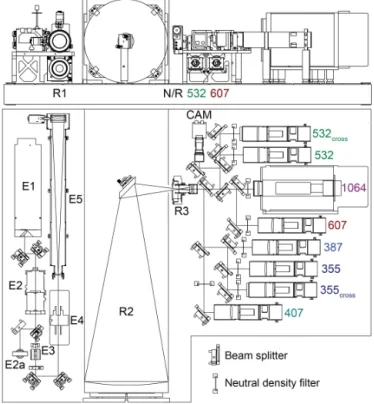
2.2 Optical concept
Because it is the most complex Polly system so far, the op-tical setup of PollyXT_OCEANET is presented in Fig. 3. In PollyXT, the operated laser is an Inlite III-20 from Contin-uum (Althausen et al., 2009). The laser emits light pulses at 1064 nm with a repetition frequency of 20 Hz. The position of the laser head in the optical setup is denoted by E1 in Fig. 3. The alignment of the laser beam through the external second and third harmonic generators (SHG, THG, type II, originally from Continuum Surelite laser, E2 in Fig. 3) was improved by using a more rigid setup as well as by prede-fined adjustment apertures compared to the original setup. With this upgrade it is easier to correctly realign the beam after a maintenance procedure or after an exchange of the en-tire laser. SHG and THG are heated to approximately 70◦C by two independent temperature controllers which can be adjusted in order to remotely optimize the conversion effi-ciencies. After SHG and THG laser pulses with energies of 180 mJ at 1064 nm, 110 mJ at 532 nm, and 60 mJ at 355 nm are emitted. The laser power is logged by means of a laser-internal sensor during the measurements, and an external
Figure 3.The optical setup of PollyXT_OCEANET. The upper part
displays a top view and the lower part the front view of the system. Details are explained in the text.
power meter (E2a) is used to measure solely the UV com-ponent in order to observe the conversion efficiency continu-ously for later quality control.
The purity of the linear polarization of the pulses at all wavelengths is subsequently ensured by the use of a wave-plate and a Brewster-cut Glan–laser polarizer (E3 in Fig. 3). Further explanation is given in Sect. 4.1. The light is redi-rected upwards via two dichroic mirrors. An additional shut-ter is denoted E4 in Fig. 3. The shutshut-ter is controlled from a modified FURUNO ship radar and prohibits the emission of laser light during airplane overflights. Finally, the 7 mm beam of the Inlite III is expanded to 45 mm diameter with a beam expander (E5 in Fig. 3) before the light is emitted into the atmosphere.
The far-range receiver unit of all PollyXTsystems includes
stored for long-term system performance analysis. The cam-era and all receiver channels are equipped with interference filters for background suppression (see Table 2 for detailed information). Planoconvex lenses in front of each photo mul-tiplier tube (PMT) are used to project an image of the primary mirror onto the photo cathode in order to minimize influences of inhomogeneities of the sensitivity of the photo cathodes which can otherwise result in range-dependent deviations of the lidar signal (Simeonov et al., 1999; Freudenthaler, 2004). Photon counting is performed for all channels. Small PMT modules from Hamamatsu (type: H10721P-110) are used for all wavelengths, except for the 1064 nm wavelength. Here, a Hamamatsu R3236 is applied which is cooled below−30◦C with a multi-stage thermo-electric cooler (see Fig. 3).
PollyXT_OCEANET includes an additional near-range
re-ceiver unit (R1, see Sect. 5.3) to lower the overlap-affected height range of the overall system to 120 m above the li-dar, i. e., to decrease the minimal measurement height in the planetary boundary layer. In this way, better closure mea-surements in combination with in situ meamea-surements can be performed. Table 2 summarizes the general parameters of the original PollyXT_OCEANET configuration. It should be noted that the system recently has been upgraded with a four-wavelength near-range receiver (355, 387, 532, 607 nm wavelengths) that was originally developed together with the University of Warsaw.
The optical setup of PollyXT_OCEANET was mounted on
a weight-saving carbon-fiber optical board (Carbon Vision), which saves approx. 120 kg of weight compared to the orig-inal version of PollyXT. The entire board is tilted by 5◦ to avoid specular reflections from horizontally aligned ice crys-tals which otherwise can prohibit the correct determination of the cloud phase by depolarization measurements (e.g., Seifert et al., 2010).
In contrast to the former systems of generation 1 and 2, which were described by Althausen et al. (2009), we took a new approach and designed the recent systems with a 3D-CAD software that allows for much faster and more consis-tent manufacturing of future systems. Also analysis by the finite-element method (FEM) can be performed in order to determine the deformation of optical mounts under tempera-ture or gravitational stresses. Since the optical elements are aligned on a carbon-fiber optical board and alignment is per-formed horizontally, possible misalignments during the ver-tical mounting of the board in the cabinet can be minimized. For example, the deformation of the optical mount of the primary mirror during the vertical installation is depicted in Fig. 4. The shift of the field of view resulting from this tilt of the primary mirror can be estimated to be on the order of only 0.02 mrad from this figure which is within an acceptable margin.
Table 2.Specification of the portable Raman lidar PollyXT
(gener-ation 3). N/R denotes the near-range receiver unit.
Size 1.8 m×1.7 m×0.8 m
Weight 500 kg, movable by 4 wheels Power ≈2×1.5 kW (lidar and air condition)
Transmitter
Laser Inlite III-20 (Continuum)
SHG and THG external, type II, from Surelite series Repetition rate 20 Hz
Energy after THG 180 mJ (1064 nm),
110 mJ (532 nm), 60 mJ (355 nm) Beam diameter 7 mm
Beam divergence <1.5 mrad (full angle, 86 % of energy) Pointing stability <0.5 mrad (estimated)
Polarization s-pol (with respect to the beamsplitters), cleaned by Glan–laser polarizer Beam expander 6.5×, achromatic
Beam divergence <0.2 mrad (full angle, 86 % of energy) Beam alignment by means of a triggered camera
Receiver
Far range
Type Newtonian
Diameter 300 mm (primary mirror) 76 mm (secondary flat mirror) Focal length 900 m
Position of secondary 700 mm from primary Material Pyrex
Laser axis distance 240 mm (laser – primary)
Field of view 1 mrad (full width, 0.9 mm diaphragm) Collimator lens pair Thorlabs LA1907 and LA1031 Focusing lens Thorlabs LA1401
Thorlabs LA1050 (only at 1064 nm)
Near range
Type refractor (Thorlabs AC508-250-A) Diameter 50 mm
Focal length 250 mm
Laser axis distance 98 mm (laser – lens) Field of view 2.2 mrad (full width) Receiver fiber 550 µm, Thorlabs M37L02 Fiber scrambler 2 mm sapphire ball lens Collimator lens Thorlabs AC127-019-A
Detection:
Channels [nm]/ 1064/1.0, 607/0.3, 607 (N/R)/0.3, bandwidth [nm] 532/1.0, 532 (cross)/1.0 , 532 (N/R)/1.0
407/1.0, 387/0.3, 355/1.0, 355 (cross)/1.0 Photomultiplier Hamamatsu H10721P-110
Hamamatsu R3236 (only at 1064 nm) Signal acquisition 600 MHz photon counters, 7.5 m height
resolution, up to 48 km, pretrigger
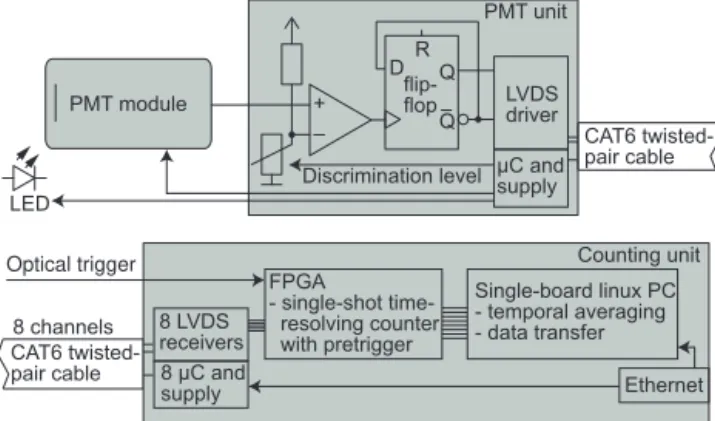
2.3 Data acquisition
The data acquisition of the PollyXT systems of generation
maxi-Deformation, µm
0 1 2 3 4
Figure 4. FEM calculations of the maximal deformation of the
mount of the primary mirror during the vertical adjustment in the cabinet. The deformation intensity is given by the color code.
mum of 8 channels (four P7882 PCI cards, FAST ComTec, GmbH) could be handled by one measurement PC. External preamplifiers had to be used and the 2 m long signal cables had to run from the detectors to the PC which might have caused electromagnetic induced distortions from the laser nearby. Hence, a new photon-counting data acquisition hard-ware which was developed at the Max Plank Institute for Me-teorology in Hamburg has been applied to all recent PollyXT
systems (generation 3). The aim of the project CNT80 was to develop a small and low-cost data acquisition for lidar mea-surements with a signal dynamic range that is only deter-mined by the detectors themselves. Minimum single-photon pulse lengths of are on the order of 2 ns for our employed PMTs. Thus the maximum count rates that need to be han-dled by the electronic design are above 500 MHz in order not to increase the overall dead-time effects significantly.
Figure 5 shows the general electronic concept of the count-ing unit. For all channels except the 1064 nm channel we ap-ply Hamamatsu modules H10721P-110. Within a few cen-timeters behind these modules the pulse discrimination is performed, so that electronic interference is kept to a min-imum and the pulses are digitized as early as possible. In order to increase the maximum electronic count rate and re-duce possible additional dead-time effects, the digital signals are immediately fed into a flip-flop circuit which alters its logic output level every time a photon was detected. This way, each voltage-level transition after the flip flop between the differential outputsQandQ¯ corresponds to one photon
event and the transfer frequency towards the time-resolving counter is divided in half. Then, an LVDS (low-voltage dif-ferential signaling) driver is used to match the impedance of a standard CAT6 Ethernet cable for data transfer. Addi-tionally, a micro controller (µC) is implemented to adjust the pulse-discrimination level and the PMT voltage, to switch the
DRQ flip-flop Q
LVDS driver
µC and supply
CAT6 twisted-pair cable
CAT6 twisted-pair cable LED
PMT module
8 channels Optical trigger
FPGA
- single-shot resolving counter with pretrigger 8 LVDS
receivers 8 µC and supply
PMT unit
Counting unit Single-board linux PC - temporal averaging - data transfer
Ethernet +
–
Discrimination level
Figure 5. Scheme of the eight-channel photon-counting system
(CNT80). Each PMT and the discrimination electronics are con-structed as a fixed unit (top panel). The photon pulses from a max-imum of eight detector units are then digitally transferred to the counting unit (bottom panel) where the lidar return signals are pro-cessed, averaged, and can be obtained by the measurement PC via an Ethernet connection.
power supply, as well as to control an LED (light-emitting diode) which can be used for various test procedures of the PMT. For example, the relative sensitivity of a PMT can be tracked over its lifetime by this LED. Also the dead time could be derived as shown in Johnson et al. (1966) by ob-serving the deviation of the single-photon counting distribu-tion from an ideal Poisson distribudistribu-tion at high count rates.
A single counting unit (Fig. 5, bottom) is capable to con-trol and to acquire the data of eight detection channels and, if required, several of these units can be easily used in par-allel. An optical trigger taken from laser stray light starts the time-resolving counter which is implemented in an FPGA (field-programmable gate array) board (Virtex-4 FX12 Mini-Module). Each single-shot lidar profile is then transferred from the FPGA to an embedded Linux PC (ADSP-BF537 STAMP) where the profiles are averaged over a predefined time period of typically 30 s. Via an Ethernet connection the averaged lidar profiles can then be obtained by a measure-ment PC. Also the controlling of the PMT units (power, set-ting of high-voltage and discrimination level, external LED control) takes place over Ethernet. The specifications of the new data acquisition are summarized in Table 3.
When using photon counting, dead-time effects need to be considered if the data acquisition operates in high count-rate regimes (Donovan et al., 1993; Whiteman et al., 2003), i.e., at signals above 10 million counts per second (10 Mcps) for our system. In the classical sense, the counters have to be consid-eredparalyzableas too many photons per time interval will
pile up and will finally result in a lack of voltage-level cross-ings at the discrimination level. Thus ambiguity can occur at very high signals (>100 Mcps).
tri-Table 3.Specification of the new CNT80 data acquisition hardware
as applied in PollyXT.
Number of channels 8 Height resolution 7.5 m Maximum altitude ≈40 km
Pre-trigger ≈256 bins
Electronic count rate >600 MHz (sine-wave) Discriminator level −5.8 mV (typical)
PMT voltage H10721P-110: 1.15 V (control voltage) R3236:−2000 V
Max. PMT count rate 60 Mcps (80 Mcps dead-time corrected) Overall dead time 2–4 ns (varies with individual PMT) Dark counts <50 cps,<1500 cps (R3236) Trigger optical fiber from laser stray light Maximum laser pulse 80 Hz
repetition rate
Connection PMT control/data readout via Ethernet
angular pulse onto the PMT and measure the pulse shape with low count rates (<5 Mcps) by applying neutral-density
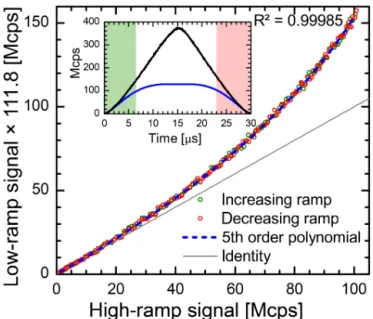
filters. In this way we measured the pulse shape undis-turbed from dead-time effects. Afterwards, we performed the same measurement with higher maximum count rates (>100 Mcps). Figure 6 shows the result of such a
measure-ment. The inset graph shows the two signals from the light ramps. The blue curve was obtained with a high light level and is therefore flattened at the maximum. The black line was calculated from the measurement with less light but is scaled to linearly match the blue curve at low count rates from 0–10 Mcps.
The main graph shows the correlation between the two lines from the inset separated for the increasing (green) and decreasing (red) paths of the light ramp, respectively. Both paths are identical and show that no issues with after-pulsing or signal-induced noise effects are apparent. This data also showed that the paralyzable theory is not always adequate for count rates higher than 40 Mcps and differences to the model occur. In fact, for some PMTs the non-paralyzable
model seemed to fit better to the dead-time-affected slope. Measurements from 32 different PMT-modules showed that the typical dead times with respect to the paralyzable and non-paralyzable theory are 3.2±0.6 and 3.4±0.5 ns, re-spectively, in the range of 0 to 60 Mcps. Up to now only one 1064 nm PMT was measured (PollyXT_DWD) and a dead
time of 2.8 and 3.3 ns, respectively, was derived according to both theories.
In addition, the correction according to the paralyzable theory requires an iterative and thus time-consuming calcu-lation. Therefore, the data points shown in Fig. 6 were fit-ted by a 5th-order polynomial and the coefficients and their errors are stored in the raw-data files for each channel sep-arately. The derived polynomial coefficients which can be used for correction of the lidar-signal count rate (in Mcps) are from 0 to 5th order 0,0.973,3.5×10−3,−7.9×10−6,1.1×
Figure 6.Measurement of dead-time effect of the 355 nm PMT of PollyXT_TROPOS: a light ramp was detected with high and low (by use of an attenuator) count rates, respectively. The inset shows the light ramps with high count rates (blue) and with low count rates (black) but scaled (by a factor of 111.8) so that both curves match the identity line at count rates<10 Mcps. The main graph shows
the dead-time correction function which results from plotting the true count rate (black line from the inset) over the measured count rate (blue line). In addition, a 5th-order polynomial fit which can be applied for dead-time correction is shown.
10−7,and 1.4×10⁻⁹, respectively, for the shown channel. This way, correcting of the dead-time effects in the post-processing line can be performed automatically. Although Fig. 6 shows that a dead-time correction of a measured signal of 100 Mcps might be possible, we try to keep the measured signals below 60 Mcps in order to keep the correction reason-able (max. correction factor of 1.3). Further studies might be needed to explore the full benefits from the dead-time correc-tion scheme in terms of increasing the signal dynamic range.
2.4 Quality assurance procedures
Within EARLINET several quality-assuring guidelines and algorithms have been developed in order to harmonize the lidar measurements, to set up quality standards, to per-form systematic test routines, and to improve the lidar data evaluation (e.g., Böckmann et al., 2004; Pappalardo et al., 2004; Freudenthaler, 2009a; Pappalardo et al., 2014; Wandinger et al., 2016). In order to check the alignment of a new system and to identify potential systematic signal errors, we perform comparative measurements with other indepen-dent lidar systems at TROPOS. This way discrepancies of the retrieved data products could be noticed early. Further qual-ity assurance schemes that are applied for PollyXTdata and
screening, Rayleigh fit, and signal-to-noise analysis are given in Baars et al. (2016).
Additionally, the telecover test (Freudenthaler, 2008) is performed regularly and especially after transportation of the systems. Measurements from different quarters of the pri-mary mirror are performed by vignetting the remaining three quarters. Some selected results from such a telecover test with the PollyXT_NOA system is shown in Fig. 7. The open quadrants for each of the consecutive measurements are la-beled north, east, south, and west. The measurement of the north sector was repeated at the end of the measurement cy-cle (N2) in order to detect atmospheric changes during the test. The top graph shows the fraction of each sector to the total lidar signal at 387 nm [e.g., N/(N+E+S+W), black line]. As expected, the north sector of the telescope (closest to the laser beam) detects most of the signal below 500 m height. The signals from the east and west sectors are similar although the east sector is vignetted by the mount of the sec-ondary mirror and therefore accounts for less than 25 % of the signal above 700 m height. The signal of the south sector reaches the 25 % fraction as the last one. From this graph it can be seen that the height of the full overlap of the 387 nm channel is between 700 and 800 m height (also see Fig. 11) as the quadrant fractions remain constant above that height.
The center graph of Fig. 7 shows the signal ratio of the 532 and 607 nm channels as it is used for the Raman method of the calculation of the backscatter coefficient (Ansmann et al., 1992) for each quadrant separately. The curves are normal-ized between 1.5 and 2.0 km height, at a range where the overlap function is unity. It can be seen that the signal-ratio differences between the sectors are smaller than the atmo-spheric variability (N and N2 sector) down to 250 m. Hence we can assume that the relative error of the signal ratio which might arise from different overlap functions of the two chan-nels is below 10 % for heights greater than 250 m. A simi-lar argument holds for the channels used for the calculation of the 532 nm volume linear depolarization ratio shown at the bottom graph of Fig. 7. The ratios of the 532 nm cross-polarized and total signals are within a margin of 10 % down to 300 m height for all sectors for this system. Again, the at-mospheric variability caused a larger difference during this measurement as seen from the difference of the N and N2 ratios.
3 Water-vapor measurements
Operational aerosol lidar systems can be even more valuable if they have the simultaneous capability to monitor the atmo-spheric water vapor. Water vapor is the most important green-house gas in the Earth’s radiation budget and controls aerosol optical properties. Vertical profiles of the water-vapor mixing ratio can serve as input value for height-resolved radiative-transfer calculations and to investigate the hygroscopicity of aerosols and the processes of cloud formation. For some
sys-0.0
0.5
1.0
1.5
2.0
2.5
0.5
1.0
1.5
Height [km]
S
e
ct
o
r
s
ig
n
a
l
ra
ti
o
(
c)
532c/532
0.5
1.0
1.5
(
b)
532/607
0.0
0.5
1.0
(((
(
a)
S
e
ct
o
r
fr
a
ct
io
n
387
N
N2
S
E
W
Figure 7. Telecover test measurement of PollyXT_NOA on
25 May 2015. Measurements of 15 min duration were taken for each of the telescope sectors (north, east, south, and west with respect to the laser beam) as indicated in(a). The signals were smoothed for
75 m range. The measurement of the north sector was performed twice (N2) with a time difference of 1 h in order to account for at-mospheric variability.(a)signal fraction of each sector to the sum of
all sectors (N+E+S+W).(b)signal ratios of the 532 and 607 nm
wavelength channels for each sector. The curves were normalized to 1 between 1.5 and 2 km.(c)same as(b)but for the cross-polarized
and total channels at 532 nm wavelength.
tems (see Table 1) the setup includes an additional channel at 407 nm for the detection of Raman-scattered light from wa-ter vapor (e.g., Wandinger, 2005). An automated calibration scheme by use of a microwave radiometer was recently pre-sented in Foth et al. (2015).
Figure 8 shows one of the first measurements of the water-vapor mixing ratio with PollyXT_IFT. The
Some-0
1
2
3
4
5
6
0.0
0.5
1.0
1.5
Polly _IFT
XTRadiosonde
MARTHA
Water-vapor mixing ratio [g kg
-1]
Height [km]
Figure 8.90 min mean profiles of the water-vapor mixing ratio as
determined with PollyXT_IFT (green, 30 m vertical smoothing up to 2 km height, 60 m above), a located radiosonde (red), and co-incident measurements of the EARLINET Raman lidar MARTHA (blue, resolution 30 m) at Leipzig on 10 February 2012 (19:00– 20:30 UTC). The error bars are calculated from the signal noise.
what larger differences between lidar and radiosonde data might be caused by the drift-off of the radiosonde. A mea-surement close to the ground (>200 m height) is feasible
because the water-vapor mixing ratio calculates from the 407 to 387 nm signal ratio and if the overlap functions of both channels are equal they cancel each other out (e.g., Wandinger, 2005). The reason for the deviations on the or-der of 0.2 g kg−1(16 % error) of the PollyXT_IFT data be-low 800 m height from MARTHA and the radiosonde data remains unclear for the presented measurement. Either elec-tronic distortions by the older P7882 data acquisition setup or different overlap functions for 387 and 407 nm might have caused the discrepancy.
The presented data were obtained from a night-time mea-surement. The low Raman-scattering cross section of water vapor does not allow measurements during daytime with the current PollyXTsetup. Moreover, the water-vapor detector is
automatically switched off during daytime, because the day-light background intensity can be near the damage threshold of the PMT.
4 Determination of particle linear depolarization ratio
The linear depolarization ratio has gained importance for aerosol and cloud layer separation (Liu et al., 2010), as well as cloud and aerosol type identification (Sassen, 2005; Omar et al., 2009). In addition, the particle linear depolarization ra-tio is well suited to characterize aerosol particles (Freuden-thaler et al., 2009b; Preißler et al., 2013) and to separate dust and non-dust particles mixed aerosol layers (Tesche et al., 2009; Ansmann et al., 2011; Baars et al., 2012; Kanitz et al., 2013). Even fine and coarse-mode dust can be separated by means of polarization lidar and Sun photometer measuments (Mamouri and Ansmann, 2014). These approaches re-quire measurements of depolarized light with high accuracy. Moreover, measurements of the particle linear depolariza-tion ratio at two different wavelengths simultaneously can help to study aerosol mixtures and separate their compo-nents. The spectral slope of the aerosol depolarization is sen-sitive to the ratio of the fine and coarse mode of non-spherical particles (Sakai, 2010; Burton et al., 2012).
4.1 Laser polarization
The linear depolarization ratio of Rayleigh scattering is smaller than 1.5 % in dependence of the width of the used interference filters (Behrendt and Nakamura, 2002). In case of PollyXT(filter width of 1.0 nm) molecular linear
depolar-ization ratios of 0.75 and 0.53 % are expected at 355 and 532 nm, respectively, assuming 100 % purity of the linearly polarized emitted laser light. The purity of linear polarization of typical flash-lamp-pumped andQ-switched Nd:YAG laser
systems at the fundamental wavelength is about 98 to 99 %. Birefringence in the laser rod usually induces small amounts of cross-polarized light.
In contrast, the generation of second and third harmonic radiation can significantly decrease the purity of polarization or rotate the plane of polarization and thus affect the accu-racy of measurements. SHG and THG are both of type II in the current PollyXTsetup, i.e., the radiation at 355, 532, and
Wave plate
355: 4 λ 532: 2.5 λ 1064: 1.2 λ
Beam dump
Brewster-cut Glan-Laser polarizer
Figure 9.Wave plate and polarizer setup used to generate highly
linear-polarized light at three wavelengths. The different polariza-tion states after SHG and THG are matched by the wave plate and afterwards purified by the polarizer.
manufactured (Bernhard Halle Nachfl. GmbH, Berlin, Ger-many) in order to rotate the polarization plane at 532 nm (2.5λ) but not at 355 nm (4λ). At 1064 nm (1.2λ) the light
is elliptically polarized, and by inserting the wave plate ei-ther at+45 or−45◦, the vertically polarized component can be maximized. After the wave plate, a Brewster-cut Glan– laser polarizer (Artifex Engineering, Emden, Germany) is in-serted, which provides an extinction ratio of<5×10⁻⁵over a wavelength range from 350–2300 nm with an angular beam separation of<0.01 mrad. Hence, the polarization impurity
(fraction of non linear polarized light) of the transmitted laser beam is well below 0.1 % and thus sufficiently lower than the expected Rayleigh depolarization. The remaining offset angle between the laser polarization plane and the receiver beam-splitter plane can be reduced below 0.1◦.
It was recently discovered that the beam expander (see Sect. 5.1) after the Glan–laser polarizer can introduce fur-ther effects. Unfortunately, stress-induced birefringence de-veloped during the anti-reflection coating process of the cal-cium fluoride lenses (see Table 5). The resulting birefrin-gence pattern might again introduce circular or unpolarized laser-light components which could explain the observed ap-parent linear volume depolarization ratio for Rayleigh scat-tering of>1.5 % for the NOA and DWD systems. A
replace-ment of the crystalline lens material by an amorphous glass type is foreseen.
4.2 Polarization effects of beam splitters
Dichroic beam splitters show different transmissions for par-allel and cross-polarized (p and c-polarized) light which results in different transmission efficiencies for both po-larization states at each detection channel. Mattis et al. (2009) showed systematic errors of lidar signals because of polarization-dependent receiver efficiencies in the presence of depolarizing aerosols, which can result in discrepancies of
>60 % in the total particle backscatter coefficient. In order
to keep the error on the backscatter coefficient below 5 %, the receiver transmission ratios
Ri=
ηi,c
ηi,p (1)
of the total channels should be between 0.85 and 1.15. Here,
ηi,c andηi,p denote the detection efficiency of a channel i
for cross and parallel-polarized light with respect to the laser polarization plane.
Overcoming this bias is possible, if the volume linear de-polarization ratio (δv) at the respective wavelength as well as
the receiver transmission ratiosRi are known for the
chan-nels. With these parameters the corrected lidar signalsPi,corr
can be calculated from the measured signalPi (Mattis et al.,
2009):
Pi,corr=Pi
1+Riδv
1+δv . (2)
In principle, a good polychromator design should result in values ofRiof about 1 for the total elastic-backscatter
chan-nels so that the former correction is not necessary. In turn, high values ofRi (>500) are desired for the
polarization-sensitive channels. For Raman channelsRiis negligible since
the molecular depolarization is nearly constant with height and changes only slightly with temperature in dependence of the width of the applied interference filter in these channels. Although the remaining bias from non-ideal beam splitters can be corrected with Eq. (2), it yields another step in the data evaluation and can introduce new errors. Under this consider-ation, several beam splitters were substituted in the TROPOS and FMI PollyXTs during the upgrade. The obtained values
for the newest design of PollyXT(DWD and NOA) are
satis-factory and show a sensitivity ratio of each channel for par-allel and cross-polarized light between 0.85 and 1.15 as sug-gested by Mattis et al. (2009). Table 4 gives an overview on the actual values ofRi and their measurement uncertainties.
For the systems withRi values outside this margin the
cor-rection with Eq. (2) should generally be considered.
A suitable method to determine Ri is to use an
artifi-cial light source with a polarizer mounted in front. By us-ing this setup, the receiver efficiencies can be measured in dependence of the incident polarization plane and Ri can
Table 4.Ratios of polarization-dependent receiver efficienciesRi for the elastic channels of different PollyXTsystems.
Channel TROPOS FMI OCEANET UW DWD NOA
355total 0.89±0.08 1.25±0.03 0.70±0.02 0.8±0.02 0.95±0.03 1.00±0.01 355cross >1000 not installed >500 >400 not installed >500
532total 1.43±0.01 1.02±0.02 1.09±0.04 1.02±0.02 0.95±0.02 0.89±0.02
532cross >700 >700 >800 >800 >1000 >800
1064total 1.03±0.02 0.80±0.03 1.08±0.02 0.94±0.04 1.13±0.03 to be measured
data analysis under the assumption of pure Rayleigh depolar-ization in an aerosol-free height range (Behrendt and Naka-mura, 2002). However, this method includes large uncertain-ties (e.g., Reichardt, 2003).
An alternative method is the 190◦-calibration (formerly
known as ±45◦-calibration, Freudenthaler et al., 2009b; Freudenthaler, 2016). In order to include this method to the automatic measurement procedure of Polly, a remote-controlled rotary mount with a polarizer close to the focal plane of the receiver telescope was added to the system. This sheet polarizer (LPG23, ITOS GmbH, Mainz, Germany) is equipped with an off-center hole to measure without the po-larizer into the light path in normal mode by rotating the hole onto the optical axis. Three times per day, the polarizer is rotated automatically under+45 and−45◦ with respect to the laser polarization plane in the light path for calibration. Then, the volume linear depolarization ratioδvfrom the ratio δ′=Pc/Pt of the cross-polarized (c) and the total (t) signal
is given by
δV= 1−δ ′/C δ′R
t/C−Rc, (3)
with the absolute calibration
C= 1+Rt 1+Rc
q
δ′+45δ−′45, (4)
following Freudenthaler et al. (2009b). The transmission ra-tios Rt,c for total and cross-polarized radiation were
deter-mined as explained in Sect. 4.2. Figure 10 shows the time se-ries of the determined calibration constantC during routine
measurements of PollyXT_IFT. The constant shows stable
values with a variability caused by the signal noise. Changes of the neutral-density filters in front of the detectors have a significant effect on the calibration constant. For the period from 7 August to 19 October 2012, C was 0.090±0.004, from 19 October to 14 November 2012 0.170±0.008, and from 20 December 2012 to 7 March 2013 0.080±0.01 %. The higher variability in the last period is based on short-time changes in the settings. At the end of November 2012 the fluctuations are caused by low signal-to-noise ratios.
For the error propagation of the volume linear depolariza-tion ratio several aspects need to be taken into account. For example, the experimentally determined Ri values used in
Eq. (3) have a measurement uncertainty which needs to be
C
Aug 2012Sep 2012Oct 2012Nov 2012Dec 2012Jan 2013Feb 2013Mar 2013
0.00 0.35
0.30
0.25
0.20
0.15
0.10
0.05 0.40
Figure 10.Time series of the routinely determined calibration
con-stantCduring measurements of PollyXT_IFT from August 2012 to
April 2013. Arrows denote adjustments of the neutral-density fil-ters. The variability ofC can attributed to the signal noise during
the individual calibration measurements. Gaps in the time series are caused by measurement interruptions during bad weather.
considered. The laser linear polarization purity, a possible angle between the laser polarization plane and the receiver optics, and the uncertainties involved in the measurement of the calibration constant (see Fig. 10) are further causes of uncertainty. Belegante et al. (2016) recently presented an ex-tended analysis of different depolarization calibration proce-dures and their related uncertainties.
5 Optimization of measurement range
PollyXT was designed to measure primarily tropospheric
aerosols which occur in their highest concentration close to the surface. Hence, certain optical design rules had to be con-sidered. The most critical points concerned the laser beam stability and adjustment, the overlap function, and near-range performance. The latest type of PollyXT is operated
aboard the research vessels Polarstern and Meteor within
There-Table 5.Beam expander of Polly. The first lens is from stock
(Thor-labs, LF4938). The 2 inch lens pair is customized.
Lens type Material Surface radius Thickness Diameter (mm) (mm) (mm)
Meniscus F. silica 150.0; 35.0 3.0 25.4 Air space 549.2
Biconvex CaF2 −529.4; 157.0 7.0 50.8
Air space 7.5
Meniscus N-BAK2 157.0; 397.5 3.7 50.8
fore, measurements are desired from 100 m height up to the tropopause in the marine environment.
5.1 Beam expansion and overlap adjustment
Beam expansion is performed to increase the pointing stabil-ity and to reduce the divergence of the laser beam which was specified to be<1.5 mrad. For PollyXTthe 7 mm beam of the
Inlite-III laser is expanded to 45 mm (factor of approximately 6.5) by a single achromatic beam expander after SHG and THG (E5 in Fig. 3), which reduces the full-angle laser beam divergence to <0.2 mrad. This value is sufficiently small
with respect to the field of view of the receiver telescope of 1.0 mrad. The beam expander consists of three different lens materials for chromatic and spherical correction at the three wavelengths. The design was achieved by optimization calculation with the optical-design software ZEMAX and is given in Table 5.
In the setup of the lidar, remote overlap adjustment can be performed with the beam expander, too. The beam can be aligned by transversely shifting the achromatic lens pair (objective) of the beam expander by using two stepper mo-tors (Engelmann and Althausen, 2014). ZEMAX calcula-tions showed that the beam can be tilted by 3–5 mrad with-out reducing the beam quality, i.e., withwith-out increasing the beam divergence above 0.2 mrad. This way, no further optical steering elements have to be placed after the beam expander. 5.2 Overlap function
Tropospheric aerosol observations with lidar shall provide profiles of the extinction coefficient from the PBL to the tropopause. At low altitudes the measured signals are cor-rupted until the overlap function becomes unity.
In contrast, the height of complete overlap cannot be arbi-trarily low because of the strong dynamic increase of the sig-nal towards the ground (with 1/r2for a ranger) which
can-not be covered by the detectors and data acquisition. From EARLINET workshops in previous years it emerged that such a compromise to cover measurements in the entire tro-posphere with only one receiver telescope is almost impossi-ble. Therefore, it became common practice to operate differ-ent receiver telescopes for differdiffer-ent altitude ranges. Consid-ering the requirements for a compact and easy-to-transport
lidar system, an additional near-range telescope has been in-cluded in the latest design of PollyXT (see Sect. 5.3). The
far-range and primary receiver of the system was designed in such a way that the overlap function of the telescope reaches unity at 800–900 m, while signals up to 20 km can be re-ceived so that the whole troposphere is covered and cali-bration in the Rayleigh regime (Freudenthaler, 2009a; Baars et al., 2016) is possible.
For measurements of quantities that are determined from signal ratios (backscatter coefficient by Raman method, lin-ear depolarization, water-vapor mixing ratio) the height of complete overlap is not as essential as the equality of the overlap function for the separate detection channels. There-fore, the optical paths behind the field stop were designed in such a way that the spread of incident angles of the radia-tion is below 0.6◦at the interference filters so that a height-independent transmission is assured (e.g., Reichardt et al., 2012). Also, the primary mirror is optically imaged onto the photocathodes of the PMTs to prevent height-dependent receiver efficiencies because of detector–surface inhomo-geneities (Freudenthaler, 2004).
5.3 Near-range receiver
In order to fulfill the near-range profiling requirements with PollyXT, a separate 50 mm refracting telescope was included in the design at a close distance of 98 mm from the axis of the laser beam. The conducted near-range observations can be used independently for the lidar data analysis, but provide another chance for data quality control and overlap determi-nation of the far-range receiver as well. The refracting tele-scope consists of an achromatic lens (Thorlabs, AC508-250-A) with a focal length of 250 mm. A 550 µm fiber (numerical aperture 0.22) forms the field stop and transports the light. The field of view of the near-range receiver is 2.2 mrad, and the region of complete overlap was calculated by simulations to be at approximately 120 m. A fiber-optic scrambler using a Fourier lens (Arshinov et al., 2004) has been included in order to remove range-dependent angular distributions of the light when it exits the fiber and passes the adjacent beam separation and interference filters. The scrambler consists of a sapphire ball lens3 of 2 mm diameter which directly links two fiber patch cables (Thorlabs, M37L02). Afterwards, the light passes a dichroic beam splitter and neutral-density and interference filters before the signals are detected at 532 and 607 nm.
Figure 11 shows the simulated and experimentally deter-mined (iterative approach in Wandinger and Ansmann, 2002) overlap functions for the far-range and near-range receiving telescopes. The simulation was performed with help of the software ZEMAX. The optical geometry of the receiver was implemented in the ZEMAX model. The height-depended location and size of a laser-illuminated source plane was
0.0 0.5 1.0 0 1 2 3 4
Near range Far range
Near range Far range Simulated
Measured
Height [m]
Overlap function
Backsc. cf. [Mm
-1sr
-1]
0200 400 600 800 1000 1200
Figure 11.Left: simulated (thin, black) and experimentally
deter-mined (thick, green) overlap functions of far-range and near-range telescopes of PollyXT_OCEANET. Right: Backscatter coefficient at 532 nm derived with the Klett method (lidar ratio: 30 sr, no overlap correction performed) from far-range (thick, dark green) and near-range (thin, light green) signal from a measurement aboard RV Me-teoron 5 May 2013 form 22:00–22:30 UTC.
culated and the overlap function was determined by Ray-tracing from this plane towards the detector surface. Special coating effects (at mirrors, lenses, and interference filters) and the effect of spatially non-homogeneous photo cathodes of the PMTs were neglected for the simulation. A tilt of the laser beam towards the telescope axis of 0.3 mrad was as-sumed. Simulation and experimental results agree and thus show a good alignment of the system. It remains unclear where the discrepancy of 5 % of the simulated and measured far-range overlap functions above 600 m height originates. Technically, it could be caused by a slightly de-focused tele-scope. But due to the precise alignment procedure of the field-stop diaphragm (focal-position accuracy ±0.2 mm), it is more likely caused either by a wrong assumption of the li-dar ratio during the experimental measurement of the overlap function or by a different alignment of the laser-beam angle with respect to the telescope axis than used in the simulation (0.3 mrad). Further investigation might be needed.
The particle backscatter coefficient at 532 nm is also shown for the far and near range. The correction of the over-lap function was not performed in order to show the mea-surement differences arising from the two telescopes.
6 Case study onboard of RVMeteor
A detailed analysis of all optical parameters which can be retrieved with PollyXT_OCEANET is presented in Fig. 12.
In May 2013, the German research vessel Meteor performed an Atlantic transect cruise at 14.5◦N from the Caribbean is-land of Guadeloupe to the Cape Verde isis-land of São Vicente. The lidar was operated continuously during the cruise in
or-der to study Saharan dust during its transport westward to Central America (Kanitz et al., 2014). On 9 May 2013 about 3000 km from the west African coast (14.5◦N, 44.1◦W) the first Saharan dust plume was observed. The layer extended from 1.7 to 3.4 km height with maximum extinction coeffi-cients of 80 and 75 Mm−1at 355 and 532 nm, respectively.
The aerosol optical depth of the dust layer was approximately 0.07±0.01 at 532 nm.
Polly allows us to measure particle backscatter coeffi-cients at three wavelengths (Fig. 12a) and the corresponding backscatter-related Ångström exponents (Ångström, 1964) with very high vertical resolution. The backscatter-related Ångström exponents describe the spectral dependence of the backscatter coefficients (Fig. 12d, thick blue and red curves). Furthermore, the climate-relevant particle extinc-tion coefficients at 355 and 532 nm are determined with the Raman lidar method (Ansmann et al., 1992; Ansmann and Müller., 2005) as well as the corresponding extinction-related Ångström exponent (Fig. 12d, thin blue curve). From the 355 and 532 nm backscatter and extinction coefficients the extinction-to-backscatter ratios (lidar ratios) are com-puted (shown in Fig. 12c). Together with the particle depo-larization ratios in Fig. 12e and the Ångström exponents in Fig. 12d, the lidar ratios serve as a basis for an unambigu-ous aerosol typing (Müller et al., 2007; Tesche et al., 2011; Burton et al., 2012; Groß et al., 2013).
Lidar ratios of 50±5 (for 355 nm) and 39±5 sr (for 532 nm) in the lofted dust plume at 2–3 km height together with particle linear depolarization ratios of 0.16±0.02 and 0.175±0.01 at 355 and 532 nm, respectively, and extinction-related Ångström exponents of 0.65±0.2 indicate an aged dust plume mixed with biomass-burning aerosol originating from fires in the African tropical belt (Tesche et al., 2011; Ansmann et al., 2009). Pure Saharan dust plumes caused extinction-related Ångström exponents of 0.0±0.2 after Tesche et al. (2009). The interpretation of the backscatter-related Ångström exponents is complicated by the fact that dust particles are irregularly shaped and shape-related opti-cal effects are different for different wavelengths (Gasteiger et al., 2011). However, in combination with the other opti-cal parameters we conclude that the low backscatter-related 355/532 nm Ångström exponents of −0.01±0.17 indicate comparably large smoke particles mixed with dust. Accord-ing to Müller et al. (2007), smoke particles grow durAccord-ing transport by water uptake.
The aged lofted plume is well mixed (after the transport of 3000–5000 km from Africa according to backward trajec-tories) as the almost height-independent water-vapor mixing ratio (Fig. 12f) indicates. For the relative humidity we ob-tained values of 40 % at 2 km height up to 60 % at 3 km from radiosondes launched aboardMeteorwhich again indicates a
continental African origin of the air mass.
par-H
ei
g
h
t
[k
m
]
0 20 40 60 80 0 20 40 60
0 2 4
0 1 2 3 4 5
355 nm 532 nm 1064 nm
532 nm (near-range telescope)
-1 0 1 2
Ext. 355–532 Bsc. 355–532 Bsc. 532–1064
0 0.1 0.2
Volume 355 nm Volume 532 nm Particle 355 nm Particle 532 nm
0 5 10 15 20
Lidar Sonde
Backsc. coeff. [Mm-1sr-1] Extinction coeff. [Mm-1] Lidar ratio [sr] Ångström exponent Depolarization ratio Mixing ratio [g kg-1]
(a) (b) (c) (d) (e) (f)
Figure 12.Optical and meteorological products obtained on board of RVMeteorbetween 23:15 and 23:58 UTC on 9 May 2013. A Saharan dust plume above the marine boundary layer was tracked. Shown are from left to right the particle backscatter coefficient, the particle extinction coefficient, the corresponding lidar ratios and Ångström exponents, the volume and particle linear depolarization ratios, and the water-vapor mixing ratio. The error bars for the water vapor, the extinction, and backscatter coefficients include the signal-noise and for the latter one also the Rayleigh-calibration errors. Those errors propagate to lidar ratio and Ångström exponent. The error bars of the depolarization ratio additionally include the calibration error ofC, the uncertainties ofRi, and for the particle depolarization also the
uncertainty of the backscatter coefficient.
ticles. Spherical particles (marine and smoke) dominated here and cause a particle linear depolarization ratio of <
0.05 at heights below 1 km. Comparably low lidar ratios of
20±10 sr and Ångström exponents around 1 also indicate a mixture of these particle components. The water-vapor mix-ing ratio is almost height independent in the lowest 500 m, where also the 532 nm backscatter coefficient (from near-range and far-near-range channels) indicates well-mixed condi-tions, but decreases with height as a result of mixing of drier free-tropospheric with humid boundary-layer air.
A detailed analysis of the two-wavelength depolarization-ratio profiles will allow us to quantify the contribution of ma-rine particles, smoke, fine-mode and coarse-mode dust to the observed optical properties (Mamouri and Ansmann, 2014). The Meteor cruise lasted from 28 April to 23 May 2013.
Based on measurements shown in Fig. 12, a detailed char-acterization of dust/smoke/marine particle plumes in terms of optical and derived microphysical particle properties will be performed and afterwards compared to products obtained with atmospheric circulation models. Kanitz et al. (2014) showed first intercomparisons of an ongoing analysis.
7 Current developments and outlook
In the last decade, a simple Raman lidar prototype was further developed to a mature, automated multiwavelength Raman and polarization lidar with two receiver units and 3+2+2+2+1 capabilities (backscatter, extinction, depo-larization, near-range telescope, and water vapor). The sys-tem combines latest EARLINET lidar quality standards in a
stand-alone design. Until now, nine Polly systems exist. Two additional systems will be built for TROPOS in the near fu-ture. One will supplement our mobile LACROS facility and the second lidar will be permanently installed at the Cape Verde Atmospheric Observatory, Mindelo.
The constant distribution of the idea of Polly may re-sult in a small network of lidar stations around the world with unified systems and unified data analysis along the line of the Aerosol Robotic Network (AERONET). Up to now, all Polly measurements are collected within PollyNET and quicklooks of the data products are available for the sci-entific community and the general public in near-real time (http://polly.tropos.de). Going even a step further, aerosol transport models can be potentially validated online or even assimilate the data and benefit from PollyNET. Furthermore, the data can be used for ground truthing of current and up-coming satellite missions.
at-tempted. Our colleagues from the University of Warsaw want to expand the near-range measurements to four channels to investigate the spectral behavior of absorbing aerosols in the planetary boundary layer and to enhance the overlap between ground-based remote sensing and in situ measurements. The network of fully autonomous Polly systems with its near-real-time observing capabilities is expected to play an in-creasing role in the establishment of a long-term, sustainable research infrastructure for aerosol and cloud profiling in the framework of ACTRIS.
Data availability
All raw data measured from PollyNET systems are automat-ically transferred to a public server (http://polly.tropos.de) where data quick looks are generated and displayed on a near real-time basis. In addition, profiles of backscatter and ex-tinction coefficient and of the depolarization ratio are calcu-lated by an automated algorithm and are presented in a graph-ical form (Baars et al., 2016). However, careful interpretation of automatically generated data is advised. For more infor-mation on data availability, interpretation, and on data policy please contact the responsible station principal investigator and the website.
Acknowledgements. We are deeply grateful to Volker Freuden-thaler, who spends endless working hours to unify and improve the quality of lidar systems in EARLINET, for the outstanding collaboration. We also want to thank our collaboration partners for their confidence in our work and for their positive feedback. No Polly would exist without the outstanding effort of the TRO-POS workshops and administration, first of all Conny Kurze and Ingolf Bernhardt. The research leading to these results has received funding from ACTRIS in the the European Union Seventh Framework Programme (FP7/2007-2013) under grant agreement no. 262254, from ACTRIS-2 in HORIZON 2020 under grant agreement no. 654109, from the Gottfried Willhelm Leibniz Association (OCEANET project in the framework of PAKT), and in the framework of BEYOND (funded under: FP7-REGPOT-2012-2013-1) under grant agreement no. 316210.
Edited by: M. Rapp
References
Althausen, D., Engelmann, R., Baars, H., Heese, B., Ansmann, A., Müller, D., and Komppula, M.: Portable Raman lidar PollyXT for automated profiling of aerosol backscatter, extinction, and depolarization, J. Atmos. Ocean. Tech., 26, 2366–2378, doi:10.1175/2009JTECHA1304.1, 2009.
Althausen, D., Engelmann, E., Baars, H., Heese, B., Kanitz, T., Komppula, M., Giannakaki, E., Pfüller, A., Silva, A. M., Preißler, J., Wagner, F., Rascado, J. L., Pereira, S., Lim, J. H., Ahn, J. Y., Tesche, M., and Stachlewska, I. S.: PollyNET – a net-work of multiwavelength polarization Raman lidars, in: Proc.
SPIE 8894, Lidar Technologies, Techniques, and Measurements for Atmospheric Remote Sensing IX, 88940I, 22 October 2013, Dresden, Germany, 8894, doi:10.1117/12.2028921, 2013. Ångström, A.: The parameters of atmospheric turbidity, Tellus, 16,
64–75, doi:10.1111/j.2153-3490.1964.tb00144.x, 1964. Ansmann, A. and Müller, D.: Lidar and atmospheric aerosol
parti-cles, in: Lidar – Range-Resolved Optical Remote Sensing of the Atmosphere, edited by: Weitkamp, C., Springer Series in Op-tical Sciences, New York, 105–141, doi:10.1007/0-387-25101-4_4, 2005.
Ansmann, A., Wandinger, U., Riebesell, M., Weitkamp, C., and Michaelis, W.: Independent measurement of extinction and backscatter profiles in cirrus clouds by using a combined Ra-man elastic-backscatter lidar, Appl. Optics, 31, 7113–7131, doi:10.1364/AO.31.007113, 1992.
Ansmann, A., Baars, H., Tesche, M., Müller, D., Althausen, D., En-gelmann, R., Pauliquevis, T., and Artaxo, P.: Dust and smoke transport from Africa to South America: lidar profiling over Cape Verde and the Amazon rainforest, Geophys. Res. Lett., 36, L11802, doi:10.1029/2009GL037923, 2009.
Ansmann, A., Tesche, M., Groß, S., Freudenthaler, V., Seifert, P., Hiebsch, A., Schmidt, J., Wandinger, U., Mattis, I., Müller, D., and Wiegner, M.: The 16 April 2010 major volcanic ash plume over central Europe: EARLINET lidar and AERONET photome-ter observations at Leipzig and Munich, Germany, Geophys Res. Lett., 371, L13810, doi:10.1029/2010GL043809, 2010. Ansmann, A., Tesche, M., Seifert, P., Groß, S., Freudenthaler, V.,
Apituley, A., Wilson, K. M., Serikov, I., Linné, H., Heinold, B., Hiebsch, A., Schnell, F., Schmidt, J., Mattis, I., Wandinger, U., and Wiegner, M.: Ash and fine-mode particle mass profiles from EARLINET-AERONET observations over central Europe after the eruptions of the Eyjafjallajökull volcano in 2010, Geophys. Res. Lett., 116, D00U02, doi:10.1029/2010JD015567, 2011. Arshinov, Y., Bobrovnikov, S., Serikov, I., Althausen, D.,
Ans-mann, A., and Mattis, I.: Optic-fiber scramblers and a fourier transform lens as a means to tackle the problem on the overlap factor of LIDAR, in: 22nd Internation Laser Radar Conference (ILRC 2004). Proceedings of the Conference held 12–16 July, 2004 in Matera, Italy, edited by: Pappalardo, G. and Amodeo, A., ESA SP-561, European Space Agency, Paris, 227–230, 2004. Baars, H., Ansmann, A., Althausen, D., Engelmann, R., Artaxo, P.,
Pauliquevis, T., and Souza, R.: Further evidence for significant smoke transport from Africa to Amazonia, Geophys. Res. Lett., 382, L20802, doi:10.1029/2011GL049200, 2011.
Baars, H., Ansmann, A., Althausen, D., Engelmann, R., Heese, B., Müller, D., Artaxo, P., Paixao, M., Pauliquevis, T. M., and Souza, R.: Aerosol profiling with lidar in the Amazon Basin during the wet and dry season, J. Geophys. Res., 117, D21201, doi:10.1029/2012JD018338, 2012.
of the first decade of PollyNET: an emerging network of auto-mated Raman-polarization lidars for continuous aerosol profil-ing, Atmos. Chem. Phys., 16, 5111–5137, doi:10.5194/acp-16-5111-2016, 2016.
Behrendt, A. and Nakamura, T.: Calculation of the calibration con-stant of polarization lidar and its dependency on atmospheric temperature, Opt. Express, 10, 805–817, 2002.
Belegante, L., Bravo-Aranda, J. A., Freudenthaler, V., Nicolae, D., Nemuc, A., Alados-Arboledas, L., Amodeo, A., Pappalardo, G., D’Amico, G., Engelmann, R., Baars, H., Wandinger, U., Pa-payannis, A., Kokkalis, P., and Pereira, S. N.: Experimental as-sessment of the lidar polarizing sensitivity, Atmos. Meas. Tech. Discuss., doi:10.5194/amt-2015-337, in review, 2016.
Böckmann, C., Wandinger, U., Ansmann, A., Bösenberg, J., Amiridis, V., Boselli, A., Delaval, A., De Tomasi, F., Frioud, M., Grigorov, I. V., Hågåd, A., Horvat, M., Iarlori, M., Komguem, L., Kreipl, S., Larchevêque, G., Matthias, V., Pa-payannis, A., Pappalardo, G., Rocadenbosch, F., Rodrigues, J. A., Schneider, J., Shcherbakov, V., and Wiegner, M.: Aerosol lidar intercomparison in the framework of the EAR-LINET project. 2. Aerosol backscatter algorithms, Appl. Optics, 43, 977–989, 2004.
Bösenberg, J. and Hoff, R.: Plan for the implementation of the GAW aerosol lidar observation network GALION, World Meteorolog-ical Organization Rep., Hamburg, Germany, 178, 53 pp., 2008. Burton, S. P., Ferrare, R. A., Hostetler, C. A., Hair, J. W., Rogers, R.
R., Obland, M. D., Butler, C. F., Cook, A. L., Harper, D. B., and Froyd, K. D.: Aerosol classification using airborne High Spec-tral Resolution Lidar measurements – methodology and exam-ples, Atmos. Meas. Tech., 5, 73–98, doi:10.5194/amt-5-73-2012, 2012.
D’Amico, G., Amodeo, A., Baars, H., Binietoglou, I., Freuden-thaler, V., Mattis, I., Wandinger, U., and Pappalardo, G.: EAR-LINET Single Calculus Chain – overview on methodology and strategy, Atmos. Meas. Tech., 8, 4891–4916, doi:10.5194/amt-8-4891-2015, 2015.
D’Amico, G., Amodeo, A., Mattis, I., Freudenthaler, V., and Pap-palardo, G.: EARLINET Single Calculus Chain – technical – Part 1: Pre-processing of raw lidar data, Atmos. Meas. Tech., 9, 491– 507, doi:10.5194/amt-9-491-2016, 2016.
Donovan, D. P., Whiteway, J. A., and Carswell, A. I.: Correction for nonlinear photon-counting effects in lidar systems, Appl. Optics, 32, 6742–6753, doi:10.1364/AO.32.006742, 1993.
Duck, T., Firanski, B., Lind, F., and Sipler, D.: Aircraft-protection radar for use with atmospheric lidars, Appl. Optics, 44, 4937– 4945, doi:10.1364/AO.44.004937, 2005.
Engelmann, R. and Althausen, D.: Lidar system including an optical device with a transmitter and a receiver, EU Patent EP2172790 B1, EPAB European Patent Applications and Specifications, Mu-nich, Germany, 2014.
Flentje, H., Heese, B., Reichardt, J., and Thomas, W.: Aerosol profiling using the ceilometer network of the German Meteo-rological Service, Atmos. Meas. Tech. Discuss., 3, 3643–3673, doi:10.5194/amtd-3-3643-2010, 2010.
Foth, A., Baars, H., Di Girolamo, P., and Pospichal, B.: Water vapour profiles from Raman lidar automatically calibrated by mi-crowave radiometer data during HOPE, Atmos. Chem. Phys., 15, 7753–7763, doi:10.5194/acp-15-7753-2015, 2015.
Freudenthaler, V.: Effects of spatially inhomogeneous photomulti-plier sensitivity on LIDAR signals and remedies, in: Proceedings of the 22nd International Laser Radar Conference (ILRC 2004) held 12–16 July, 2004 in Matera, Italy, edited by: Pappalardo, G. and Amodeo, A., European Space Agency, Paris, 37 pp., ESA SP-561, 2004.
Freudenthaler, V.: The telecover test: a quality assurance tool for the optical part of a lidar system, in: Reviewed and Revised Papers Presented at the 24th International Laser Radar Confer-ence, Boulder, Colorado, USA, 23–27 June 2008, Boulder, Col-orado, USA, presentation: S01P-30, available at: http://epub.ub. uni-muenchen.de/12958/ (last access: 20 April 2015), 2008. Freudenthaler, V.: Lidar Rayleigh-fit criteria, in: EARLINET-ASOS
7th Workshop, 09–11 February, Madrid, Spain, available at: https://epub.ub.uni-muenchen.de/12970 (last access: 19 Febru-ary 2016), 2009a.
Freudenthaler, V., Esselborn, M., Wiegner, M., Heese, B., Tesche, M., Ansmann, A., Müller, D., Althausen, D., Wirth, M., Fix, A., Ehret, G., Knippertz, P., Toledano, C., Gasteiger, J., Garhammer, M., and Seefeldner, M.: Depolarization ratio pro-filing at several wavelengths in pure Saharan dust during SAMUM 2006, Tellus B, 61, 165–179, doi:10.1111/j.1600-0889.2008.00396.x, 2009b.
Freudenthaler, V., Groß, S., Engelmann, R., Mattis, I., Wandinger, U., Pappalardo, G., Amodeo, A., Giunta, A., D’Amico, G., Chaikovsky, A., Osipenko, F., Slesar, A., Nico-lae, D., Belegante, L., Talianu, C., Serikov, I., Linne, H., Jansen, F., Wilson, K., de Graaf, M., Apituley, A., Trickl, T., Giehl, H., and Adam, M.: EARLI09 – direct intercomparison of eleven EARLINET lidar systems, in: Proceedings of the 25th International Laser Radar Conference, 5–9 July 2010, St.-Petersburg, Russia, ISBN: 978-5-94458-109-9, 891–894, 2010.
Freudenthaler, V.: About the effects of polarising optics on lidar signals and the190-calibration, Atmos. Meas. Tech. Discuss.,
doi:10.5194/amt-2015-338, in review, 2016.
Gasteiger, J., Wiegner, M., Groß, S., Freudenthaler, V., Toledano, C., Tesche, M., and Kandler, K.: Modelling lidar-relevant optical properties of complex mineral dust aerosols, Tellus B, 63, 725–741, doi:10.1111/j.1600-0889.2011.00559.x, 2011.
Groß, S., Esselborn, M., Weinzierl, B., Wirth, M., Fix, A., and Pet-zold, A.: Aerosol classification by airborne high spectral reso-lution lidar observations, Atmos. Chem. Phys., 13, 2487–2505, doi:10.5194/acp-13-2487-2013, 2013.
Johnson, F. A., Jones, R., McLean, T. P., and Pike, E. R.: Dead-time corrections to photon counting distributions, Phys. Rev. Lett., 16, 589–592, doi:10.1103/PhysRevLett.16.589, 1966.
Kanitz, T., Seifert, P., Ansmann, A., Engelmann, R., Althausen, D., Casiccia, C., and Rohwer, E. G.: Contrasting the impact of aerosols at northern and southern midlatitudes on het-erogeneous ice formation, Geophys. Res. Lett., 38, L17802, doi:10.1029/2011GL048532, 2011.