53
Scientific Bulletin of the „Petru Maior” University of Tîrgu Mureş Vol. 11 (XXVIII) no. 1, 2014
ISSN-L 1841-9267 (Print), ISSN 2285-438X (Online), ISSN 2286-3184 (CD-ROM)
T-WAVE DETECTION USING THE EMPIRICAL MODE
DECOMPOSITION
Ferenc Emil MOZES
1, János SZALAI
21“Petru Maior” University of Tîrgu Mureş Nicolae Iorga Street, no.1, 540088, Tîrgu Mureş, Romania
1
Technical University of Cluj-Napoca
1 Mihail Kogălniceanu, 400084 Cluj-Napoca, Romania
2
Abstract
Identifying key elements of the ECG signal in modern day's diagnostic devices is crucial. Making a preliminary assessment of a patient during emergency situations, i.e. before arriving to the hospital, is starting to be a generally accepted practice in more and more countries.
This article proposes a possible method of differentiating the T-wave from other features of the ECG signal based on the empirical mode decomposition. The method identifies the T-waves by removing the QRS-complexes from the signal and computing the intrinsic mode functions of this modified signal. These intrinsic mode functions offer a characteristic waveform containing the T-wave. An average positive predictibility of 95.99% is obtained.
Key words: ECG processing, empirical mode decomposition, intrinsic mode function, Shannon energy, T-wave
1. Introduction
The electrocardiogram (ECG) signal is used by physicians continuously since its discovery more than a hundred years ago. It is a non-invasive procedure that can help in unequivocal detection of some heart conditions either during ambulatory examination or in emergency cases. Telecommunication systems are involved in emergency interventions in order to prepare the emergency units in hospitals for the arrival of a patient [10, 12]. This is the reason why it has become essential to be able to send data related to rapid examination. One of these examinations is the ECG which is needed to be interpreted rapidly by paramedics who assist the patients on its way to the hospital. In order to facilitate their work, automatic ECG processing algorithms are being developed for a few years now.
The most critical elements of the ECG are the P and T-waves and the QRS-complex as well as some intervals between these waves. There are many algorithms used to detect characteristic ECG waves. Specifically for the T-wave, there are methods based on pattern recognition [15], wavelet transform [9], low-pass differentiation [6], and extended Kalman filter [11] or on Bayesian estimation [8].
The aim of the present paper is to describe a method of identification of T-waves in an ECG signal by making use of the empirical mode decomposition.
It is not a novel idea to use the empirical mode decomposition for ECG signal processing, there were successful attempts to detect QRS-complexes [13] and even identify ventricular fibrillation [1].
2. Basic understanding of the ECG
The electrocardiogram is a signal collected from the skin of the patient. It reflects the electrical activity of the heart during an examination. It is usually collected from multiple points on the patient's chest and limbs and the measured voltages are transformed into voltage differences called leads. The most common ECG type is the 12-lead ECG where 10 electrodes are used to collect information for 12 leads [3], but there are other methods too, such as the two lead ECG which results in modified leads in terms of the 12 lead test.
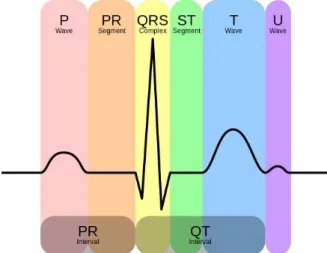
Figure 1 presents a typical heart beat as seen on an ECG recording with its most important elements. The size and duration of these elements can be used to characterize and differentiate between certain heart conditions.
54 present or not. The positive outcome of such a test may help patients to prevent sudden cardiac death.
Fig. 1: Elements of a typical ECG signal (image source: http://commons.wikimedia.org/wiki/File:EKG_Complex_
en.svg)
3. The empirical mode decomposition
The empirical mode decomposition is a relatively new type of signal decomposition method that needs no prior knowledge about the signal, thus being truly adaptive [4, 5]. The results of the decomposition are called intrinsic mode functions (EMD) with the following fundamental properties:
1. the number of local maxima equals the number of local minima or they differ at most by one;
2. the upper and lower envelopes of an intrinsic mode function are symmetric with respect to zero.
There is no analytical description for this method; instead it is described by an iterative algorithm.
First, the upper and lower envelopes are approximated using cubic splines. These envelopes connect local maxima and local minima, respectively. Then the mean of these two envelopes is extracted from the original signal. These steps are then repeated until a stopping criterion [4] is fulfilled. Equation 1 describes this stopping criterion.
T k k T t k kt
h
t
h
t
h
SD
0 2 1 0 2 1)
(
|
)
(
)
(
|
(1))
(
1t
h
k andh
k(
t
)
are consecutive approximations of an IMF and
is the convergence limit. This process of extracting an IMF from the signal is called sifting [5, 7].Once the sifting process is done, the resulting IMF is subtracted from the signal and the whole process is repeated until the residue is a monotonic function [4].
4. The proposed method
After an analysis of the intrinsic mode functions of an ECG we found that in order to successfully identify the T-waves, the removal of the QRS-complexes is necessary. They tend to appear in every IMF of the signal, thus introducing confusion when trying to find distinctive features that refer to the T-waves.
In order to achieve this, the QRS-complexes are approximated by the sum of first three IMFs of the signal, similar to [13]. In order to be able to determine exactly the boundaries of the QRS-complexes, the Shannon energy envelope is computed for the sum of the first three IMFs [13, 14] as described by eq. 2.
2 2 3 1log
)
(
c
c
E
t
IMF
c
S i i
(2)The obtained energy envelope is then filtered with a threshold filter, keeping only those values of the energy which are greater than the mean power of the whole energy envelope. Equation 3 presents this thresholding operation.
otherwise
P
t
E
t
E
t
E
N
i
E
P
mean S S thr S N i S mean,
0
)
(
),
(
)
(
)
(
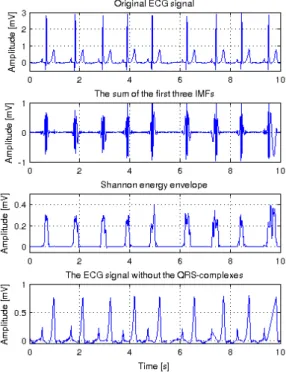
_ 1 (3)After the intervals – corresponding to the QRS-complexes – had been identified, they are cut from the original signal. The gaps that appear in the signal as a result of this process are filled with a linear segment as this rough approximation does not affect significantly the later steps of the algorithm. Figure 2 shows how the QRS-complexes are gradually extracted from the ECG signal.
After a clean (i.e. QRS-complex free) signal is obtained, its IMFs are computed once again so the T-waves can be identified. In order to do this, the sum of the 5th, 6th and 7th IMFs is computed and positioned over the original signal. Then, as QRS-complex positions are already known, the peaks following QRS-complexes are marked as T-waves. The choice of the 5th, 6th and 7th IMFs can be explained by the fact the high frequency components of the ECG signal always concentrate in the first IMFs, leaving lower frequency components for the higher order IMFs. Figure 3 shows how T-waves are identified.
5. Experimental verification
55 The first one targeted the verification of the number of recognized T-waves. Eight ECG signals of
Fig. 2:The steps needed to eliminate QRS-complexes from an ECG signal.
Fig. 3: Detecting the T-waves: the first peak after a QRS complex is considered a T-wave.
5 minutes were used during this test. The signals were fed to the algorithm in one minute chunks.
The second experiment was meant to verify the robustness of the algorithm with respect to the signal to noise ratio (SNR) of the signals.
To accomplish the second test, a base signal was chosen (sel16876, from the QT database), with a duration of one minute. After filtering the signal by applying a high pass filter with a cut-off frequency
f
c
0
.
5
Hz
, a low pass filter with a cut-off frequencyf
c
30
Hz
and a baseline drift removal filter, the signal was corrupted with noise by adding Gaussian noise of normal distribution of different amplitudes to the signal, thus obtaining different SNR values. For the first experiment only a baseline drift removal was applied.Table 1 presents data obtained for the first experiment and table 2 contains the data for the second one. Specificity was calculated as described by eq. 4, where FP represents the number of false positive results, FN is the number of the false negative results, TP is the number of the true positive results and TN is the number of the true negative results, +P is the positive predictability [16] and S represents sensitivity [16].
FN
TP
TP
S
FP
TP
TP
P
(4)
Table 1: Experimental results showing the positive predictability and sensitivity of the algorithm
Signal T-waves
TP FP FN +P [%]
S [%]
123 254 242 12 0 95.27 100
14157 359 327 32 0 91.08 100 16786 302 279 23 0 92.38 100
871 318 315 2 1 99.05 99.68
16420 351 347 4 0 99.36 100
a_103 356 336 20 0 94.38 100 a_231 327 317 10 0 96.94 100
a_113 288 287 1 0 99.65 100
Total 2555 2450 104 1 95.99 99.96
Table 2: Results reflecting the behavior of the algorithm relative to the SNR of the ECG.
SNR [dB]
T- waves
TP FP FN +P [%]
S [%]
5 57 20 36 1 35.71 95.23
8 57 36 20 1 64.28 97.29
12 57 50 7 0 87.71 100
18 57 56 1 0 98.24 100
24 57 55 2 0 96.49 100
6. Conclusions
An algorithm for detecting the T – waves of an ECG signal was successfully developed by making use of the combination of intrinsic mode functions provided by the empirical mode decomposition. Eight ECG signals were analyzed, having a total of 2555 T – waves. Out of these 2555 T – waves 2450 were correctly recognized (true positives), 104 of them were incorrectly detected (false positives) and 1 was missed (false negatives). Based on the analyzed signals, the algorithm has a 95.99% positive predictibility and 99.96% sensitivity. Both positive and negative T-waves were recognized, but no biphasic T-waves.
56 developed algorithm shows a high level of noise-resistance.
Acknowledgement
The research work of Ferenc Emil Mozes was supported by the European Union and the State of Hungary, co-financed by the European Social Fund in the framework of TÁMOP-4.2.4.A/ 2-11/1-2012-0001 ‘National Excellence Program’.
References
[1] Anas, E. M. A., Lee, S. Y. and Hasan, K. (2010), Sequential algorithm for life threatening cardiac pathologies detection based on mean signal strength and EMD functions, BioMedical Engineering Online, vol. 9, no. 1, pp. 43-65 [2] Goldberger, A. L., Amaral, L. A. N., Glass, L.,
Hausdorff, J. M., Ivanov, P. Ch., Mark, R. G., Mietus, J. E., Moody, G. B., Peng, C. K., Stanley, H. E. (2000), PhysioBank,
PhysioToolkit, and PhysioNet: Components of a New Research Resource for Complex
Physiologic Signals, Circulation, vol. 101, no. 23, pp. e215-e220 [Circulation Electronic Pages; http://circ.ahajournals.org/cgi/content/full/101/2 3/e215]
[3] Houghton, A. R. and Gray, D. (2003), Making sense of the ECG, CRC Press; 2nd edition. [4] Huang, N.E., Shen, Z., Long, S.R., Wu, M.C.,
Shih, H.H., Zheng, Q., Yen, N.C., Tung, C.C., and Liu, H.H. (1998), The empirical mode decomposition and the Hilbert spectrum for nonlinear and non-stationary time series analysis, Proceedings of the Royal Society London A, vol. 454, pp. 903–995.
[5] Huang, N.E., Wu, Z., Long, S.R., Arnold, K.C., Chen, X., and Blank, K. (2009), On instantaneous frequency, Advances in Adaptive Data Analysis, vol. 1, no. 2, pp. 177–229. [6] Laguna, P. et al. (1990), New algorithm for QT
interval analysis in 24 hour Holter ECG: Performance and applications, Medical and Biological Engineering and Computing, vol. 28, issue 1, pp. 67-73.
[7] Li, H., Zhang, Y., and Zheng, H. (2007).
Hilbert-Huang transform and marginal spectrum for detection and diagnosis of
localized defects in roller bearings. Journal of Mechanical Science and Technology, vol. 23, no. 2, pp. 291–301.
[8] Lin, C. et al. (2010), P and T wave delineation in ECG signals using a Bayesian approach and a partially collapsed Gibbs sampler, IEEE Transactions on Biomedical Engineering, vol. 57, no. 12, pp. 2840-2849.
[9] Mart, J. P. et al. (2004), A Wavelet-based ECG delineator: Evaluation on standard databases,
IEEE Transactions on Biomedical Engineering, vol. 51, issue 4, pp. 570-581.
[10] Pattichis, C.S., Kyriacou, E., Voskarides, S., Pattichis, M.S., Istepanian, R. and Schizas, C.N. (2002), Wireless telemedicine systems: an overview, IEEE Antennas and Propagation Magazine, vol.44, no.2, pp.143-153.
[11] Sayadi, O. et al. (2009), A model-based
Bayesian framework for ECG beat
segmentation, Physiological Measurement, vol. 30, no. 3, pp. 335-352.
[12] SungHye H., SangYong K., Jungchae K., Dongkyu L., SeokMyung J., DongKeun K., Yoo, S.K. (2009), Portable emergency telemedicine system over wireless broadband and 3G networks,Engineering in Medicine and Biology Society, EMBC 2009. Annual International Conference of the IEEE , pp.1250-1253.
[13] Taouli, S. A. and Bereksi-Reguig, F. (2011),
Detection of QRS Complexes in ECG Signals Based on Empirical Mode Decomposition, Global Journal of Computer Science and Technology, vol. 11, no. 20, pp. 10-17.
[14] Tseng, Y. L., Ko, P. Y. and Jaw, F. S. (2012),
Detection of the third and fourth heart sounds using Hilbert-Huang transform, BioMedical Engineering Online, vol. 11, no. 1, pp. 8-21. [15] Trahanias, P. et al. (1990), Syntactic Pattern
Recognition of the ECG, IEEE Transactions on Pattern Analysis and Machine Intelligence, vol. 12, issue 7, pp. 648-657.