HESSD
8, 5009–5033, 2011Technical Note: Development of an automated lysimeter
S. Proulx-McInnis et al.
Title Page
Abstract Introduction
Conclusions References
Tables Figures
◭ ◮
◭ ◮
Back Close
Full Screen / Esc
Printer-friendly Version Interactive Discussion
Discussion
P
a
per
|
Dis
cussion
P
a
per
|
Discussion
P
a
per
|
Discussio
n
P
a
per
Hydrol. Earth Syst. Sci. Discuss., 8, 5009–5033, 2011 www.hydrol-earth-syst-sci-discuss.net/8/5009/2011/ doi:10.5194/hessd-8-5009-2011
© Author(s) 2011. CC Attribution 3.0 License.
Hydrology and Earth System Sciences Discussions
This discussion paper is/has been under review for the journal Hydrology and Earth System Sciences (HESS). Please refer to the corresponding final paper in HESS if available.
Technical Note: Development of an
automated lysimeter for the calculation of
peat soil actual evapotranspiration
S. Proulx-McInnis1, A. St-Hilaire1, A. N. Rousseau1, S. Jutras2, G. Carrer1, and G. Levrel1
1
INRS-ETE, 490 de la Couronne, Quebec City, Qu ´ebec, G1K 9A9, Canada
2
Universit ´e Laval, Pavillon Abitibi-Price, 2405 de la Terrasse, Quebec City, Qu ´ebec, G1V 0A6, Canada
Received: 19 February 2011 – Accepted: 8 May 2011 – Published: 17 May 2011 Correspondence to: S. Proulx-McInnis (sandra [email protected])
HESSD
8, 5009–5033, 2011Technical Note: Development of an automated lysimeter
S. Proulx-McInnis et al.
Title Page
Abstract Introduction
Conclusions References
Tables Figures
◭ ◮
◭ ◮
Back Close
Full Screen / Esc
Printer-friendly Version Interactive Discussion
Discussion
P
a
per
|
Dis
cussion
P
a
per
|
Discussion
P
a
per
|
Discussio
n
P
a
per
|
Abstract
A limited number of publications in the literature deal with the measurement of actual evapotranspiration (AET) from a peat soil. AET is an important parameter in the de-scription of water pathways of an ecosystem. In peatlands, where the water table is near the surface and the vegetation is composed of nonvascular plants without stom-5
atal resistance, the AET measurement represents a challenge. This paper discusses the development of an automated lysimeter installed between 12 and 27 July 2010, at a 11-ha bog site, Pont-Rouge (42 km west of Quebec City, Canada). This system was made of an isolated block of peat, maintained at the same water level as the surround-ing water table by a system of submersible pressure transmitters and pumps. The 10
change in water level in millimetres in the isolated block of peat was used to calculate the water lost through evapotranspiration (ET) while accounting the precipitation. The rates of AET were calculated for each day of the study period. Temperature fluctu-ated between 17.2 and 23.3◦C and total rainfall was 43.76 mm. AET rates from 0.6 to 6.9 mm day−1 were recorded, with a ΣAET/ΣP ratio of 1.38. The estimated potential 15
ET (PET) resulting from Thornthwaite’s semi-empirical formula suggested values be-tween 2.8 and 3.9 mm day−1. The average AET/PET ratio was 1.13. According to the literature, the results obtained are plausible. This system, relatively inexpensive and simple to install, may eventually be used to calculate AET on peaty soils in the years to come.
20
1 Introduction
Few studies focus on the measurement or the calculation of actual evapotranspira-tion (AET) of peatland sites (Keleman and Ingram, 1999; Schwaerzel and Bohl, 2003; Schwaerzel et al., 2006; Petrone et al., 2007, 2008). However, this water flux rep-resents a major component of the hydrological budget, making its quantification es-25
HESSD
8, 5009–5033, 2011Technical Note: Development of an automated lysimeter
S. Proulx-McInnis et al.
Title Page
Abstract Introduction
Conclusions References
Tables Figures
◭ ◮
◭ ◮
Back Close
Full Screen / Esc
Printer-friendly Version Interactive Discussion
Discussion
P
a
per
|
Dis
cussion
P
a
per
|
Discussion
P
a
per
|
Discussio
n
P
a
per
waterlogged and the vegetation includes nonvascular plants without stomatal resis-tance. The limited number of publications discussing peatland AET measurements confirms that it is difficult to obtain accurate data to quantify this hydrological process (Keleman and Ingram, 1999; Schwaerzel and Bohl, 2003; Lafleur et al., 2005; Nachabe et al., 2005; Schwaerzel et al., 2006; Petrone et al., 2006, 2007, 2008; Deguchi et al., 5
2008). Potential evapotranspiration (PET) is often calculated using semi-empirical for-mulas (Price and Maloney, 1994; Lott and Hunt, 2001; Pereira and Pruitt, 2004; Lafleur et al., 2005; Sumner and Jacobs, 2005; Schwaerzel et al., 2006; Petrone et al., 2007, 2008; Proulx-McInnis, 2010; Tardif, 2010), but these formulas tend to overestimate ac-tual evapotranspiration (Lafleur et al., 2005; Sumner and Jacobs, 2005; Petrone et al., 10
2007, 2008; Tardif, 2010).
Lysimeters have been used mostly on agricultural or forest soils (e.g. Nachabe et al., 2005; Deguchi et al., 2008; Loheide II, 2008). These devices typically consist of a volume of soil material isolated in the field. The monolith, isolated in a thick geotextile fabric or a container, is not fed by runoff. The idea is to: (1) monitor the mass of the 15
monolith block at regular intervals or (2) maintain the isolated monolith at the same hydrostatic pressure as the surrounding water table or at a fixed level. Water loss can be estimated by simple accounting. In the case of this study, an automated lysime-ter, based on the second approach, was installed in a peatland in southern Quebec (Canada).
20
HESSD
8, 5009–5033, 2011Technical Note: Development of an automated lysimeter
S. Proulx-McInnis et al.
Title Page
Abstract Introduction
Conclusions References
Tables Figures
◭ ◮
◭ ◮
Back Close
Full Screen / Esc
Printer-friendly Version Interactive Discussion
Discussion
P
a
per
|
Dis
cussion
P
a
per
|
Discussion
P
a
per
|
Discussio
n
P
a
per
|
2 Methods
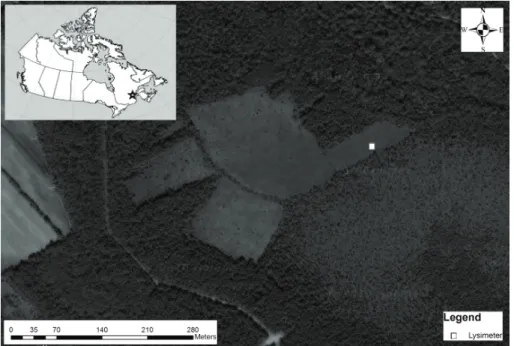
2.1 Study site
The study site selected for the installation of the proposed lysimeter system was a bog located in the town of Pont-Rouge, 42 km west of Quebec City (Quebec, Canada), 46◦44′20.98′′N and 71◦42′44.10′′W (Fig. 1). This site was chosen for its ease of 5
access. The area of the bog, estimated using a GeoEye image (0.50 m resolu-tion), is approximately 11 ha. The water table is relatively high (∼15 cm below the surface), although no structured ponds were found at the site. Typical vegetation of this environment consists of small trees and shrubs (Picea mariana (Mill.) BSP,
Larix laricina (Du Roi) K. Koch and Nemopanthus mucronatus (L.) Trel.), heaths 10
(Ledum groenlandicumOeder,Kalmia polifoliaWangehn.,Kalmia angustifoliaL., Vac-cinium myrthilloides Michx, Vaccinium oxycoccos L. and Chamaedaphne calyculata
(L.) Moench) and sedges (Carex sp. principally) with a significant presence of Sphag-num fuscum(Schimp) Klinggr. and Sphagnum rubellum (Wilson). This macroporous sphagnum-dominated peat has a degree of decomposition varying between 1 and 3 15
on the Von Post scale. According to the climate characteristics of the weather station closest to the site (46◦41′27.00′′N and 71◦58′18.00′′W), the average temperature and precipitation for the 2005–2009 period of the coldest and warmest months (January and August) were−11.8◦C and 51.6 mm and 18.4◦C and 108.1 mm, respectively.
2.2 Operating system
20
The principle of the lysimeter is to isolate a volume of peat material in a waterproof geotextile and to measure the inputs and outputs of water needed to maintain the system at the same water level as that of the surrounding environment. Water transfers are governed by a program operating from a datalogger, sending signals to the pumps which add or remove water. Water volumes in two containers (one providing water to 25
HESSD
8, 5009–5033, 2011Technical Note: Development of an automated lysimeter
S. Proulx-McInnis et al.
Title Page
Abstract Introduction
Conclusions References
Tables Figures
◭ ◮
◭ ◮
Back Close
Full Screen / Esc
Printer-friendly Version Interactive Discussion
Discussion
P
a
per
|
Dis
cussion
P
a
per
|
Discussion
P
a
per
|
Discussio
n
P
a
per
The lysimeter system designed for this study was largely inspired by that of Schwaerzel and Bohl (2003). However, their system was installed for the purpose of describing and quantifying water flows between peat layers, especially in the un-saturated zone. AET rates were noted manually each day and did not need to be as accurate as in the present study. Schwaerzel and Bohl (2003) installed TDR and ten-5
siometers to measure water retention and hydraulic conductivity, but these instruments were not installed in our lysimeter. The purposes of the two lysimeters were thus not the same and our system was greatly simplified. Modifications were made to allow for deployment in remote areas and large data storage requirements. The aim of our study was to measure hydrological budgets over a long period of time. AET rates needed to 10
be accurately recorded without having to be physically close to the instrumentation system.
The environment was also different. Von Post scale of decomposition values were much lower than those recorded by Schwaerzel and Bohl (2003). The acrotelm is not very thick (∼15 cm) and the water is not stored for a long time in the upper part of the 15
peat column. Water redistributes itself fast in a peat column such as the one used in our study (Bragato et al., 1998).
The sealed inlet and outlet reservoirs were installed directly into the ground and had a larger volume than that of the original design, allowing a greater autonomy. The volume of water in each reservoir was measured by pressure sensors and logged 20
in a control unit, instead of manually at fixed hours. The major difference with the Schwaerzel and Bohl (2003) lysimeter was the control unit. Their differential pressure transducer only balanced the water levels between the lysimeter and the surrounding environment and did not log data. The modifications made to the lysimeter offered the advantage of recording data at specific time steps that can be downloaded whenever 25
HESSD
8, 5009–5033, 2011Technical Note: Development of an automated lysimeter
S. Proulx-McInnis et al.
Title Page
Abstract Introduction
Conclusions References
Tables Figures
◭ ◮
◭ ◮
Back Close
Full Screen / Esc
Printer-friendly Version Interactive Discussion
Discussion
P
a
per
|
Dis
cussion
P
a
per
|
Discussion
P
a
per
|
Discussio
n
P
a
per
|
Compared to the lysimeters used by Roulet and Woo (1986) and Petrone et al. (2004), which are simple tanks of peat installed in situ and weighted at a specific time everyday to get the rate of water loss through evapotranspiration, the one installed in this study requires fewer manipulations of the medium. The peat monolith was also much larger.
5
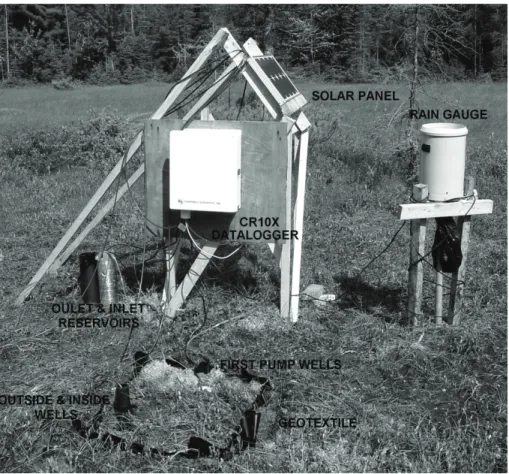
The automated lysimeter system was installed at the study site between 12 and 27 July 2010. A cube of peat with dimensions of 72.0×58.0×48.0 cm was isolated in a geotextile fabric in late June as suggested by Schwaerzel and Bohl (2003). The idea was to preserve as much as possible the natural integrity of the peat column (Fig. 2).
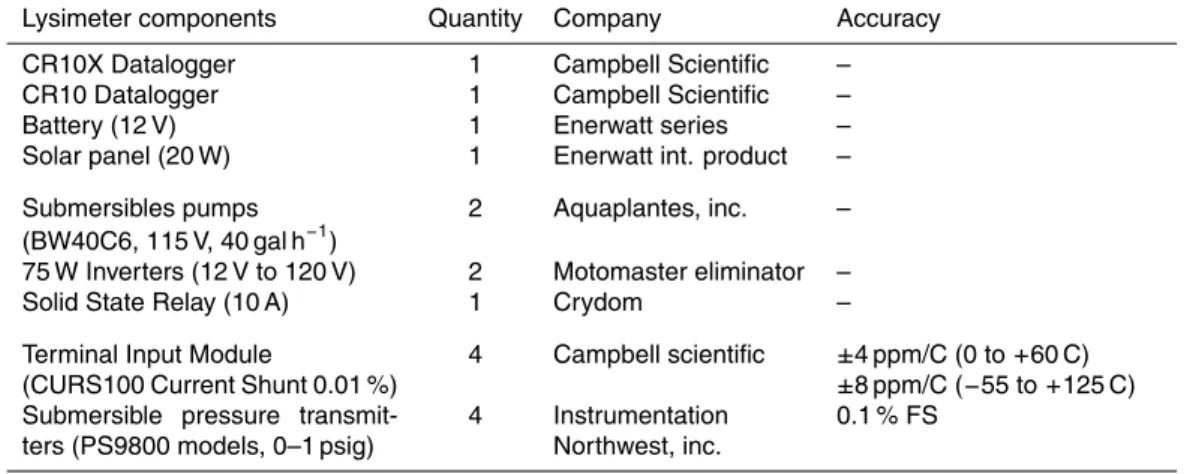
The system included a CR10X datalogger (Campbell Scientific, http://www. 10
campbellsci.ca/) connected to a 12-V battery and a 20-W solar panel (Fig. 3). The lysimeter had four submersible pressure transmitters with a 5-m long wire (PS9800, In-strumentation Northwest, Inc., 0–1 psig, accuracy±0.7 mm, http://www.inwusa.com/). These sensors, robust and completely sealed against moisture, were connected to the first four analog ports of the CR10X. The first and second pressure transducers were 15
installed in wells located inside and outside of the isolated peat, respectively. The third and fourth pressure transducers were inserted into the inlet and outlet water reser-voirs (each having an 11-l capacity), respectively. Two submersible pumps (BW40C6, 115 V, 40 gph, http://www.aquaplantes.qc.ca/), connected to the CR10X by inverters (Motomaster, 12 V to 120 V), were placed in two wells located in the peat block and 20
the water inlet, respectively. Table 1 presents the specifications of the instruments composing the lysimeter.
The isolated peat water level was readjusted by the pumps to maintain the same level as the water table outside the lysimeter once a day (at midnight). The first pump removed water from the lysimeter or the second pump added water, depending on 25
HESSD
8, 5009–5033, 2011Technical Note: Development of an automated lysimeter
S. Proulx-McInnis et al.
Title Page
Abstract Introduction
Conclusions References
Tables Figures
◭ ◮
◭ ◮
Back Close
Full Screen / Esc
Printer-friendly Version Interactive Discussion
Discussion
P
a
per
|
Dis
cussion
P
a
per
|
Discussion
P
a
per
|
Discussio
n
P
a
per
A rain gauge (CS700 Tipping bucket rain gauge, Campbell Scientific, Inc., accuracy
±1 mm, http://www.campbellsci.ca/) was installed one metre away from the lysimeter. All data (water levels and precipitation) were recorded every fifteen minutes.
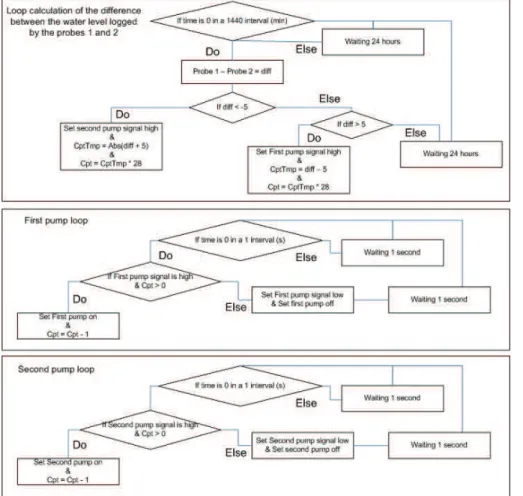
2.3 Programming and implementation
Figure 4 shows the flowchart of the code used to program the datalogger. The code is 5
included as an electronic supplement.
The program consists of three “if” loops operating independently. Once a day, at midnight, the height difference between the water level in the lysimeter and that of the water table was calculated. An error margin of 5 mm between the two water levels was tolerated because according to tests performed in the laboratory, the minimum flow of 10
the pumps was too high to allow for a margin smaller than 5 mm. If the difference was smaller than −5 mm, a signal was sent (the second pump signal). In this case, the number 5 was added to the difference between the measurements of the two probes (in the lysimeter and outside) to determine the water depth to be added to the lysimeter (in mm) and multiplied by 28 s. The pumping rate was 1/28 mm s−1(calculated from the 15
peat block dimensions). If the difference was greater than 5 mm, a signal was sent (the first pump signal). The value of 5 was subtracted to find the volume of water to be removed from the lysimeter and multiplied by 28 s. Finally, if both conditions were not met, the system idled for 24 h (until the next day).
The loop for the first pump (in the inlet water reservoir) was tested every second. If 20
the signal was raised and the counter was greater than zero, the first pump started. The counter was then decremented by one each second until zero. If conditions were not met, the first pump signal was turned off. The loop of the second pump (in the lysimeter) operated the same way as the first.
After the program execution, we considered the water in the peat block and water 25
HESSD
8, 5009–5033, 2011Technical Note: Development of an automated lysimeter
S. Proulx-McInnis et al.
Title Page
Abstract Introduction
Conclusions References
Tables Figures
◭ ◮
◭ ◮
Back Close
Full Screen / Esc
Printer-friendly Version Interactive Discussion
Discussion
P
a
per
|
Dis
cussion
P
a
per
|
Discussion
P
a
per
|
Discussio
n
P
a
per
|
2.4 Actual and potential evapotranspirations calculations
The following assumptions are made in the calculation of the AET rate: (i) the peat porosity is roughly homogenous along the profile; (ii) the variation in water level, logged by the first pressure transducer, represents the whole water column; (iii) AET occurs principally at the acrotelm-groundwater interface (rather than peat moisture in the un-5
saturated zone) and finally, (iv) the AET rate is representative of that of the surrounding environment. The difference between the two water levels was only explained by inter-flow, which was inexistent in the monolith isolated by a waterproof geotextile.
The AET rates were calculated for each day of the study period (Eq. 1):
∆WLi+Pi=|AETi| (1)
10
where∆WLi, Pi and AETi represent the change in water level recorded by the first
pressure transducer, the daily rainfall and the actual evapotranspiration of each day (i) (in mm), respectively.
It is important to note that the AETi results contain some uncertainty. A water level
change recorded by a logger in a well does not necessarily correspond to a variation 15
of the water quantity in the soil. Specific yield (Sy) can be defined as the ability of a porous medium to release water under the effect of a lowering of hydraulic head (Banton and Bangoy, 1997). The Sy is not constant throughout the peat column and there is no single value ofSy for peat soils (Price and Schlotzhauer, 1999; Hogan et al., 2006; Petrone et al., 2008). In the literature, theSy varies between 0.19 and 0.48 20
(Price and Schlotzhauer, 1999; Hogan et al., 2006; Spence et al., 2009). Moreover, the lack of information about peat porosity of these environments has led us to assume a unit value forSy, which is likely to lead to an overestimation of AETi.
Each day at midnight, the water level in the lysimeter was balanced with the water level measured in the peatland. When the water level in the lysimeter was lower than 25
HESSD
8, 5009–5033, 2011Technical Note: Development of an automated lysimeter
S. Proulx-McInnis et al.
Title Page
Abstract Introduction
Conclusions References
Tables Figures
◭ ◮
◭ ◮
Back Close
Full Screen / Esc
Printer-friendly Version Interactive Discussion
Discussion
P
a
per
|
Dis
cussion
P
a
per
|
Discussion
P
a
per
|
Discussio
n
P
a
per
note that the third and fourth pressure transducers (inlet and outlet reservoirs) are not required for the AET calculation. The measures can however be used to validate the calculation.
For comparison purposes, rates of PET were calculated using the Thornthwaite equation, which only requires air temperature data (Eq. 2). The calculation of PET 5
with other semi-empirical equations was not possible because of a lack of data. The air temperature and the number of sunshine hours are the only required param-eters in this formula. In this case, the daily adaptation of Pereira and Pruitt (2004) was used:
ETm=16
10T I
a
, 0◦C≤T≤26◦C (2)
10
where ETmis the monthly evapotranspiration (mm),T the monthly average temperature (◦C),I a thermal index imposed by the local normal climatic temperature regime (Tn, ◦
C) andaa function ofI:
I=
12
X
n=1
(0.2Tn)1.514, Tn>0◦C (3)
a=6.75·10−7I3−7.71·10−5I2−1.7912·10−2I+0.49239 (4) 15
A multiplicative conversion factor is added to the original equation to get a daily PET:
C= N
475 (5)
HESSD
8, 5009–5033, 2011Technical Note: Development of an automated lysimeter
S. Proulx-McInnis et al.
Title Page
Abstract Introduction
Conclusions References
Tables Figures
◭ ◮
◭ ◮
Back Close
Full Screen / Esc
Printer-friendly Version Interactive Discussion
Discussion
P
a
per
|
Dis
cussion
P
a
per
|
Discussion
P
a
per
|
Discussio
n
P
a
per
|
3 Results and discussion
Figure 5 shows the diurnal and nocturnal precipitation (mm), maximum, average, and minimum temperatures (◦C) and, finally, the rate of AET recorded between 12 and 27 July 2010. This time interval corresponds to a warm period at this location. The average precipitation was 2.7 mm day−1 (six days without precipitation). The highest 5
daily precipitation rates were recorded between 13 and 16 July 2010, corresponding to 15.5 and 8.1 mm day−1. During the first six days, the temperatures ranged between 17.4 and 30.6◦C. Subsequently, the temperature dropped and fluctuated between 9.5 and 28.4◦C.
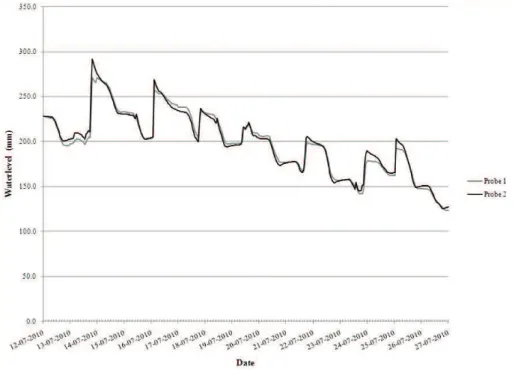
Figure 6 shows the hourly water levels (mm) logged by sensors 1 and 2 during the 10
study period. It can be seen that the levels fluctuate simultaneously in both environ-ments (inside and outside the isolated peat block). Levels were balanced every 24 h but level increases associated with precipitation were concomitant. This is indicative that balancing the water level every 24 h is sufficient.
AET varied between 0.6 and 6.9 mm day−1. The PET obtained by the semi-empirical 15
Thornthwaite equation varied between 2.8 and 3.9 mm day−1. The cumulative AET and PET were 60.5 and 53.7 mm, respectively (average AET/PET ratio of 1.13). The ratio ofΣAET/ΣP was 1.38.
The AET rates fluctuated in the study period and seemed proportional to the recorded temperatures, albeit influenced by rainfall occurrences. High daytime pre-20
cipitation was associated with low AET (for instance, 13 July 2010, Fig. 5), while high night-time precipitation (e.g., 16 July 2010, Fig. 5) affected daytime AET which could reach high values. These fluctuations could be explained by the inability of the rain-water that falls during the night, to redistribute in the environment via lateral interflow. There was more available water for evapotranspiration since the system was balanced 25
HESSD
8, 5009–5033, 2011Technical Note: Development of an automated lysimeter
S. Proulx-McInnis et al.
Title Page
Abstract Introduction
Conclusions References
Tables Figures
◭ ◮
◭ ◮
Back Close
Full Screen / Esc
Printer-friendly Version Interactive Discussion
Discussion
P
a
per
|
Dis
cussion
P
a
per
|
Discussion
P
a
per
|
Discussio
n
P
a
per
The AET rates obtained by the lysimeter seem quite plausible. According to a study by Lafleur et al. (2005) at a 2800-ha bog in Eastern Ontario (Mer Bleue, 45◦40′N and 75◦50′W), with an average temperature and total annual precipitation of 5.8◦C and 910 mm and similar vegetation, the rate of AET was between 4 and 5 mm per day, with extremes values on hot and dry days. These AET rates were calculated from 5
Eddy covariance flux measurements. The results obtained at the Pont-Rouge study site ranged between 0.6 and 6.9 mm day−1, which is comparable to those reported by Lafleur et al. (2005). On the other hand, the ratio AET/PET obtained by the latter is lower than the ratio obtained at Pont-Rouge (0.68 versus 1.13).
AET rates may vary from one site to another, as a result of several factors: topog-10
raphy, wind speed, rainfall, water table level, saturation deficit, net radiation and the vegetation at the site (Lafleur et al., 2005). In addition, the accuracy of pumps and probes (±0.7 mm) must be taken into account.
The rate of PET calculated using the Thornthwaite method was between 2.8 and 3.9 mm day−1. However, the calculation of PET by this formula takes into account 15
only two parameters: the average temperature (◦C) and the number of hours of sun-shine. Also, it is important to consider that several temperatures exceeded 26◦C (Eq. 2), thus constituting an additional source of uncertainty because in this equa-tion, the temperature has to be between 0 and 26◦C. In addition, the nearest meteo-rological station was located close to the St-Lawrence River (Deschambault, Quebec, 20
http://www.climat.meteo.gc.ca/), 25 km from the study site. The wind conditions and the albedo were therefore not necessarily always similar to those of the studied peatland, which can influence the temperatures measured at the meteorological station.
The calculation of PET is based entirely on meteorological data taken at a constant height. It is not taking into account the change of vegetation (i.e. type of species and 25
HESSD
8, 5009–5033, 2011Technical Note: Development of an automated lysimeter
S. Proulx-McInnis et al.
Title Page
Abstract Introduction
Conclusions References
Tables Figures
◭ ◮
◭ ◮
Back Close
Full Screen / Esc
Printer-friendly Version Interactive Discussion
Discussion
P
a
per
|
Dis
cussion
P
a
per
|
Discussion
P
a
per
|
Discussio
n
P
a
per
|
Tardif, 2010). However, some authors have highlighted AET/PET rates higher than one (PET estimated from Priestley-Taylor equation). Eggelsmann (1963) and Ingram (1983) found ratios higher than one on uncultivated sphagnum bogs at Bernau (South-eastern Germany) and Konigsmoor (North Germany). Eggelsmann’s (1963) obser-vations based on an eight-year study period, showed ratios of 1.5, 0.9 and 1.0 from 5
September to March, from April to August and for the whole year, respectively. Quin-ton (1991) calculated a ratio of 1.67 on an elongated patterned wetland, 5 km north of Schefferville, Quebec (54◦48′N and 66◦49′W) and Price and Maloney (1994) re-ported ratios between 1.0 and 1.2 on a 0.05 km2 sphagnum patterned bog located on the south side of Lake Melville, 65 km northeast of Goose Bay, Labrador, Canada 10
(59′′29′N and 53′33′W).
The water table was high at the studied bog site (−15 cm). Shallow water is more rapidly heated, encouraging convective energy losses (Price and Maloney, 1994). In sphagnum-dominated ecosystems, the movement of water occurs principally as liquid capillary flow (Price et al., 2009). The empirical methods of PET calculation are based 15
on vascular plants environments and are not well adapted to peatlands. The latter have a higher capillary rise than vascular plants and therefore, have a larger ability to evap-orate (Price et al., 2009). The actual evaporation rates can therefore be significantly greater than the PET estimates.
4 Strengths and weaknesses of the lysimeter system
20
Using an automated lysimeter for determining AET rates, as presented in this paper, has advantages and disadvantages.
Although simple, the isolation of a peat block requires precision and a relatively large workforce. This work cannot be done without disturbing the uniformity of the porous matrix. The lysimeter should represent as best as possible, local conditions, knowing 25
HESSD
8, 5009–5033, 2011Technical Note: Development of an automated lysimeter
S. Proulx-McInnis et al.
Title Page
Abstract Introduction
Conclusions References
Tables Figures
◭ ◮
◭ ◮
Back Close
Full Screen / Esc
Printer-friendly Version Interactive Discussion
Discussion
P
a
per
|
Dis
cussion
P
a
per
|
Discussion
P
a
per
|
Discussio
n
P
a
per
to ensure that the support of the datalogger is high above the ground and does not shade the plants of the peat block.
The assumption of uniformity of the peat porosity implies that water is stored uni-formly and that there is no lateral movement of water in the monolith. However, poros-ity in a peat block of this size (0.20 m3) may not be entirely uniform. An uncertainty 5
may be associated with this assumption. The first sensor may have been installed in a place where the porosity is larger than elsewhere in the block and therefore where there is more water. This could overestimate the rate of evapotranspiration. In addition, the isolation of a monolith in a geotextile could also increase these rates. Indeed, rain water that accumulated in the monolith could not disperse laterally, whereas lateral flow 10
is possible in the normal peat environment.
To measure the water variation in the peat block, a well formed by a PVC pipe con-taining a pressure transducer was used. As discussed by Proulx-McInnis (2010), the direct water table measurements do not represent adequately the storage of water in a peat column. In the literature, some researchers have estimatedSyvalues from sim-15
ilar sites, considering the horizontal and vertical compression of the peat. Price and Schlotzhauer (1999) estimated aSy of 0.48 for a minerotrophic fen in the Lac St-Jean region of Quebec (48◦N), Hogan et al. (2006) found a value of 0.26 for a minerotrophic fen near Prince-Albert, Saskatchewan (53◦N), and finally, Spence et al. (2009) cited a value of 0.19 for a minerotrophic fen with a porosity of 80 % in the Northwest Ter-20
ritories. Thus, it can be seen thatSy values are highly variable and further research is required to capture the impact of this variability. The lack of information about the specific yield of these environments led us to assume a unit value, which resulting in an overestimation of AET and thereby AET/PET ratio.
Moreover, vegetation dries out following a few days of sunshine. During rain events, 25
HESSD
8, 5009–5033, 2011Technical Note: Development of an automated lysimeter
S. Proulx-McInnis et al.
Title Page
Abstract Introduction
Conclusions References
Tables Figures
◭ ◮
◭ ◮
Back Close
Full Screen / Esc
Printer-friendly Version Interactive Discussion
Discussion
P
a
per
|
Dis
cussion
P
a
per
|
Discussion
P
a
per
|
Discussio
n
P
a
per
|
the bottom of a well measures only the water that percolates by gravity and does not take into account the significant fraction of water in the capillary fringe and unsaturated zone (Banton and Bangoy, 1997). Nevertheless, in our case, the sphagnum peat had Von Post scale of decomposition values of 1 to 3. The water was not stored for a long time in the acrotelm and can be equilibrated in the peat column faster than in the case 5
reported by Schwaerzel and Bohl (2003). For these reasons, the second and the third assumptions (the variation in water level, logged by the first pressure transducer, takes into account the whole water column and AET occurs principally from the groundwater, rather than peat moisture in the unsaturated zone) likely produced some bias in the measurements.
10
Compared to the methods used by other authors (e.g. the Eddy Covariance method), the automated lysimeter system put together in this study is relatively inexpensive (Bal-docchi et al., 1998; Petrone et al., 2004; Lafleur et al., 2005). The cost of this lysimeter was approximately $ 8000. The major expenditures are the datalogger and the four ro-bust and accurate submersible pressure transducers. Furthermore, when comparing 15
this design with that of Schwaerzel and Bohl (2003), it can be seen that our lysime-ter had fewer sensors. The omission of TDR and tensiomelysime-ters does not change the method of AET calculation. These instruments were installed by Schwaerzel and Bohl (2003) to measure water retention and hydraulic conductivity. These additional vari-ables can provide insight in the detailed water apportionment within the peat block, but 20
not on the final AET measurements. In our study, it was assumed that all water was located in the saturated zone and, therefore, measured by the pressure gauge. As mentioned earlier, water retained in the unsaturated zone could not be accounted for, and this may have caused a bias of about 20 % on the measurements, given the thick-nesses of the unsaturated and saturated zones. The system has fewer components, 25
so its simplicity brings less risk of experiencing problems when deploying the lysimeter in isolated areas.
HESSD
8, 5009–5033, 2011Technical Note: Development of an automated lysimeter
S. Proulx-McInnis et al.
Title Page
Abstract Introduction
Conclusions References
Tables Figures
◭ ◮
◭ ◮
Back Close
Full Screen / Esc
Printer-friendly Version Interactive Discussion
Discussion
P
a
per
|
Dis
cussion
P
a
per
|
Discussion
P
a
per
|
Discussio
n
P
a
per
unit, once installed and programmed, can operate independently for long periods, re-quiring only a check from time to time. Finally, downloading data and calculation of AET is relatively fast and simple.
5 Conclusions
Few articles in the literature have discussed the estimation or measurement of AET 5
from a peat soil (Ingram, 1983; Keleman and Ingram, 1999; Schwaerzel and Bohl, 2003; Schwaerzel et al., 2006; Petrone et al., 2007, 2008). Quantification of this major water flux is essential, even if it represents a challenge.
An automated lysimeter, inspired by Schwaerzel and Bohl (2003), installed at a bog site in Pont-Rouge, Quebec (Canada) allowed for the calculation of AET from 12 to 10
27 July 2010. This system is simple and represents an effective apparatus to obtain measurements of AET in a peatland, a medium that is often waterlogged where veg-etation is dominated by non-vascular plants. The ratio AET/PET of 1.13, presented in this paper, is perhaps larger than those obtained by other authors, but appears to be valid for sphagnum-dominated ecosystems.
15
Supplementary material related to this article is available online at: http://www.hydrol-earth-syst-sci-discuss.net/8/5009/2011/
hessd-8-5009-2011-supplement.pdf.
Acknowledgements. This research was financially supported by the Collaborative Research
and Development (CRD) program of the Natural Science and Engineering Research Council 20
(NSERC) of Canada, Hydro-Qu ´ebec, and Ouranos. We would also like to thank Serge Payette (Universit ´e Laval) principal investigator of the aforementioned CDR-NSERC grant (Ecohydrol-ogy of minerotrophic peatland of the La Grande River Watershed, Northern Quebec: water cycle, CO2and CH4monitoring). We are thankful to the reviewers who provided detailed
HESSD
8, 5009–5033, 2011Technical Note: Development of an automated lysimeter
S. Proulx-McInnis et al.
Title Page
Abstract Introduction
Conclusions References
Tables Figures
◭ ◮
◭ ◮
Back Close
Full Screen / Esc
Printer-friendly Version Interactive Discussion
Discussion
P
a
per
|
Dis
cussion
P
a
per
|
Discussion
P
a
per
|
Discussio
n
P
a
per
|
References
Baldocchi, D. D., Hicks, B. B., and Meyers, T. P.: Measuring biosphere-atmosphere exchange exchanges of biologically related gases with micrometeorological methods, Ecology, 69(5), 1331–1340, 1988.
Banton, O. and Bangoy M.: Hydrog ´eologie, multiscience environnementale des eaux souter-5
raines, Presses de l’Universit ´e du Qu ´ebec, AUPELF, 1997.
Bragato, G., Mori, A., and De Nobili, M.: Capillary electrophoretic behavior of humic substances from Sphagnum peats of various geographical origin: relation with the degree of decompo-sition, Eur. J. Soil Sci., 49, 589–596, 1998.
Deguchi, A., Hattori, S., Daikoku, K., and Park, H.: Measurement of evaporation from the forest 10
floor in a deciduous forest throughout the year using microlysimeter and closed-chamber systems, Hydrol. Process., 22, 3712–3723, doi:10.1002/hyp.6974, 2008.
Eggelsmann, R.: Die potentielle und aktuelle Evaporation eines Seeklima-Hochmoores, Gen-eral Assembly Berkeley, International Association of Hydrological Sciences Publications, 62, 88–97, 1963.
15
Kelemen, J. C. and Ingram, H. A. P.: The use of large bottomless lysimeters in the determination of water balances for a raised mire, Hydrol. Process., 13, 101–111, 1999.
Hogan, J. M., Van der Kamp, G., Barbour, S. L., and Schmidt, R.: Field methods for measuring hydraulic properties of peat deposits, Hydrol. Process., 20, 3635–3649, doi:10.1002/hyp.6379, 2006.
20
Ingram, H.: Hydrology, in: Ecosystems of the World, 4A – Mires: Swamp, Bog Fen and Moor, edited by: Gore, A. P. J., Elsevier, Amsterdam, 1983.
Lafleur, P. M., Hember, R. A., Admiral, S. W., and Roulet, N. T.: Annual and seasonal variability in evapotranspiration and water table at a shrub-covered bog in Southern Ontario, Canada, Hydrol. Process., 19, 3533–3550, doi:10.1002/hyp.5842, 2005.
25
Loheide II, S. P.: A method for estimating subdaily evapotranspiration of shallow groundwater using diurnal water table fluctuations, Ecohydrology, 1, 59–66, doi:10.1002/eco.7, 2008. Lott, R. B. and Hunt, R. J.: Estimating evapotranspiration in natural and constructed wetlands,
Wetlands, 21(4), 614–628, doi:10.1672/0277-5212(2001)021[0614:EEINAC]2.0.CO;2, 2001.
30
HESSD
8, 5009–5033, 2011Technical Note: Development of an automated lysimeter
S. Proulx-McInnis et al.
Title Page
Abstract Introduction
Conclusions References
Tables Figures
◭ ◮
◭ ◮
Back Close
Full Screen / Esc
Printer-friendly Version Interactive Discussion
Discussion
P
a
per
|
Dis
cussion
P
a
per
|
Discussion
P
a
per
|
Discussio
n
P
a
per
doi:10.2136/sssaj2005.0492, 2005.
Pereira, A. R. and Pruitt, W. O.: Adaptation of the Thornthwaite scheme for es-timating daily reference evapotranspiration, Agr. Water Manage., 66, 251–257, doi:10.1016/j.agwat.2003.11.003, 2004.
Petrone, R. M., Price, J. S., and Waddington, J. M.: Surface moisture and energy exchange 5
from a restored peatland, J. Hydrol., 295, 198–210, doi:10.1016/j.jhydrol.2004.03.009, 2004. Petrone, R. M., Smith, C., Macrae, M. L., and English, M. C.: Riparian zone equilibrium and
actual evapotranspiration in a first order agricultural catchment in Southern Ontario, Canada, Agr. Water Manage., 86, 240–248, doi:10.1016/j.agwat.2006.05.018, 2006.
Petrone, R. M., Silins, U., and Devito, K. J.: Dynamics of evapotranspiration from a riparian pond 10
complex in the Western Boreal Forest, Alberta, Canada, Hydrol. Process., 21, 1391–1401, doi:10.1002/hyp.6298, 2007.
Petrone, R. M., Devito, K. J., Silins, U., Mendoza, C., Brown, S. C., Kaufman, S. C., and Price, J. S.: Transient peat properties in two pond-peatland complexes in the sub-humid Western Boreal Plain, Canada, Mires and Peat, 3, 1–13, 2008.
15
Price, J. S. and Maloney, D. A.: Hydrology of a patterned bog-fen complex in Southeastern Labrador, Canada, Nord. Hydrol., 25, 313–330, 1994.
Price, J. S. and Schlotzhauer, S. M.: Importance of shrinkage and compression in determining water storage changes in peat: the case of a mined peatland, Hydrol. Process., 13, 2591– 2601, 1999.
20
Price, J. S., Edwards, T. W. D., Yi, Y., and Whittington, P. N.: Physical and isotopic characteri-zation of evaporation from Sphagnum moss, J. Hydrol., 369, 175–182, 2009.
Proulx-McInnis, S.: Caract ´erisations g ´eomorphologique, topographique et hydrologique d’un bassin versant incluant une tourbi `ere min ´erotrophe fortement aqualys ´ee, Baie-de-James, Qu ´ebec, m ´emoire de maˆıtrise en sciences de l’eau, INRS-ETE, 2010.
25
Quinton, W. L.: The hydrology of a subarctic patterned wetland, M.Sc. thesis, York University, Toronto, 1991.
Roulet, M. T. and Woo, M.: Wetland and lake evaporation in the Low Arctic, Arctic Alpine Res., 18(2), 195–200, 1986.
Schwaerzel, K. and Bohl, H. P.: An easily installable groundwater lysimeter to determine wa-30
terbalance components and hydraulic properties of peat soils, Hydrol. Earth Syst. Sci., 7, 23–32, doi:10.5194/hess-7-23-2003, 2003.
HESSD
8, 5009–5033, 2011Technical Note: Development of an automated lysimeter
S. Proulx-McInnis et al.
Title Page
Abstract Introduction
Conclusions References
Tables Figures
◭ ◮
◭ ◮
Back Close
Full Screen / Esc
Printer-friendly Version Interactive Discussion
Discussion
P
a
per
|
Dis
cussion
P
a
per
|
Discussion
P
a
per
|
Discussio
n
P
a
per
|
of soil-water dynamics evapotranspiration of drained peatland soils, J. Plant Nutr. Soil Sc., 169(6), 762–774, doi:10.1002/jpln.200621992, 2006.
Spence, C., Guan, X. J., Philips, R., Hedstrom, N., Granger, R., and Reid, B.: Storage dynamics and streamflow in a catchment with a variable contributing area, Hydrol. Process., 14(16), 2209–2221, doi:10.1002/hyp.7492, 2009.
5
Sumner, D. M. and Jacobs, J. M.: Utility of Penman-Monteith, Priestley-Taylor, reference evap-otranspiration, and pan evaporation methods to estimate pasture evapevap-otranspiration, J. Hy-drol., 308, 81–104, doi:10.1016/j.jhydrol.2004.10.023, 2005.
Tardif, S.: Hydrologie comparative des tourbi `eres et des lacs de la Baie de James dans un contexte d’aqualyse, th `ese de doctorat en sciences de l’eau, INRS-ETE, 2010.
HESSD
8, 5009–5033, 2011Technical Note: Development of an automated lysimeter
S. Proulx-McInnis et al.
Title Page
Abstract Introduction
Conclusions References
Tables Figures
◭ ◮
◭ ◮
Back Close
Full Screen / Esc
Printer-friendly Version Interactive Discussion
Discussion
P
a
per
|
Dis
cussion
P
a
per
|
Discussion
P
a
per
|
Discussio
n
P
a
per
Table 1.Technical specifications of the lysimeter components.
Lysimeter components Quantity Company Accuracy
CR10X Datalogger 1 Campbell Scientific – CR10 Datalogger 1 Campbell Scientific – Battery (12 V) 1 Enerwatt series – Solar panel (20 W) 1 Enerwatt int. product –
Submersibles pumps (BW40C6, 115 V, 40 gal h−1)
2 Aquaplantes, inc. –
75 W Inverters (12 V to 120 V) 2 Motomaster eliminator – Solid State Relay (10 A) 1 Crydom –
Terminal Input Module
(CURS100 Current Shunt 0.01 %)
4 Campbell scientific ±4 ppm/C (0 to+60 C) ±8 ppm/C (−55 to+125 C) Submersible pressure
transmit-ters (PS9800 models, 0–1 psig)
4 Instrumentation Northwest, inc.
HESSD
8, 5009–5033, 2011Technical Note: Development of an automated lysimeter
S. Proulx-McInnis et al.
Title Page
Abstract Introduction
Conclusions References
Tables Figures
◭ ◮
◭ ◮
Back Close
Full Screen / Esc
Printer-friendly Version Interactive Discussion
Discussion
P
a
per
|
Dis
cussion
P
a
per
|
Discussion
P
a
per
|
Discussio
n
P
a
per
|
HESSD
8, 5009–5033, 2011Technical Note: Development of an automated lysimeter
S. Proulx-McInnis et al.
Title Page
Abstract Introduction
Conclusions References
Tables Figures
◭ ◮
◭ ◮
Back Close
Full Screen / Esc
Printer-friendly Version Interactive Discussion
Discussion
P
a
per
|
Dis
cussion
P
a
per
|
Discussion
P
a
per
|
Discussio
n
P
a
per
|
HESSD
8, 5009–5033, 2011Technical Note: Development of an automated lysimeter
S. Proulx-McInnis et al.
Title Page
Abstract Introduction
Conclusions References
Tables Figures
◭ ◮
◭ ◮
Back Close
Full Screen / Esc
Printer-friendly Version Interactive Discussion
Discussion
P
a
per
|
Dis
cussion
P
a
per
|
Discussion
P
a
per
|
Discussio
n
P
a
per
|
(a)
(b)
HESSD
8, 5009–5033, 2011Technical Note: Development of an automated lysimeter
S. Proulx-McInnis et al.
Title Page
Abstract Introduction
Conclusions References
Tables Figures
◭ ◮
◭ ◮
Back Close
Full Screen / Esc
Printer-friendly Version Interactive Discussion
Discussion
P
a
per
|
Dis
cussion
P
a
per
|
Discussion
P
a
per
|
Discussio
n
P
a
per