CPD
3, 1063–1117, 2007Multi proxy reconstructions of
Fontainebleau temperature
N. Etien et al.
Title Page
Abstract Introduction
Conclusions References
Tables Figures
◭ ◮
◭ ◮
Back Close
Full Screen / Esc
Printer-friendly Version
Interactive Discussion
Clim. Past Discuss., 3, 1063–1117, 2007 www.clim-past-discuss.net/3/1063/2007/ © Author(s) 2007. This work is licensed under a Creative Commons License.
Climate of the Past Discussions
Climate of the Past Discussionsis the access reviewed discussion forum ofClimate of the Past
Maximum growing season temperature in
Western Europe: multi proxy
reconstructions in Fontainebleau from
1596 to 2000
N. Etien1, V. Daux1, V. Masson-Delmotte1, M. Stievenard1, V. Bernard2, S. Durost3, M. T. Guillemin1, O. Mestre4, and M. Pierre1
1
Laboratoire des Sciences du Climat et de l’Environnement (IPSL, UMR CEA-CNRS 1572), L’Orme des Merisiers, B ˆatiment 701, CEA Saclay, 91 191 Gif-Sur-Yvette cedex, France
2
Dendrochronologie et Arch ´eo-dendrologie (UMR 6566 “Civilisations Atlantiques et
Arch ´eosciences”) Universit ´e de Rennes 1, Campus de Beaulieu, B ˆat 24/25, 35042 Rennes, France
3
Laboratoire de Chrono-Ecologie (UMR 6565), Universit ´e de Franche-Comt ´e, UFR des Sciences, La Bouloie, 16 route de Gray, 25030 Besanc¸on, France
4
M ´et ´eo France, Direction de la climatologie, 42 avenue Gaspard-Coriolis, 31057 Toulouse Cedex, France
Received: 18 September 2007 – Accepted: 2 October 2007 – Published: 11 October 2007 Correspondence to: N. Etien (nathalie.etien@cea.fr)
CPD
3, 1063–1117, 2007Multi proxy reconstructions of
Fontainebleau temperature
N. Etien et al.
Title Page
Abstract Introduction
Conclusions References
Tables Figures
◭ ◮
◭ ◮
Back Close
Full Screen / Esc
Printer-friendly Version
Interactive Discussion
Abstract
In this study, we have combined a Burgundy grape harvest date record with newδ18O
measurements conducted on timbers and living trees cellulose from Fontainebleau castle and forest. Our reconstruction is expected to provide a reference series for the variability of growing season temperature (from April to September) in Western Europe 5
from 1596 to 2000. We have estimated an uncertainty of 0.55◦C on individual growing
season maximum temperature reconstructions. We are able to assess this uncertainty, which is not the case for many documentary sources (diaries etc.), and even not the case for early instrumental temperature data.
We compare our data with a number of independent temperature estimates for Eu-10
rope and the Northern Hemisphere. The comparison between our reconstruction and Manley mean growing season temperature data provides an independent control of the quality of CET data. We show that our reconstruction preserves more variance back in time, because it was not distorted/averaged by statistical/homogenisation methods.
Further works will be conducted to compare theδ18O data from wood cellulose
pro-15
vided by transects of different tree species in Europe obtained within the EC ISONET
project and the French ANR Program ESCARSEL, to analyse the spatial and temporal
coherency betweenδ18O records. The decadal variability will be also compared with
other precipitationδ18O records such as those obtained from benthic ostracods from
deep peri-Alpine lakes or simulated by regional atmospheric models equipped with the 20
modelling of water stable isotopes.
1 Introduction
For the last millennium, the magnitude of temperature variability remains uncertain (IPCC, 2007). Multi-proxy reconstructions show a large dispersion in the estimated decadal and centennial temperature range. Recent studies have highlighted the intrin-25
sic limitations of dendrochronological records on multi-decadal time scales, due to the
CPD
3, 1063–1117, 2007Multi proxy reconstructions of
Fontainebleau temperature
N. Etien et al.
Title Page
Abstract Introduction
Conclusions References
Tables Figures
◭ ◮
◭ ◮
Back Close
Full Screen / Esc
Printer-friendly Version
Interactive Discussion
requirement to correct for age effects on tree growth (Esper et al., 2002). The segment
length of individual tree records is an upper limit to the longest periodicities potentially
recorded in such records (Briffa, 2000). Classically, reconstructions are discussed for
high and low frequencies, below or above 40 or 80 years. Methods have been devel-oped to combine low and high frequency records at hemispheric (Moberg et al., 2005) 5
or regional scale (Guiot et al., 1983). However, it remains essential to understand how the initial proxy records capture temperature variability at various time scales.
Several attempts have been made to quantify European temperature changes during the past centuries (Overpeck et al., 1997; Jones et al., 1998; Mann et al., 1998;
Crow-ley, 2000; Briffa, 2000; Briffa et al., 2001; Esper et al., 2002; Luterbacher et al., 2004;
10
Guiot et al., 2005; Moberg et al., 2005). These European-scale reconstructions are mainly based on ancient instrumental records, high latitude or altitude tree-ring growth indices, and, sometimes, historical records. Complex statistical methods are used to calibrate and integrate the available records. However, many regions are not repre-sented in these quantitative reconstructions of recent temperature variations, such as 15
temperate climate areas of France.
The exact dating of each tree-ring provides a perfect annual resolution and contin-uous records can be obtained over hundred years. Trees are widespread, and have
been used as building material for centuries. Therefore, living trees and timbers offer
many sampling opportunities. Although tree-ring densities and/or widths have been 20
successfully used to reconstruct summer temperatures in high latitudes or altitudes
where temperature is a limiting factor controlling tree growth (Briffa et al., 2001; Guiot
et al., 2005), they do not provide reliable reconstructions of temperature in temperate areas, where tree growth reacts to a variety of environmental factors. It was however
shown thatQuercussp. ring width may be partly controlled by drought (Briffa, 2000).
25
The oxygen and carbon isotopic ratios in tree cellulose are sensitive bio-indicators, and
offer the possibility to study integrated information on the variability of the climate and
water cycle even in temperate areas where classical dendroclimatology does not apply (McCarroll and Loader, 2004).
CPD
3, 1063–1117, 2007Multi proxy reconstructions of
Fontainebleau temperature
N. Etien et al.
Title Page
Abstract Introduction
Conclusions References
Tables Figures
◭ ◮
◭ ◮
Back Close
Full Screen / Esc
Printer-friendly Version
Interactive Discussion
Recently, it was shown that the analyses of cellulose stable isotopic rates make pos-sible paleoclimatic reconstructions with annual resolution in temperate region without
major tree age effects (Raffalli-Delerce et al., 2003; McCarroll and Loader, 2004).δ13C
of tree ring cellulose is a proxy for temperature, relative humidity and more generally water stress (Wilson et al., 1977; Freyer, 1979; Leavitt et al., 1982; Stuiver et al., 1984; 5
Lipp et al., 1991; Dupouey et al., 1993; Saurer et al., 1995; Robertson et al., 1997a,
1997b; Hemming et al., 1998; Barbour et al., 2001; McCarroll et al., 2001).δ18O of tree
ring cellulose was used successfully for reconstructing the oxygen isotopic composi-tion of the precipitacomposi-tion of the growing season and climate parameters (such as surface air temperature, relative humidity, water stress. . . ) of past centuries (e.g. among the 10
most recent: Anderson et al., 2002; Robertson et al., 2001; Saurer et al., 2002; Raff
ali-Delerce et al., 2003; Danis et al., 2006).
The harvest dates of “Pinot Noir” grapes in Burgundy (eastern France, ∼250 km
south east of Fontainebleau) were also shown to be a proxy for the mean atmospheric temperature of April to September (Chuine et al., 2004) and have inter-annual varia-15
tions strongly related to Fontainebleau maximum temperature from April to September
(Etien et al., 20071). To our knowledge, Burgundy is the longest grape harvest dates
series available in France (ininterrupted series from 1370 to 2003; Chuine et al., 2004). A multi-proxy calibration of growing season (April to September) maximum
tempera-ture has been obtained in Fontainebleau region (northern France) (Etien et al., 20071).
20
Homogenised instrumental records of maximum monthly temperature are available in Northern France for the past century, as well as documentary records of grape har-vest dates and proxy records of seasonal climate obtained by the analysis of latewood
tree-ring cellulose isotopic composition (δ18O andδ13C) from 15 living trees (Quercus
r.) sampled in the Fontainebleau forest. Multiple linear regression statistical analyses 25
1
Etien, N., Daux, V., Guillemin, M. T., Masson-Delmotte, V., Stievenard, M., Breda, N., Boettger, T., Haupt, M., Mestre, O., and Perraud, P. P.: Summer maximum temperature in northern France over the past century: instrumental data versus multiple proxies (tree-ring isotopes, grape harvest dates and forest fires), Clim. Change, in review, 2007.
CPD
3, 1063–1117, 2007Multi proxy reconstructions of
Fontainebleau temperature
N. Etien et al.
Title Page
Abstract Introduction
Conclusions References
Tables Figures
◭ ◮
◭ ◮
Back Close
Full Screen / Esc
Printer-friendly Version
Interactive Discussion
have been used to assess the response function of documentary and tree-ring isotopic records to growing season maximum temperature. We have demonstrated that a
sig-nificant proportion of climatic variability (R2=0.66) can be reconstructed using a linear
regression model of grape harvest dates, celluloseδ13C andδ18O (Etien et al., 20071).
It shows the potential of multiple proxy reconstructions to assess the past fluctuations 5
of growing season maximum temperature prior to the instrumental period. Here, this calibration will be applied to the reconstruction of April to September maximum temper-ature in Fontainebleau area using a series of carbon and oxygen isotopic compositions of historical building timbers sampled in the Fontainebleau castle and Burgundy grape harvest dates from 1596 to 1899. Based on available meteorological data, interannual 10
variations in Fontainebleau growing season temperature should be representative of a
larger area from south-western France to North of Germany (Etien et al., 20071).
The power spectrum of the multiple Fontainebleau tree-ring records will be linked with the power spectrum of the Burgundy historical grape harvest record and the tem-perature reconstruction derived from the linear regression model described in Etien et 15
al. (2007)1. The originality of this analysis is the use of raw tree ring isotopic data,
without any standardisation: we take advantage of the annual resolution of the records
and assume limited age effects.
Our multi-proxy reconstruction is finally compared to the different temperature
re-constructions available for Europe and Northern Hemisphere for the period 1600 to 20
1900. Therefore, reconstructions of past temperature at Fontainebleau will help under-standing climatic variations on a much broader scale and to fill a geographical gap in European climate reconstructions (Luterbacher et al., 2004; Guiot et al., 2005).
CPD
3, 1063–1117, 2007Multi proxy reconstructions of
Fontainebleau temperature
N. Etien et al.
Title Page
Abstract Introduction
Conclusions References
Tables Figures
◭ ◮
◭ ◮
Back Close
Full Screen / Esc
Printer-friendly Version
Interactive Discussion
2 Material and method
2.1 Sampling site
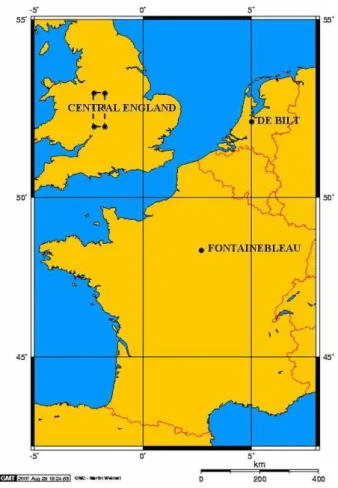
In this section, we focus on the region near Fontainebleau, northern France (Fig. 1). This region was selected for its proximity to Paris, the availability of forest trees and tim-ber wood from ancient buildings for isotopic analyses, the availability of documentary 5
information and homogenised meteorological records.
Fontainebleau is located in northern France (2.67◦E, 48.38◦N) between the Gatinais
and Briard plateau and the Bri `ere plain (Fig. 1). Fontainebleau has a typical temperate oceanic climate with regular year-round distribution of precipitation (between 50 and
70 mm/month). The yearly amplitude of monthly maximum temperature is 20◦C. At
10
present day, the Fontainebleau forest covers a 280 km2 area and culminates at 144 m
above sea level. Stampian limestones form the substrates and oak roots develop in a loamy soil. For this study, the building wood is assumed to originate from forests of
the neighbourhood. Fieldwork was achieved with the support of Office National des
For ˆets and the Conservation du Mus ´ee-Ch ˆateau de Fontainebleau. In Fontainebleau 15
forest, 15 trees were sampled in year 2000 (3 cores at 120◦per tree at DBH) and cover
the time period from 1829 to 2000. For older periods, we have sampled timbers from historical buildings in Fontainebleau’s castle: 5 timbers from “salle des Bals” (ballroom) and “Clocher” (steeple) (spanning the time period from 1596 to 1743). 9 timbers from “Th ´e ˆatre” (theatre) (dated from 1748 to 1850) and 4 timbers from “Petites Ecuries” 20
(little stables) (dated from 1596 to 1750). We sampled cores with diameters ranging from 5 to 8 mm. Meteorological data are available from the nearest weather station (La Faisanderie, located about 2 km to the east of Fontainebleau town where beam were sampled in the castle).
CPD
3, 1063–1117, 2007Multi proxy reconstructions of
Fontainebleau temperature
N. Etien et al.
Title Page
Abstract Introduction
Conclusions References
Tables Figures
◭ ◮
◭ ◮
Back Close
Full Screen / Esc
Printer-friendly Version
Interactive Discussion
2.2 Fontainebleau Forest and Castle history
In order to expand the isotopic records obtained from living trees, we have made the
hypothesis that theQuercussp. timber wood of historical buildings from the Ch ˆateau
de Fontainebleau (Fontainebleau Castle) was provided by trees felled down in the sur-rounding Fontainebleau forest.
5
The first historical descriptions of a castle in Fontainebleau are found in documentary sources from the 12th century. Without a precise knowledge of date of foundation works, it is known that there was already a fortified castle. The only remain from this initial building is the keep of the Oval yard, where many French kings lived: Philippe-Auguste (1165–1223), saint-Louis (1214–1270) and Philippe Le Bel (1268–1314). In 10
1259, the castle was transformed into a convent-hospital, entrusted to the Order of the Holy Trinity.
Much later, during the Renaissance, the castle experienced spectacular transforma-tions. Franc¸ois (I) (1494–1547), King of France, launched in 1528 the reconstruction and the renovation of the castle. Preserving the Middle Age keep, he ordered the con-15
struction of groups of buildings on the Oval yard: Porte Dor ´ee (“Golden Gate”), Salle de Bal (“ballroom”) and Saint-Saturnin chapel; groups of buildings forming the present-day White Horse yard, on a land bought from the Order of the Holy Trinity; and the gallery called “Franc¸ois Ier” that linked the two sets of buildings. At his death, his son Henry the 2nd (1519–1559) and Catherine de M ´edicis (1519–1589) expanded this work and 20
added new buildings in the Fountain Yard. At the beginning of the 18th century, a ma-jor fire devastated many buildings of the Fontainebleau Castle (V. Droguet, personal communication).
Our timber wood sampling was focused on the frame of four sites: ballroom (Salle de Bal), steeple (Clocher), little stables (Petites Ecuries) and theatre (Th ´e ˆatre). Den-25
drochronological results reveal three main sets of ages. The first set of data corre-sponds to beams from the Salle de Bal (1596–1743), Clocher (1598–1698) and Petites Ecuries (1596–1750). The construction of the ballroom, located on the first floor of the
CPD
3, 1063–1117, 2007Multi proxy reconstructions of
Fontainebleau temperature
N. Etien et al.
Title Page
Abstract Introduction
Conclusions References
Tables Figures
◭ ◮
◭ ◮
Back Close
Full Screen / Esc
Printer-friendly Version
Interactive Discussion
south wing of the Oval yard, started in 1528 under the reign of Franc¸ois (I) and ended in 1550 under Henry (II). The construction of the steeple, above the Trinity Chapel, was also ordered by Henry (II) and was finished in 1550. The historical construction dates do not systematically coincide with the dating of our beam samples (1596–1743). The steeple was devastated by the 18th century fire and its frame had to be completely 5
rebuilt. However, the ballroom was not struck by this fire and no reconstruction is doc-umented in the castle annals. Finally, historical sources confirm the building of the little stables in the course of the 18th century (V. Droguet, personal communication).
Therefore, trees felled down in the 18th century provided this first set of timbers
for the reconstruction of three different buildings. This hypothesis is also consistent
10
with documentary sources describing the use of the Fontainebleau woodland (National
Forest Office documents).
Due to its climatic and geological context, this woodland was dominated byQuercus
sp., with a spontaneous growth and representing always at least 60% of the trees. In 1848, the forest management was transferred to the national level, after three earlier 15
series of reformations (in 1664, 1717 and 1754). In 1664, the forest description was alarming. Half of its area was cleared of trees and only 13% of its surface had mature plantations. This resulted from common practice pasture (more than 12000 cattle and 6000 pigs), from game damage and from numerous forest fires. The exceptional 1709 winter frost further killed many trees. It must be noted that, since 1566, the woodland 20
had been declared as a royal domain and could not be exploited. The few mature plantations belonged to the King of France who could use them at his convenience.
The 9 timbers sampled in the Petites Ecuries, Salle de Bal and Clocher span a time period from 1596 to 1750 and all the corresponding trees had at least 40 years in 1664, therefore corresponding to the few mature plantations of that time.
25
The second series of timber wood samples corresponds to timbers cored in the roof of the Th ´e ˆatre (1748–1850). After the plundering of the French Revolution, mainly
affecting furniture and decoration, the 19th century was a period of limited
reconstruc-tions. However, Napoleon (III) ordered the construction of a theatre in buildings from
CPD
3, 1063–1117, 2007Multi proxy reconstructions of
Fontainebleau temperature
N. Etien et al.
Title Page
Abstract Introduction
Conclusions References
Tables Figures
◭ ◮
◭ ◮
Back Close
Full Screen / Esc
Printer-friendly Version
Interactive Discussion
the north wing of the main yard dating from the 1770s. The frame of that building was completely renovated during the construction of this theatre (V. Droguet, personal communication) and documentary sources are fully consistent with the dendrochrono-logical data. These samples therefore correspond to trees cut in the 1850s. It must be noted that, from 1716 to 1853, the Fontainebleau forest was the object of an uninter-5
rupted and intense artificial repopulation operation. Due to the difficulty to succeed in
creating deciduous repopulations, there was a transient introduction ofPinussp. trees,
only conserved as a definitive species in poor soils. The period covered by the sam-ples taken from the Th ´e ˆatre beams (1748 to 1850) correspond to the years when the forest management was strongly controlled and oriented towards the repopulation of 10
deciduous plantations (Guignan, 2004). We managed to core at least four beams in order to get more than four samples per year. This requirement could not be satisfied over the periods 1596 to 1610 and 1733 to 1759.
The last set of tree samples is provided by direct sampling of living Fontainebleau
forest Quercus r. (1829 to 2000) (Etien et al., 20071); these trees have grown in a
15
managed forest.
2.3 Sample preparation
Each ring of our samples has first to be dated. The basic principle of cross dating depends on special growth conditions of pointer years, which, according to their in-tensity or duration, produce extreme thin or large rings (Fritts, 1976; Schweingruber, 20
1985; Schweingruber et al., 1990). In temperate climates, trees make a new ring every year whose width varies with multiple factors amongst which climate predominates, and where thinning and biotic attack may have important consequences as well. By measuring and analyzing growth rings of tens of trees, a reference year-by-year growth
index can be established for each species and region. The sampling of woods of diff
er-25
ent ages enables the correlation between each growth sequence and the construction of a continuous chronology.
CPD
3, 1063–1117, 2007Multi proxy reconstructions of
Fontainebleau temperature
N. Etien et al.
Title Page
Abstract Introduction
Conclusions References
Tables Figures
◭ ◮
◭ ◮
Back Close
Full Screen / Esc
Printer-friendly Version
Interactive Discussion
and late and total wood with the help of a master series constructed with more than
400 oaks from Fontainebleau Forest (Etien et al., 20071). On average, these dominant
trees are 150 years old (data set from 1829 to 2000). Dating of beam wood samples of the “Ch ˆateau de Fontainebleau” was done in collaboration with dendrochronology laboratories from the University of Rennes (V. Bernard) and Besanc¸on (S. Durost). 5
All the samples were compared with each other. When an undated sample or site sequence is compared against a dated sequence, known as a reference chronology, an indication of the matching quality must be determined. We use one of the cross-correlation algorithms most commonly used and published, derived from Baillie and Pilcher’s CROS programme, based on the Student’s t-test (Baillie and Pilcher, 1973). 10
From statistical theory, t-values over 3.5 should be considered as significant, although in reality dendrochronologists prefer to see t-value ranges of 5, 6, and higher, and
for these to be well replicated from different, independent chronologies with local and
regional chronologies well represented. Examples of spurious t-values in excess of 7 have been noted, so it is essential that cross-matching with reference chronologies be 15
well replicated, and that this is confirmed with visual matches between the two graphs. It is general practice to cross-match samples from within the same phase to each other first, combining them into a site master, before comparing with the reference chronologies. This presents the advantage of averaging out the ‘noise’ of individual trees and is much more likely to obtain higher t-values and stronger visual matches. 20
In Fontainebleau, tree-ring cross-matching reveal two sets of ages. The first set corre-sponds to the timbers coming from the Salle de Bal (1596–1743), Clocher (1598–1698) and Petites Ecuries (1596–1750). The second one corresponds to the beams sampled in the frame-roof of the Th ´e ˆatre (1748–1850).
In reality, the probability of a particular date being valid is itself a statistical measure 25
depending on the t-values. Consideration must also be given to the length of the se-quence being dated as well as those of the reference chronologies. A sample with 30 or 40 years growth is likely to match with high t-values at varying positions, whereas a sample with 100 consecutive rings is much more likely to match significantly at only
CPD
3, 1063–1117, 2007Multi proxy reconstructions of
Fontainebleau temperature
N. Etien et al.
Title Page
Abstract Introduction
Conclusions References
Tables Figures
◭ ◮
◭ ◮
Back Close
Full Screen / Esc
Printer-friendly Version
Interactive Discussion
one unique position. Samples with ring counts as low as 50 may occasionally be dated, but only if the matches are very strong, clear and well replicated, with no other signifi-cant matching positions. Here, it is essential for intra-site matching when dealing with such short sequences. Consideration should also be given to evaluating the reference chronology against which the samples have been matched: those with well-replicated 5
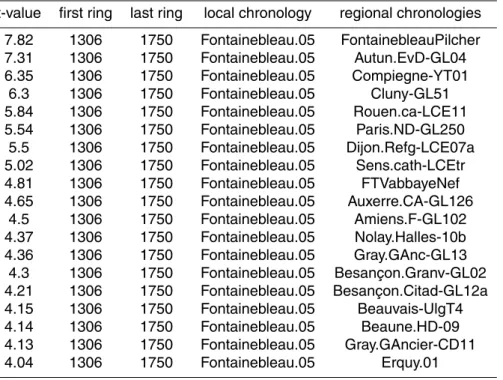
components which are geographically near to the sampling site are given more weight than an individual site or sample from the opposite end of the country. In spite of the problems of heterogeneity between the old stand of the 16th century with slow radial increments and the young of the 18th century with fast radial increments, the cross-matching of the local tree-ring chronology with that built by J. Pilcher from very 10
ancient living oaks (>400 years) validate the dating (Bernard, 1998; Pilcher, 1987;
http://www.ncdc.noaa.gov/paleo/ftp-treering.html) (Table 1). The visual agreement be-tween ring-width curves from Fontainebleau and regional chronologies is backed up by
t-values above 7 (Table 1).
Due to strong age effects, it is well known that ring widths cannot be used directly as
15
climatic proxies. Here, we have used the following procedure to obtain average growth indices for the 15 trees and the 18 beams sampled:
– For each tree and beam, second order polynomial regressions were calculated;
– Individual growth records were corrected from these polynomial fits;
– The average of the detrended records provides our growth index time series
20
(hereafter called GI).
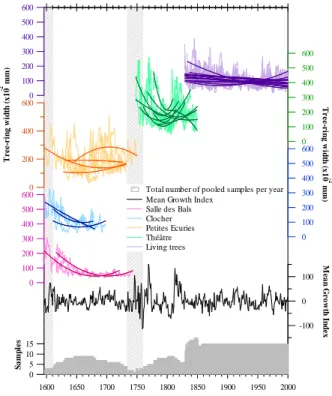
The ring widths and GI variation through time is represented in Fig. 2a. The growth
index varies between−112.9 and+151.1, with, by construction, a mean value of 0. The
mean GI is calculated as the average of all the individual sample GI. This average GI
is affected by the introduction of different samples. As a result, this average GI cannot
25
be as pertinent as signals obtained from RCS methods (Guiot et al., 2005) for climate reconstructions. Even after correction for growth heterogeneities and detrending, GI
shows no clear relationships with temperature (Etien et al., 20071).
CPD
3, 1063–1117, 2007Multi proxy reconstructions of
Fontainebleau temperature
N. Etien et al.
Title Page
Abstract Introduction
Conclusions References
Tables Figures
◭ ◮
◭ ◮
Back Close
Full Screen / Esc
Printer-friendly Version
Interactive Discussion
2.4 Isotopic analyses
Each ring was cut with a scalpel under a binocular magnifier to separate late wood from early wood. Early wood is elaborated from carbohydrates stored from previous
years (Barbaroux and Br ´eda, 2002). As a result, significant differences between the
isotopic composition of the early and late wood can exist (Lipp et al., 1991; Livingston 5
and Spittlehouse, 1996; Switsur et al., 1996). In order to maximize the signature of environmental parameters of the growing season, we have systematically separated the latewood from the earlywood in each ring and used only latewood for isotopic ratio measurements. Tree-rings formed in the same calendar year were pooled together. Samples were then milled with a 0.08 mm sieve in order to homogenise the mate-10
rial. Because wood is composed of various metabolites that undergo different isotopic
fractionations (Benner et al., 1987), isotopic analyses were performed onα-cellulose
extracted from wood according to the SOXHLET method elaborated by Green (1963) and modified by Leavitt and Danzer (1993). 50% of sample mass is lost at the end of the treatment. In the case of the narrowest rings, the remaining mass of individual ring 15
may be as small as 2 mg.
0.09–0.15 mg of the resultant cellulose samples are loaded in tin-foil cups for carbon isotope ratios analysis, and 0.2–0.3 mg in silver-foil cups for oxygen isotopic
analy-sis. The oxygen and carbon isotopic composition are determined with a Carbo Erba®
elemental analyser coupled to a Finnigan MAT252 mass spectrometer (at LSCE, 20
Gif/Yvette, Fr) according to the procedure described in Raffalli-Delerce et al. (2003).
We use an internal laboratory reference (Whatmann® CC31) of cellulose which has
been intercompared forδ13C and δ18O between the European laboratories involved
in the ISONET European project (Boettger et al., 2007). CC31 is analysed, once for 3 samples along the sequences of analyses. The measured sample values are cor-25
rected from the accepted values of the reference (−25.54‰ forδ13C and +31.85 ‰
forδ18O). The calibration of the mass spectrometer coupled to the elemental analyser
is conducted with the laboratory standards (CC31). We obtain a standard deviation
CPD
3, 1063–1117, 2007Multi proxy reconstructions of
Fontainebleau temperature
N. Etien et al.
Title Page
Abstract Introduction
Conclusions References
Tables Figures
◭ ◮
◭ ◮
Back Close
Full Screen / Esc
Printer-friendly Version
Interactive Discussion
of±0.25‰ for δ18O and ±0.10‰ for δ13C on the measurement of the isotopic
com-position of 10 consecutive CC31 standards (0 to 2 values being rejected). When this repeatability condition is established, the samples are analysed. The analysis of car-bon and oxygen isotopes of each sample is repeated at least once and up to four times. Repeated measurements are conducted so that outlier measurements are re-5
jected and standard deviations of final isotopic measurements of ±0.25‰ for δ18O
and ±0.10‰ for δ13C measurements of each sample are obtained. Altogether, with
replication, more than 3000 measurements were conducted on individual tree or beam cores.
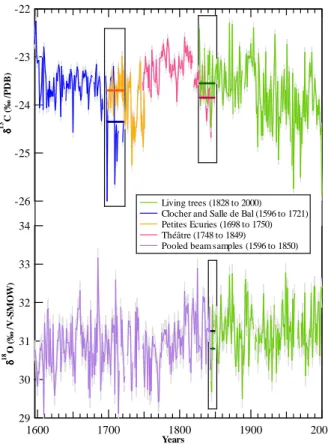
Where the records of the different sites overlap and enough matter is available, their
10
respective tree-rings were not pooled in order to test the signal coherency (Fig. 2b).
There is an overlap of 24 years between theδ13C data obtained for the combined set
Clocher and Salle de Bal with the site Petites Ecuries (from 1698 to 1721) and an overlap of 22 years between the site Th ´e ˆatre and the period covered by living trees
data (1828 to 1849). The mean value ofδ13C for the 24 years overlap is−24.35‰ for
15
samples from Salle des Bals and Clocher site and−23.70‰ for samples from Petites
Ecuries site. For the 22 years of overlap, the mean value ofδ13C is−23.85‰ for beams
of Th ´e ˆatre site and−23.55‰ for living trees. The observed shifts (0.65‰ and 0.3‰)
between the different parts of the record are more than twice the value of analytical
precision and are considered as significant. 20
δ13C variability between individuals growing under similar conditions seems to be
characteristic of C3 plant in general and the variability of the results is not improved
by any treatment (using wholewood, holocellulose orα-cellulose) (Van de Water et al.,
2002). Several studies that have used individual trees, as opposed to pooled samples, report age related trends in carbon isotopic ratios (e.g. McCarroll and Pawelleck, 2001; 25
Raffalli-Delerce et al., 2003; Masson-Delmotte et al., 2005). Tree-age effect appears as
a rise inδ13C followed by a decline and has been attributed to different factors such as
changes in access to light, CO2 isotopic composition gradients, or changes in tree
hy-draulic conductivity along its growth (see for instance Schleser and Jayasekera, 1985;
CPD
3, 1063–1117, 2007Multi proxy reconstructions of
Fontainebleau temperature
N. Etien et al.
Title Page
Abstract Introduction
Conclusions References
Tables Figures
◭ ◮
◭ ◮
Back Close
Full Screen / Esc
Printer-friendly Version
Interactive Discussion
Cernusak et al., 2001; McDowell et al., 2002; Sch ¨afer et al., 2000; Monserud and Mar-shall, 2001). From the estimates of beam ages, it is expected that the trends observed
from sets “Clocher and Salle de Bal” and “Th ´e ˆatre” should be affected by age effects
(Fig. 2b), but this age effect cannot account for the observedδ13C trend measured on
the set from “Petites Ecurie” (Fig. 2b). When coring beams, it is possible that the core is 5
too short and does not span the first rings of the tree, inducing wrong estimated of tree age. Moreover, our analytical procedure requires enough matter to conduct replicate
celluloseδ13C andδ18O analysis, and we therefore cannot work on individual beam
samples. As we do not have enough beam matter to produce individual records, we
cannot assess the precise source for13C trends (inter-beam variability for instance) or
10
perform a rigorous correction for juvenile effects. Over the instrumental period,
stan-dardisation methods have been previously applied for tree-ringδ13C records, in order
to analyse the climate signal preserved in tree-ringδ13C (see McCarroll and Loader,
2004, for a review). Such standardisation methods remain however questionable when analysing climate changes reflected in low-frequency variations in the absolute isotopic 15
ratios in trees. We therefore remain cautious about the decadal or longer fluctuations
of our stackedδ13C record, due to significant shifts between individual trees, small sets
of trees, and possible age effects.
Due to the lack of material, it was not possible to produce similar inter-site
com-parisons for δ18O data. A very short comparison is restricted to a 7 years overlap
20
(1844–1850) corresponding to the Th ´e ˆatre site and living trees. The mean value of
δ18O signal for this overlap period is 31.26‰ for beams of Th ´e ˆatre site and 30.80‰ for
living trees. However, ourδ18O measurement methodology provides us an uncertainty
of±0.25‰ (Etien et al., 20071). At most, the sum of the uncertainties between the two
signals (beams and living trees) reaches±0.5‰. The difference betweenδ18O signals
25
of this overlap is 0.46‰. The difference between fossil oaks and living trees signals
is not significant if we consider the maximal uncertainties on measurements. Overlap
periods are highlighted in Fig. 2b. Etien et al. (2007)1 have shown that for the living
Fontainebleau oaks, samples of three pooled trees are appropriate to reconstruct the
CPD
3, 1063–1117, 2007Multi proxy reconstructions of
Fontainebleau temperature
N. Etien et al.
Title Page
Abstract Introduction
Conclusions References
Tables Figures
◭ ◮
◭ ◮
Back Close
Full Screen / Esc
Printer-friendly Version
Interactive Discussion
local oxygen isotopic composition. As already mentioned, in this study, the number of
different trees (or beams) pooled to make a sample is superior to 3 except between
1596 to 1610 and 1733 to 1759.
The four hundred years long signal (as shown in Fig. 3a) is produced by averaging
the yearly values of carbon and oxygen of the different sites when measured separately.
5
2.5 Grape harvest data
In France, harvest dates (minimum authorized harvest date) have been ordained by re-gional authorities at least since the early 13th century in Burgundy (Beaune municipal archives), and have been carefully registered in parochial archives and later in munic-ipal archives. Vine harvest date records are handwritten, have absolute chronologies 10
and are homogeneous in time (Chuine et al., 2004). Vine development annual cy-cle strongly depends on climate conditions. Grape harvest dates are influenced by the temperature from March/April to August/September, earlier harvest dates occur-ring duoccur-ring warm spoccur-ring and summer years (Le Roy Ladurie et al., 2006). The
har-vest dates of “Pinot Noir” grapes in Burgundy (eastern France,∼250 km south east of
15
Fontainebleau) were shown to be a proxy for the maximum atmospheric temperature
from April to September (R=−0.71) (Etien et al., 20071). The main series was
con-structed from an ensemble of incomplete harvest dates series published in registers of 16 cities or villages in Burgundy (Fig. 2c). For periods where several documentary sources are available, the Burgundy grape harvest date is obtained by using the median 20
of the local dates. Dates are expressed as a delay with regard to 31 August (Le Roy Ladurie et al., 2006). This Burgundy series is available from the 14th century to 2003 (Chuine et al., 2004). The error, shown in Fig. 2c, is calculated using the maximum standard deviation between local series overlapping (at most 3 days). This maximum deviation, unchanging from 1354 to 2006, is applied to the whole series. Although the 25
grape harvest date record has exhibited a good potential to quantify past temperature
changes, such historical data can be biased by anthropogenic, non climatic, effects
CPD
3, 1063–1117, 2007Multi proxy reconstructions of
Fontainebleau temperature
N. Etien et al.
Title Page
Abstract Introduction
Conclusions References
Tables Figures
◭ ◮
◭ ◮
Back Close
Full Screen / Esc
Printer-friendly Version
Interactive Discussion
may have systematically delayed their harvests in order to obtain good quality wines, with high alcohol content, as expected by Burgundy wine consumers (Le Roy Ladurie et al., 2006).
3 Results
3.1 Proxy records
5
Here, we restrict the description of variability and trends to proxy records measured
from 1596 to 2000 (δ18O, Burgundy grape harvest dates, andδ13C). Figure 3a displays
these key data sets.
In Fontainebleau, latewoodδ18O ranges from 29.1‰ to 33.2‰ with an average level
at 31‰±0.7‰. The low frequency component of δ18O has been calculated using a
10
Singular Spectrum Analysis performed using the Spectra software (Ghil, 1997b). This analysis highlights a step increase between a first plateau from 1596 to 1743 with an
average δ18O of ∼30.8‰ and a second plateau from 1812 to 2000 with an average
δ18O reaching 31.3‰.δ18O values are not auto correlated with previous year values.
An important result is that our data show without ambiguity a 0.5‰δ18O increase in the
15
end of the 18th century. One could argue that this isotopic change could be caused by
different origins of the timber wood samples. Indeed, isotopic analyses conducted on
individual tree samples from living trees in Fontainebleau Forest have shown that
inter-tree differences ofδ18O can reach 0.54‰ (Etien et al., 20071). Here we can rule out a
“tree effect” because theδ18O data exhibit similar mean isotopic levels in the beginning
20
of the 18th century (Theater samples) than over the previous centuries (Salle de Bal,
Clocher and Petites Ecuries samples). Because the period of strong δ18O increase
corresponds to a common timber wood origin with 9 beams (Theater samples), the
signal is not likely to be due to sampling effects but to real climate effects. Finally, the
δ18O record shows a linear increase of 0.15‰ over the past 50 years and of 0.89‰
25
over the past 20 years (almost 2 standard deviations above the 20th century level)
CPD
3, 1063–1117, 2007Multi proxy reconstructions of
Fontainebleau temperature
N. Etien et al.
Title Page
Abstract Introduction
Conclusions References
Tables Figures
◭ ◮
◭ ◮
Back Close
Full Screen / Esc
Printer-friendly Version
Interactive Discussion
(Etien et al., 20071). The 15 years running mean curve has reached an unprecedented
level (>31.5‰) in 1992 (Fig. 3a).
Figure 3a displays interannual fluctuations of Burgundy grape harvest dates. These dates occur in average 27 days after 31 August and display a significant range of interannual fluctuations (up to 57 days). Grape harvests were shifted towards earlier 5
dates by 11 days over the past 50 years (the extreme warm year 2003 is not included in
Fig. 3a for grape harvest dates). Similarly toδ18O, grape harvest dates show no auto
correlation. The 15 years running mean curve shows that the wine grapes have been harvested as early as they are presently only once during the last 400 years (around
1685). Let us note thatδ18O and grape harvest exhibit different features: the level of
10
theδ18O has been particularly high over the last 15 years and its increase rate over
the last 50 years has been moderate; the value of the grape harvest date has been high over the last fifteen years, but not unprecedented, but its increase rate has been the highest of the last 400 years.
The mean Fontainebleauδ13C is−23.7±0.6‰ and varies from−26.3 to−22‰. The
15
signal shows no trend over the past 50 years. Tree-ringδ13C data should, in principle,
be corrected for the progressive 1‰ decrease of atmospheric CO2δ
13
C observed from
1951 to 1996, which parallels the increase in atmospheric CO2concentration and
re-sults from fossil fuel burning, deforestation and expansion of agriculture (Mook et al., 1983; Friedli et al., 1986; Francey et al., 1995). We take into account latitudinal and 20
seasonal fluctuations of CO2δ13C to obtain a correction suitable for Northern
Hemi-sphere mid-latitude growing season (M. Leuenberger calibration data, ISONET pro-gram) following Masson-Delmotte et al. (2005). Hereafter, we use the corrected record
of the isotopic composition of cellulose (δ13Ccorr) which refers to theδ13C values
cor-rected from CO2δ
13
C recent trend. The mean Fontainebleauδ13Ccorr is−23.5±0.7‰
25
and ranges from−25.8 to −21.6‰, with a linear increase of 1.43‰ over the past 50
years (mainly due to a step increase in the late 1970s). By contrast with grape harvest
dates and celluloseδ18O,δ13C shows a significant auto correlation (n=1997,R2=0.22
with one year lag and 0.20 with two year lag). Figure 3a shows clearly the strong
CPD
3, 1063–1117, 2007Multi proxy reconstructions of
Fontainebleau temperature
N. Etien et al.
Title Page
Abstract Introduction
Conclusions References
Tables Figures
◭ ◮
◭ ◮
Back Close
Full Screen / Esc
Printer-friendly Version
Interactive Discussion
fluence of wood sample number and origin on δ13C records (as mentioned above in
Sect. 2.4).
Figure 3b presents Grape harvest dates, δ18O, Fontainebleau reconstructed Tmax
AMJJAS and Central England Tmean AMJJAS records for the period from 1600 to
1800. The comparison between the variability of each parameter will be discussed 5
in Sect. 3.3.
3.2 Calibration
Multiple linear regression were performed in the calibration study (Etien et al., 20071)
to assess the response of environmental records (δ13C,δ18O,δ2H, Burgundy and
Ar-genteuil grape harvest dates, tree-ring growth indices of Fontainebleau forest oaks and 10
number of fire starts in the Fontainebleau forest) to climatic fluctuations of the past century. Correlations between environmental parameters and proxy records were
sys-tematically tested by using the R software (http://www.r-project.org/). This statistical
analysis highlighted one climate variable, the maximum growing season temperature
(from April to September, hereafter calledTmax AMJJAS) which exhibits the most
ro-15
bust correlation with tree ring isotopic data and documentary records. A methodology
combining available proxy records to estimate past variations ofTmaxAMJJAS was also
proposed (Etien et al., 20071).
For the Fontainebleau site, only four of these parameters mentioned above are
avail-able until 1596:δ18O,δ13C, growth indices and Burgundy grape harvest dates (GHD).
20
Following Etien et al.’s approach, we use an Aka¨ıke test to construct the most effi
-cient set of proxy records. The lowest Aka¨ıke Information Criterion (best combination
of proxies, (Aka¨ıke, 1973) is obtained while combining Burgundy grape harvest dates,
δ18O andδ13Ccorrof oak cellulose. The relationship betweenTmaxAMJJAS and these
parameters is: 25
TmaxAMJJAS=4.16+0.12×δ13Ccorr+0.70×δ18O−0.08×GHD (1)
The multiple determination coefficient (R2) is equal to 0.590, the adjusted R-squared
CPD
3, 1063–1117, 2007Multi proxy reconstructions of
Fontainebleau temperature
N. Etien et al.
Title Page
Abstract Introduction
Conclusions References
Tables Figures
◭ ◮
◭ ◮
Back Close
Full Screen / Esc
Printer-friendly Version
Interactive Discussion
is equal to 0.576 and theR correlation between reconstructed and instrumental Tmax
AMJJAS data of calibration period is 0.768. The probability of a type I risk is 0.298,
3.6.10−6 and 1.28.10−10 for δ13Ccorr, δ
18
O and GHD respectively. As δ13C
corre-sponds to the highest risk and is a parameter potentially affected by disruption factors
(CO2effect, age effect, wood origin, see Sects. 2.4 and 3.1) we tested the relevance of
5
removing it from the multiple parameters regression. Equation (1) transforms to:
TmaxAMJJAS=−0.013+0.75×δ18O−0.08×GHD (2)
The multiple determination coefficient (R2) is equal to 0.585, the adjusted R-squared
is equal to 0.576 and the R correlation between reconstructed and instrumentalTmax
AMJJAS data is 0.765. The probability of a type I risk is 2.6.10−7 and 5.7.10−11 for
10
δ18O and GHD, respectively.
The strength of the relationship is nearly the same with or without theδ13Ccorrproxy.
Therefore, we decided to build reconstructions based on δ18O and GHD only, in
or-der to avoid the problems caused by age-related trends ofδ13C. We have tested that
there is no significant differences on the reconstructed temperatures when using the
15
high frequency component of correctedδ13C. Moreover, the lowest Aka¨ıke Information
Criterion is not obtained while combining Burgundy grape harvest dates, δ18O and
detrendedδ13Ccorrof oak cellulose.
The confidence interval (mean difference between homogenised and reconstructed
Tmax AMJJAS) was obtained using a bootstrap methodology with 1000 experiments
20
and is estimated to be±0.55◦C. This “linear model” uncertainty has to be compared to
the analyticalδ18O measurements uncertainty (±0.25‰) (Etien et al., 20071), inducing
reconstruction error of up to±0.19◦C. Uncertainties may also arise from the variability
ofδ18O between different trees. However, it was shown that a mean offset of 0.13‰ is
observed between two groups of 15 trees growing in similar environmental conditions 25
and that in more than 87% of the case, theδ18O inter-parcel difference is less than
the analytical precision (Etien et al., 20071). Unfortunately, this variability can increase
CPD
3, 1063–1117, 2007Multi proxy reconstructions of
Fontainebleau temperature
N. Etien et al.
Title Page
Abstract Introduction
Conclusions References
Tables Figures
◭ ◮
◭ ◮
Back Close
Full Screen / Esc
Printer-friendly Version
Interactive Discussion
restrictive (Etien et al., 20071). In this case, the error introduced on the reconstructed
temperature can reach±0.38◦C (including both analytical precision and dispersion
be-tween neighbouring trees). Grape harvest dates are expressed as a delay with regard to 31 August (Le Roy Ladurie et al., 2006), with an error of three days (see Sect. 2.5),
which can induce a reconstruction error of up to±0.24◦C. At most, the sum of these
un-5
certainties reaches±0.62◦C, a magnitude comparable to the “linear model” bootstrap
uncertainty.
The minimum uncertainty of 0.55◦C, calculated with the bootstrap method, is an
un-certainty in the linear reconstruction model fitting and does not include all the measure-ments errors as variability between various samples for extreme years and instrumental 10
biases of ancient thermometers and measurements conditions.
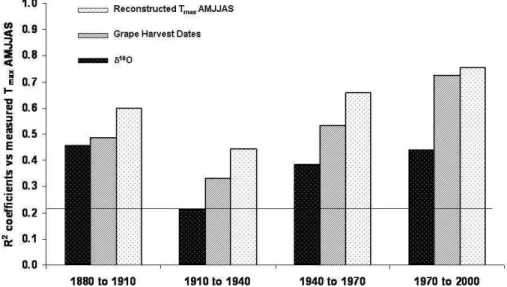
For the instrumental period only, Fig. 4 shows theR2 coefficients of the correlations
between δ18O, grape harvest dates, reconstructed Tmax AMJJAS and homogenised
instrumental Tmax AMJJAS. On average, from 1880 to 2000, R2 coefficients are,
re-spectively, of 0.37 forδ18O, 0.52 for grape harvest dates and 0.62 for reconstructed
15
TmaxAMJJAS with respect to instrumentalTmaxAMJJAS. We have analysed the
stabil-ity of these correlations over sub-intervals of 30 years. The time period from 1910 to
1940 appears as remarkable due to minimal correlation coefficients, the lowest (δ18O
versus measuredTmaxAMJJAS) reachingR2=0.21 (R2is significant above 0.21,n=30,
p=0.01 according to a Student test). The poor correlation of the records could be linked
20
to the historical context of this 30 years time period spanning World I and II. It cannot be excluded that missing data alter the quality of instrumental record homogenisation during this time period and therefore that the lower correlation may result from ho-mogenised data.
3.3 Reconstruction and comparison with other reconstruction
25
Figure 5a displays Fontainebleau Tmax AMJJAS reconstruction described in Eq. (2).
Reconstructed maximum growing season temperature range from 18.3◦C to 24.6◦C
CPD
3, 1063–1117, 2007Multi proxy reconstructions of
Fontainebleau temperature
N. Etien et al.
Title Page
Abstract Introduction
Conclusions References
Tables Figures
◭ ◮
◭ ◮
Back Close
Full Screen / Esc
Printer-friendly Version
Interactive Discussion
with an average level at 21.1±0.55◦C. The 15 years running mean curve shows that
the reconstructed temperature has reached since 1994 a mean level of 22◦C, a value
never observed before. An important result is that our data show without ambiguity a
0.8◦C increase for the time period from 1975 to 2000. This recent trend is common
to the 2 proxies used in the reconstruction: theδ18O record shows a linear increase
5
of 0.89‰ over the past 20 years, and grape harvests were shifted towards earlier dates by 13 days since 1963. Extreme years have been detected using each proxy, assuming that an extreme year is defined as deviation above or below the average parameter by more than 1.5 standard deviation. These extreme years are reported
on Fig. 3a. The years recognised as extreme are not the same in δ18O and grape
10
harvest dates records (only 1686 and 1893 are shared). For the instrumental period,
the agreement between δ18O and measured Tmax AMJJAS is only 22%, and 75%
between GHD and measured Tmax AMJJAS. Obviously, the δ18O proxy is not highly
capable in extreme values reconstruction. This is in agreement with Etien et al. (2007)1
who concluded that the inter-tree isotopic variability increased during extreme years 15
leading to a deteriorated accuracy of theδ18O values. Nevertheless, for instrumental
period, all the extreme warm values in the δ18O record correspond to hot (above 1
standard deviation in the measured Tmax AMJJAS series) or dry years (as 1918 or
1989).
We compare the decadal-scale fluctuations which are common to both proxy records 20
and therefore appear clearly in the reconstruction. This is the case for warm episodes of the 1610s, 1640s, 1660s, 1900s, 1950s. Such periods have been described by Le Roy Ladurie et al. (2006) and compared with Alpine glacier retreats observed in the 1640s, 1860s. Our growing season maximum temperature reconstruction for Fontainebleau therefore captures some warm summers that may be linked to phases 25
of Alpine glacier retreat in the middle 17th century and with the end of the Little Ice Age.
The decadal coherency between δ18O and grape harvest dates disappears during
the interval from 1770 to 1870. This mismatch partly arises from different centennial
CPD
3, 1063–1117, 2007Multi proxy reconstructions of
Fontainebleau temperature
N. Etien et al.
Title Page
Abstract Introduction
Conclusions References
Tables Figures
◭ ◮
◭ ◮
Back Close
Full Screen / Esc
Printer-friendly Version
Interactive Discussion
trends described in Sect. 3.1. Indeed,δ18O data clearly show an increasing (warming)
trend, while harvests occur later (“cooling trend”). Extrem warm years may be
associ-ated with specific timing of heat waves, which can affect differently celluloseδ18O and
grape harvest dates if they occur at the flowering season or the time of maximum
pho-tosynthesis. Specific hydrological effects are also expected to have different imprints
5
on proxy records. We have shown that ourδ18O trend is not affected by tree sampling.
By contrast, historical studies (Le Roy Ladurie et al., 2006) suggest that grape harvest
dates were likely influenced by anthropogenic effects. Wine producers, in particular
those managing the best Burgundy vineyards, indeed tended to modify their practices to adjust their quality to the consumer demand. Grape harvest dates were artificially 10
delayed to obtain higher sugar contents and therefore wines with higher alcohol proof.
Figure 3b highlights the variability of Central EnglandTmeanAMJJAS, Fontainebleau
reconstructedTmaxAMJJAS,δ18O and grape harvest dates records from 1660 to 1800.
Periods of early harvesting mentioned by Le Roy Ladurie (2006) are also indicated by vertical grey bars. These group of years do not systematically coincide with extreme 15
warm temperatures (as it had been previously defined); however, they coincide with
warm years in terms of grape harvest dates, δ18O, Fontainebleau reconstructedTmax
AMJAS and Central EnglandT mean in most cases (7 years out of 8, with the exception
of 1662–1671). The vertical blue bar displays the cold period of 1687 to 1700 and highlights cold trends in each parameter. Two other cold episodes can be observed 20
in the intervals: 1671–1676 and ∼1770. Vertical red lines are displayed for specific
warm events such as the beginning of the Grindelwald glacier retreat, starting in 1640 (Zumb ¨uhl, 1980) or the growing seasons of 1788 et 1794 documented as very dry and hot with an exceptionnal intra-annual meteorological variability. Figure 3b shows that such intra-annual variability results in a lack of coherency between grape harvest 25
dates andδ18O. Finally, vertical dashed bars are used to show the time period where
changes in agricultural practices are documented and are expected to affect strongly
grape harvest dates.
Using proxies with different centennial trends for the reconstruction leads to smooth
CPD
3, 1063–1117, 2007Multi proxy reconstructions of
Fontainebleau temperature
N. Etien et al.
Title Page
Abstract Introduction
Conclusions References
Tables Figures
◭ ◮
◭ ◮
Back Close
Full Screen / Esc
Printer-friendly Version
Interactive Discussion
the variability. As a result, our multi-proxy reconstruction only captures a weak cen-tennial trend over the late 18th–19th centuries. At this stage, we have just used the inter-annual calibration. It could be possible to refine the methodology by keeping low frequency component of grape harvest dates, following the approach of Moberg et al. (2005) and Guiot et al. (1983).
5
In the beginning of this section, we have discussed the relevance of our record in terms of past changes in temperature, addressing changes in mean state and inter-annual variability. In principle, it would be of major interest to compare this recon-struction with direct instrumental measurements. However, no homogenised tempera-ture record is available for central or western France prior to 1873 (Paris Montsouris), 10
and no temperature record is available prior to 1659 (CET Manley, 1974). Having
shown that Fontainebleau growing season temperature (Tmax AMJJAS) is well
corre-lated (R2>0.80) with 20th century temperature from South-Western France to
North-ern Germany (Etien et al., 20071), we have searched long homogenised
tempera-ture data in North-Western Europe. We have therefore used two datasets of an-15
cient instrumental meteorological observations from other regions: Central England temperature record from Manley (1974), from 1659 to 1973, updated by Parker et al. (2005), and De Bilt data from the Netherlands, updated with the EC EMULATE
project (http://www.cru.uea.ac.uk/projects/emulate/) from 1706 to 2006. Ancient
instru-mental mean growing season temperature series of Central England (TmeanAMJJAS)
20
range from 10.9 to 14.9◦C with an average level at 13.6±0.7◦C (Tmax AMJJAS ranges
from 14.9 to 19.7◦C with a mean value of 17.4±0.9◦C). The Tmean AMJJAS of De Bilt
series is 13.9±0.7 and varies from 11.7 to 16.2◦C (Tmax AMJJAS ranges from 16.9 to
21.9◦C with an average level at 19
±0.9◦C). Our calibration is designed to reconstruct
maximum temperatures. The oldest homogenised Central England and De Bilt tem-25
perature series are only available forTmeanAMJJAS. For the periods when both Tmean
andTmaxare available, they show a good correlation (R2=0.80 and 0.94, respectively,
for De Bilt and Central England) (Fig. 5a). Being aware of this, we compare our
recon-struction with early instrumentalTmeandata.
CPD
3, 1063–1117, 2007Multi proxy reconstructions of
Fontainebleau temperature
N. Etien et al.
Title Page
Abstract Introduction
Conclusions References
Tables Figures
◭ ◮
◭ ◮
Back Close
Full Screen / Esc
Printer-friendly Version
Interactive Discussion
In order to assess the reliability of our proxy record, we have compared some of the
results with available past temperature reconstructions. Among the various efforts to
quantify past temperature changes, two types of datasets are available: first, recon-structions of the average Northern Hemisphere temperature (Jones et al., 1998; Mann et al., 1999; Moberg et al., 2005; Rutherford et al., 2005; Smith et al., 2006); second, 5
gridded reconstructions for Europe, making possible to extract temperature estimates
for large areas (Briffa et al., 1988; Guiot et al., 2005; Luterbacher et al., 2004). These
reconstructions are generally based on long instrumental records (Manley, 1974), tree-ring width or density records, and/or historical information. Only few reconstructions take into account other proxy records (Luterbacher et al., 2004; Smith et al., 2006). 10
None of these reconstructions include temperature records from central or western France.
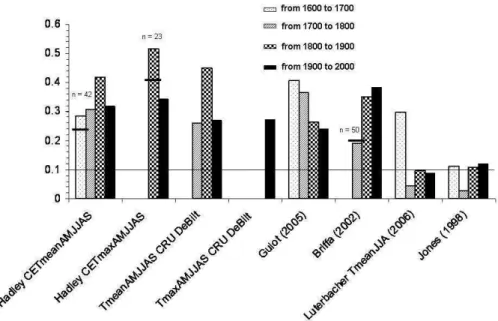
We have tested the linear correlation between our Fontainebleau TmaxAMJJAS
re-construction and other temperature series displayed on Fig. 5a. Figure 5b displays the
significant correlation coefficients (R2) obtained with some of the series:
instrumen-15
talTmean AMJJAS andTmax AMJJAS from Central England and De Bilt, reconstructed
TmeanAMJJAS of Western Europe (Guiot et al., 2005), reconstructedTmeanAMJJAS at
50◦N, 0◦W (Briffa et al., 1988), reconstructed EuropeanTmean JJA (25 W–40 E; 35 N–
70 N; multiproxy reconstruction, Luterbacher et al., 2004), and reconstructedTmeanJJA
of the Northern Hemisphere (multi-proxy reconstruction, Jones et al., 1998). We have 20
analysed the stability of the correlations over four century-long time periods: 1600 to 1700, 1700 to 1800, 1800 to 1900 and 1900 to 2000. The best correlation is obtained
with Central EnglandTmaxAMJJAS (R2=0.39 from 1878 to 2000) and Central England
Tmean AMJJAS (R2=0.27 from 1659 to 2000). A very good correlation is also obtained
with De Bilt data (R2=0.32 for Tmean AMJJAS from 1706 to 2000 and 0.27 for Tmax
25
AMJJAS from 1901 to 2000). For both sites, the best correlation with Fontainebleau
appears over the 19th century. For this century,R2 is between 0.4 and 0.5. It is
sur-prising to obtain better correlations between Fontainebleau reconstructed Tmax
AMJ-JAS and the growing season temperatures in Central England and De Bilt over the
CPD
3, 1063–1117, 2007Multi proxy reconstructions of
Fontainebleau temperature
N. Etien et al.
Title Page
Abstract Introduction
Conclusions References
Tables Figures
◭ ◮
◭ ◮
Back Close
Full Screen / Esc
Printer-friendly Version
Interactive Discussion
19th century than over the 20th. This result suggests that the high coherency between Northern France, Central England and the Netherlands temperatures observed from
instrumental data (R2 between 0.4 and 0.5) persist back over the 19th century and
that the quality of Central England and De Bilt homogenised data is very good. The
comparison of our reconstructedTmaxAMJJAS and Central England and De Bilt data
5
reveals a mismatch at the decadal scale in the early 20th century (∼1920–1930). Our
reconstruction shows a small maximum centred on 1925 which is not seen in the other records (Fig. 5a). This may explain the lower correlation obtained for the 20th century. Again, we highlight a problem occurring in the interval between World War I and II.
Prior to the 19th century, ancient instrumental records must be taken with caution. De 10
Bilt data are independent of Central England temperature from 1740 onwards. Before 1740, Central England temperature data have been used for the homogenisation of
Tmean at De Bilt. The sources used by Manley to produce the ancient Central England
Temperature are not known (P. Jones, personal communication). It is expected that Central England temperature may be biased in summer (overestimation of warmth due 15
to observation methods) prior to 1740 (P. Jones, personal communication). The good
correlations between reconstructed Tmax AMJJAS at Fontainebleau, and De Bilt and
Central EnglandTmeanAMJJAS over the 16th and 17th centuries support the quality of
reconstructions and early instrumental records, despite these known biases.
We now compare our Fontainebleau record with multi-proxy European temperature 20
reconstructions. Guiot et al. (2005) has used dendrochronological data, Greenland ice
coreδ18O data, grape harvest date records and instrumental temperature data, with
a focus on Southern Europe growing season temperature. The correlation observed over the 19th and 20th century is good (though less good than with Central England or the Netherlands) and reflects the coherency between North and South France temper-25
ature. Surprisingly, the correlation with this reconstruction increases from the present to the past. We suggest that this is an artefact of the data used for Guiot et al. (2005) reconstruction and an increasing weight of earlier Burgundy harvest dates (Le Roy Ladurie, 1990).
CPD
3, 1063–1117, 2007Multi proxy reconstructions of
Fontainebleau temperature
N. Etien et al.
Title Page
Abstract Introduction
Conclusions References
Tables Figures
◭ ◮
◭ ◮
Back Close
Full Screen / Esc
Printer-friendly Version
Interactive Discussion
Briffa et al. (1988) has produced reconstruction of Tmean AMJJAS for Europe using
latewood density series from coniferous trees. Despite the fact that his reconstruction is better for Northern Europe, we obtain a relatively high correlation over the 19th and
20th centuries with the grid point closest to Fontainebleau (50◦N, 0◦E). This correlation
however collapses for the time period from 1750 to 1800, possibly because Briffa et
5
al. (1988) reconstruction relies then mostly on Northern Europe tree-ring data.
Luterbacher et al. (2004) produced regional seasonal European temperature datasets using ancient instrumental data, documentary-based temperature indices and proxy records (Northern Eurasian tree rings, Greenland ice cores). For the 18th to 20th
century,TmeanJJA does not show significant correlation with our reconstruction. An
in-10
creased correlation is observed for the 16th century, potentially linked with some of the records used in his approach (e.g. Central England Temperature).
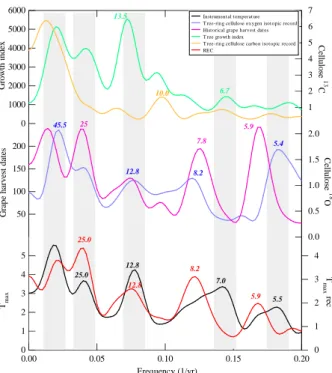
3.4 Spectral properties
Spectral analyses of Fontainebleau tree-ring records (δ13C,δ18O, growth indices),
bur-gundy historical grape harvest records and the temperature reconstructions derived 15
from the linear regression model described in Sect. 3.2 have been conducted with the Analyseries software (Paillard et al., 1996) using a Blackman-Tuckey method with Bartlett windows. The resolution has been adjusted to capture 50% of variance, with
a bandwidth of 0.024 yr−1. The results have been compared to calculations conducted
with other methods (Maximum Entropy, Multi Taper Method, Singular Spectrum Analy-20
sis) and have been shown to be robust with respect to the spectral analysis methodol-ogy.
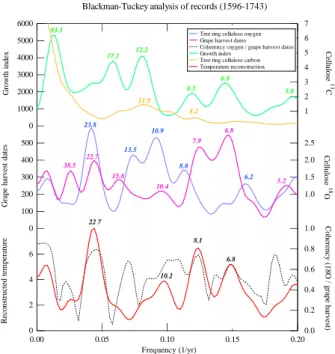
The power spectra are compared to the power spectrum of the homogenised temper-ature data for the period from AD 1879 to 2000. Then, the power spectra are compared
over different time intervals of similar length (148 years): 1596 to 1743; 1748 to 1896;
25
and 1853 to 2000. These intervals have been restricted to a length of 148 years
be-cause there are missing celluloseδ18O from 1743 to 1748. Other missing data have