CPD
7, 3919–3957, 2011Cross-comparison at the Pyrenees
I. Dorado Li ˜n ´an et al.
Title Page
Abstract Introduction
Conclusions References
Tables Figures
◭ ◮
◭ ◮
Back Close
Full Screen / Esc
Printer-friendly Version Interactive Discussion
Discussion
P
a
per
|
Dis
cussion
P
a
per
|
Discussion
P
a
per
|
Discussio
n
P
a
per
|
Clim. Past Discuss., 7, 3919–3957, 2011 www.clim-past-discuss.net/7/3919/2011/ doi:10.5194/cpd-7-3919-2011
© Author(s) 2011. CC Attribution 3.0 License.
Climate of the Past Discussions
This discussion paper is/has been under review for the journal Climate of the Past (CP). Please refer to the corresponding final paper in CP if available.
Tree-ring proxy based temperature
reconstructions and climate model
simulations: cross-comparison at the
Pyrenees
I. Dorado Li ˜n ´an1,2, U. B ¨untgen3, F. Gonz ´alez-Rouco4, E. Zorita5,6,
J. P. Mont ´avez7, J. J. G ´omez-Navarro7, M. Brunet8, I. Heinrich1, G. Helle1, and E. Guti ´errez2
1
Helmholtz Centre Potsdam, German Centre for Geosciences, Climate Dynamics and Landscape Evolution, Potsdam, Germany
2
University of Barcelona, Department of Ecology, Barcelona, Spain
3
Swiss Federal Research Institute WSL, 8903 Birmensdorf, Switzerland
4
Universidad Complutense de Madrid, Ciudad Universitaria, 28040 Madrid, Spain
5
Helmholtz-Zentrum-Geesthacht, Geesthacht, Germany
6
Bert Bolin centre for Climate Research, University of Stockholm, Sweden
7
Departamento de F´ısica, Universidad de Murcia, Murcia, Spain
8
CPD
7, 3919–3957, 2011Cross-comparison at the Pyrenees
I. Dorado Li ˜n ´an et al.
Title Page
Abstract Introduction
Conclusions References
Tables Figures
◭ ◮
◭ ◮
Back Close
Full Screen / Esc
Printer-friendly Version Interactive Discussion
Discussion
P
a
per
|
Dis
cussion
P
a
per
|
Discussion
P
a
per
|
Discussio
n
P
a
per
|
Received: 19 October 2011 – Accepted: 27 October 2011 – Published: 17 November 2011
Correspondence to: I. Dorado Li ˜n ´an ([email protected])
CPD
7, 3919–3957, 2011Cross-comparison at the Pyrenees
I. Dorado Li ˜n ´an et al.
Title Page
Abstract Introduction
Conclusions References
Tables Figures
◭ ◮
◭ ◮
Back Close
Full Screen / Esc
Printer-friendly Version Interactive Discussion
Discussion
P
a
per
|
Dis
cussion
P
a
per
|
Discussion
P
a
per
|
Discussio
n
P
a
per
|
Abstract
May-to-September mean temperatures over the larger Pyrenees area (Northern Spain and Southern France) are reconstructed for the last Millennium from 22 maximum den-sity (MXD) tree-ring chronologies. For the standardization of the tree-ring series, two detrending methods (Regional Curve Standardization (RCS) and 300-yr spline) were 5
combined with and without an adaptive power transform (PT) for variance stabilization in the individual series. Thus, four different standardization procedures were applied to the data. Additionally, different regional chronologies were generated by computing a mean composite, averaging the local chronologies, or by applying Principal Compo-nents Analysis (PCA) to extract common variance from the subsets of individual MXD 10
chronologies.
Calibration-verification trials were performed using the product of the three regional aggregation methods in split periods: 1900–1952 and 1953–2006. Two methods were used to calibrate the regional chronology: regression and a simple variance-matching, sometimes also known as composite-plus-scaling. The resulting set of temperature 15
reconstructions was compared with climate simulations performed with global (ECHO-G over the last Millennium for the target region) and regional (MM5) climate models.
The reconstructions reveal inter-annual to multi-centennial temperature variations at the Pyrenees region for the last 750 yr. Generally, variations at inter-decadal timescales, including the cold periods associated with the solar minima, are common to 20
all reconstruction variants although some discrepancies are found at longer timescales. The simulations of the global circulation model ECHO-G and the regional model MM5 agree with the tree-ring based reconstructions at decadal to multi-decadal time-scales. However, the comparison also highlights differences that need to be understood, such as the amplitude of the temperature variations and the discrepancies regarding the 25
CPD
7, 3919–3957, 2011Cross-comparison at the Pyrenees
I. Dorado Li ˜n ´an et al.
Title Page
Abstract Introduction
Conclusions References
Tables Figures
◭ ◮
◭ ◮
Back Close
Full Screen / Esc
Printer-friendly Version Interactive Discussion
Discussion
P
a
per
|
Dis
cussion
P
a
per
|
Discussion
P
a
per
|
Discussio
n
P
a
per
|
1 Introduction
Estimations of future climate change indicate that variations in the global climate may have larger impacts at regional scales (IPCC, 2007). However, such forthcoming pro-jections are hampered by the limited knowledge of the mechanism that gives rise to variability at multi-decadal and longer timescales due to the short length of instru-5
mental records. The relative abundance of proxy records, mostly for temperature and precipitation, during the last millennium (e.g. Jones et al., 2009) offers the possibility to improve our understanding of past climate variability at interdecadal and longer time scales during this period (Jansen et al., 2007). Currently, two main approaches are be-ing used to advance this line of research (Jansen et al., 2007; Jones and Mann, 2004; 10
Mann et al., 2008): (1) creating new or extending the existing climate reconstructions back in time using documentary evidences or environmental proxies such as tree-ring parameters (width, density, isotopic content) corals, speleothems (Jones et al., 2009); and (2) simulations of natural and forced climate variability using climate models.
Tree-rings may contain useful information on past environmental conditions, which 15
can be used to reconstruct past climate using statistical relationships to a target cli-mate variable (Fritts, 1976; Cook and Kairiukstis, 1990). In this respect, tree-ring width and density are perhaps the most widely used proxies, and their relationships to sea-sonal temperatures have been extensively studied (Briffa, 2002, 2004; B ¨untgen et al., 2006, 2007, 2008; Esper et al., 2002, 2005a; Grudd, 2008). Although tree-ring mea-20
surements are accurately dated to the year, their ability to encode centennial to multi-centennial climate variability is often limited by the standardization technique used to remove age-related trends in tree-ring time series. Thus, the climate signal at these timescales may be distorted by the technique used to remove non-climatic variations in tree-ring series (Cook et al., 1995; Esper et al., 2002, 2003; Briffa and Melvin, 2008). 25
CPD
7, 3919–3957, 2011Cross-comparison at the Pyrenees
I. Dorado Li ˜n ´an et al.
Title Page
Abstract Introduction
Conclusions References
Tables Figures
◭ ◮
◭ ◮
Back Close
Full Screen / Esc
Printer-friendly Version Interactive Discussion
Discussion
P
a
per
|
Dis
cussion
P
a
per
|
Discussion
P
a
per
|
Discussio
n
P
a
per
|
practice and the effect of applying it to a suboptimal set of tree-ring data still requires further tests (Esper et al., 2003). In addition to standardization issues, the technique applied to estimate the reconstructed values also implies a challenge: whereas simple linear regression methods may underestimate low-frequency variability (Esper et al., 2005b; Zorita et al., 2010; McCarrol et al., 2011) variance-matching, in the following 5
referred as scaling, shows better performance in retaining large scale variations but at the expense of inflated error estimates (Esper et al., 2005b; McCarrol et al., 2011)
A variety of climate models of increasing complexity is available for palaeoclimate simulations experiments, from energy balance models (EBM; Hegerl et al., 2006) to three-dimensional coupled ocean-atmosphere general circulation models (GCMs; 10
Zorita et al., 2005). General circulation models have a global coverage, and produce complete 3-dimensional climate simulations, although their spatial resolution is still lim-ited by computing power requirements. However the output of climate models depends on the characteristic of the model employed and on the prescribed external forcing, which are also estimated from proxy data (Jansen et al., 2007). Their validation is 15
based on the assessment of their skill to reproduce the main characteristics of the cur-rent observed climate, although this does not guarantee their reliability to project future or past climate changes.
Alternatively, Regional Climate Models (RCM) simulate a limited area domain, thus reducing the computational requirements, which then allows for simulations of higher 20
resolutions. Simulations with this kind of models for the last millennium have started to become available for specific regions in the last years (e.g. G ´omez-Navarro et al., 2011a, b). This allows for more realistic model-data comparisons due to their improved resolution and characterization of land use categories, which permits a better repre-sentation of physical processes at regional scales.
25
CPD
7, 3919–3957, 2011Cross-comparison at the Pyrenees
I. Dorado Li ˜n ´an et al.
Title Page
Abstract Introduction
Conclusions References
Tables Figures
◭ ◮
◭ ◮
Back Close
Full Screen / Esc
Printer-friendly Version Interactive Discussion
Discussion
P
a
per
|
Dis
cussion
P
a
per
|
Discussion
P
a
per
|
Discussio
n
P
a
per
|
al., 2002; Tan et al., 2009; Gonz ´alez-Rouco et al., 2009; Zorita et al., 2010; G ´omez-Navarro et al., 2011a).
This work presents a temperature reconstruction for the Pyrenees region based on tree-ring density data. In addition, it also presents a comparison of the resulting palaeo-climate evidence with available GCM and RCM simulations over the area. The Pyre-5
nees Range constitutes an interesting area for palaeoclimate reconstruction and simu-lations due to its location in the transition zones between two ecoclimatic regions (Eu-rosiberian and Mediterranean climate types) where future climate change is expected to have large effects (IPCC, 2007). The particular ecotonal location and the existence of old growth forest at their limit of natural distribution point to climate as the main 10
driver of tree-growth. Indeed, temperature series have shown strong inter-site relation-ships between distant sites (Agust´ı-Panareda et al., 2000) pointing out the suitability of individual temperature sensitive tree-ring chronologies to be used in an ensemble regional temperature reconstruction. In accordance, B ¨untgen et al. (2008) developed the first regional maximum temperature reconstruction for the Pyrenees based on two 15
local tree-ring chronologies sensitive to temperature variations.
Here, simulations of the climate of the last Millennium with the ECHO-G (Gonz ´alez-Rouco et al., 2009) over the Pyrenees region are considered. Additionally, two high resolution regional paleoclimate simulations conducted with the mesoscale model MM5 driven by boundary conditions obtained from the ECHO-G simulations (G ´omez-20
Navarro et al., 2011a, b) are available for the Iberian Peninsula. Hence, for the Pyre-nees mountain system, networks of palaeoclimate proxy data (tree-rings) as well as global and regional scale climate simulations are available for inter-comparison.
In the first part of this study we test different methods to construct the tree-ring based climate reconstructions, considering the most usual approaches for the stan-25
CPD
7, 3919–3957, 2011Cross-comparison at the Pyrenees
I. Dorado Li ˜n ´an et al.
Title Page
Abstract Introduction
Conclusions References
Tables Figures
◭ ◮
◭ ◮
Back Close
Full Screen / Esc
Printer-friendly Version Interactive Discussion
Discussion
P
a
per
|
Dis
cussion
P
a
per
|
Discussion
P
a
per
|
Discussio
n
P
a
per
|
al., 2008), adapted to mean temperatures that will be developed in the present study. The specific aim is to obtain not only a new reconstruction of past temperatures in the Pyrenees, but also an evaluation of the uncertainties related to the methodological variants employed. In the second part of the study, we compare the climate variabil-ity reconstructed from the tree-ring records with that simulated by a GCM and a RCM 5
over the Pyrenees area, since this represents an opportunity to evaluate the realism of model simulations in reproducing available evidences of past climate variability.
2 Methods
A dataset of 22 maximum density chronologies (MXD) covering the Pyrenees area was available for the present study, including the two chronologies previously used to 10
develop the first tree-ring based regional reconstruction of past maximum temperatures at the Pyrenees (B ¨untgen et al., 2008) and additional data published in B ¨untgen et al. (2010). Compared to this previous maximum temperature reconstruction, the new data set covers a wider area and uses a larger replication, not only in most recent centuries, but also in the earliest part of the period (1260–1350 AD).
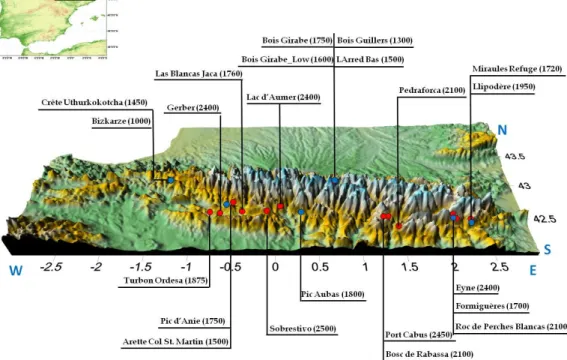
15
The location, elevation and tree species at each site are indicated in Fig. 1. The species sampled were Pinus uncinata Ramond ex DC. in Lam. et DC., a shade-intolerant and long-lived conifer growing under temperate subalpine climate conditions and dominating at elevations above 1800 m a.s.l., and Abies alba Mill. usually grow-ing at humid sites on north facgrow-ing, shady slopes and at elevations above 1200 m a.s.l. 20
(Macias et al., 2006).
The 22 MXD chronologies comprise 804 individual tree-ring series from the Pyre-nees and nearby mountain areas. As described in B ¨untgen et al. (2008, 2010), to obtain the MXD measurements from tree-rings, all cores were sanded and vi-sually cross-dated following dendrochronological procedures described by Stokes 25
CPD
7, 3919–3957, 2011Cross-comparison at the Pyrenees
I. Dorado Li ˜n ´an et al.
Title Page
Abstract Introduction
Conclusions References
Tables Figures
◭ ◮
◭ ◮
Back Close
Full Screen / Esc
Printer-friendly Version Interactive Discussion
Discussion
P
a
per
|
Dis
cussion
P
a
per
|
Discussion
P
a
per
|
Discussio
n
P
a
per
|
density measurements, lathes perpendicular to the wood fibres were extracted from 804 cores and analysed following X-ray microdensitometric techniques developed by Polge (1965). The output is a density profile of points taken at 0.01 mm intervals in radial direction across each ring. The maximum density along this direction was esti-mated for each year.
5
2.1 Site chronologies
MXD chronologies for each of the 22 sites were constructed. Density series were pro-cessed according to standard dendrochronological techniques (Cook and Kairiukstis, 1990) and individual series were standardized to remove age-trends in the mean by fitting a stiff function which not only emphasizes inter-annual variations but also pre-10
serves multi-decadal scale variations in the final chronology (Cook et al., 1995). To assess the uncertainty caused by the application of different standardizations, the indi-vidual series underwent different standardization procedures with ARSTAN (Cook and Holmes, 1986). Two detrending techniques were used to remove age trends in the individual series: Regional Curve Standardization (Esper et al., 2003) and a 300-yr 15
cubic smoothing spline with a 50 % frequency-response cut-off. In addition to these two detrending techniques a power transformation (PT) for the stabilization of the vari-ance in the individual series was alternately conducted (Cook and Peters, 1997). Al-though raw MXD series are assumed to be homoscedastic, we preferred to adopt a conservative position because we do not know the nature of the 804 individual MXD 20
raw series for certain, and the existence of trends in the variance in the series can-not be surely rejected. Thus, a set of four different standardization procedures was applied: (1) Regional Curve standardization (Esper et al., 2003) (RCS) (2) Regional Curve standardization preceded by PT (RCSPT) (3) 300-yr cubic smoothing spline with a 50 % frequency-response cut-off(300 sp) and (4) 300-yr cubic smoothing spline 25
CPD
7, 3919–3957, 2011Cross-comparison at the Pyrenees
I. Dorado Li ˜n ´an et al.
Title Page
Abstract Introduction
Conclusions References
Tables Figures
◭ ◮
◭ ◮
Back Close
Full Screen / Esc
Printer-friendly Version Interactive Discussion
Discussion
P
a
per
|
Dis
cussion
P
a
per
|
Discussion
P
a
per
|
Discussio
n
P
a
per
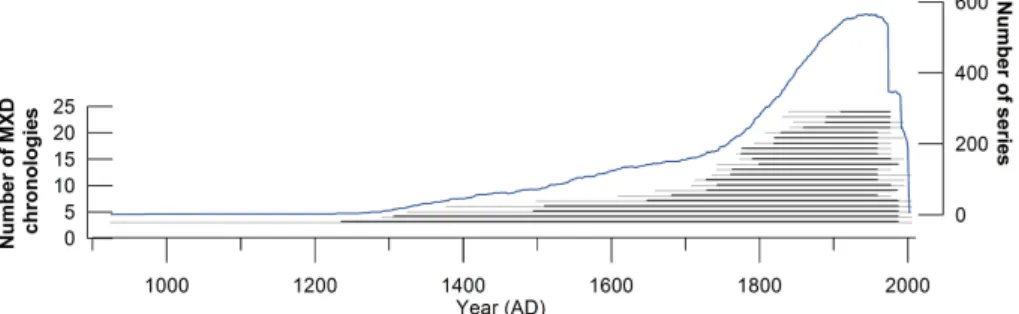
|
established by truncating the final chronologies when less than 5 contributing samples were available, leading to a maximum reliable time-span of 1260–2005 (Fig. 2).
2.2 Regional Pyrenees chronologies
The 804 individual tree rings MXD series corresponding to the 22 individual MXD site chronologies were standardized and aggregated into regional chronologies using 5
three different approaches: (1) computing a simple arithmetic average of the 22 indi-vidual MXD chronologies (RCS mean, RCSPT mean, 300 sp mean, 300 spPT mean) (2) computing a single chronology including all 804 individual series in one run (RCS chrono, RCSPT chrono, 300 sp chrono, 300 spPT chrono) and (3) conducting Principal Component Analyses, computed separately for each time segment with a 10
constant number of MXD chronologies to produce nested PCA regional chronologies (PCs RCS; PCs RCSPT; PCs 300 sp; PCs 300 spPT). In total, 12 regional chronolo-gies were developed for the Pyrenees region.
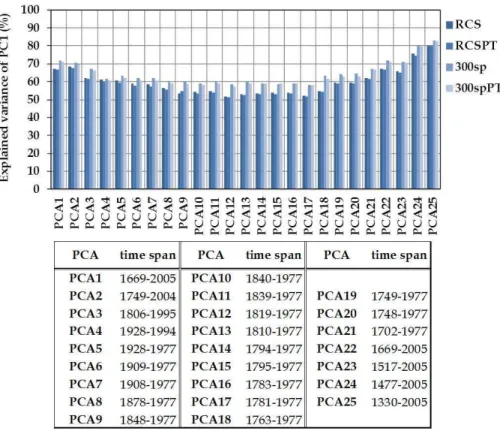
Due to the different time-span covered by the 22 chronologies (Fig. 2), a total number of 25 PCA were run for each of the four standardization methods (RCS, RCSPT, 300 sp 15
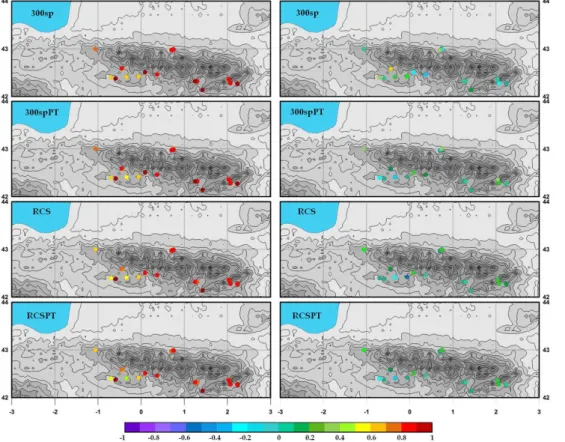
and 300 spPT) in order to obtain the corresponding scores of the principal components (PCs) in to the time segments. In addition, the spatial loadings, sometimes denoted as Empirical Orthogonal Functions (EOF’s) were also analyzed to assess the similarities and differences of their spatial patterns among the four standardization methods. For the EOF’s maps we use the loading corresponding to the PCA5 (time span 1928– 20
1977), which includes all 22 MXD chronologies.
Simple correlations were used to assess the climate information contained in the regional chronologies. In mountainous regions as the Pyrenees, temperature series have shown stronger inter-site relationships between distant sites than precipitation data, which display stronger variability at local spatial scales (Agusti-Panareda et al., 25
CPD
7, 3919–3957, 2011Cross-comparison at the Pyrenees
I. Dorado Li ˜n ´an et al.
Title Page
Abstract Introduction
Conclusions References
Tables Figures
◭ ◮
◭ ◮
Back Close
Full Screen / Esc
Printer-friendly Version Interactive Discussion
Discussion
P
a
per
|
Dis
cussion
P
a
per
|
Discussion
P
a
per
|
Discussio
n
P
a
per
|
data from six stations: Pamplona, San Sebasti ´an, Zaragoza, Barcelona, Burgos and Huesca (Brunet et al., 2007, 2010) was available as a representative homogenized and high-quality temperature record of the area for the last 100 yr. All regional chronologies, together with the leading principal component PC1 of the PCA, were correlated with instrumental regional temperature averages from Brunet et al. (2007, 2010) at monthly 5
and seasonal time scales. May-to-September mean temperature was identified as the most influencing season for tree growth.
2.3 Pyrenees reconstructions
Pyrenees regional reconstructions were carried out using both scaling and regression methods (Esper et al., 2005b) applied to the different regional chronologies developed. 10
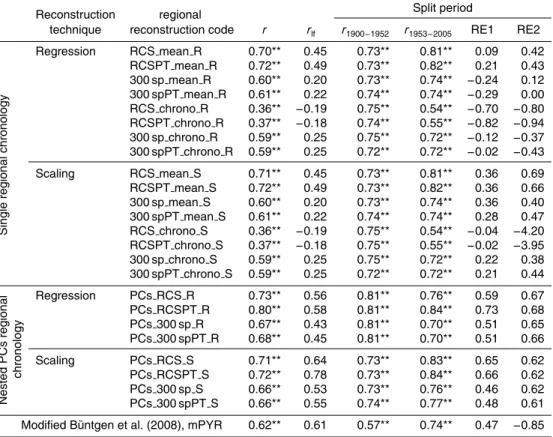
Thus, from the collection of 12 regional MXD chronologies built by means of the three different methodological approaches detailed above, 24 regional reconstructions were developed: 12 using scaling and 12 using regression techniques (Table 1). Calibra-tion/verification tests against the overlapping May-to-September regional instrumental temperature record were performed in split periods (Snee, 1977). The tree-ring model 15
was calibrated on the first half of the instrumental temperature record (1900–1952) and validated on the second half (1953–2005), and vice-versa. Quality control statis-tics such as the coefficient of determination (r2) Pearson’s correlation coefficient
be-tween observed and predicted values (robs-pred) and the Reduction of Error (RE; Cook et al., 1994) were calculated to test the validity of the reconstructions derived from both 20
methodologies. Reconstruction uncertainties related to the differences of the precursor chronologies and the calibration models used for reconstruction were assessed.
Additionally, the original chronology of B ¨untgen et al. (2008) (PYR), used to develop the regional maximum temperature reconstruction for the Pyrenees, was calibrated against May–September mean temperatures to build a reconstruction called “mPYR”, 25
CPD
7, 3919–3957, 2011Cross-comparison at the Pyrenees
I. Dorado Li ˜n ´an et al.
Title Page
Abstract Introduction
Conclusions References
Tables Figures
◭ ◮
◭ ◮
Back Close
Full Screen / Esc
Printer-friendly Version Interactive Discussion
Discussion
P
a
per
|
Dis
cussion
P
a
per
|
Discussion
P
a
per
|
Discussio
n
P
a
per
|
The resulting temperature reconstructions were compared with climate simulations performed with global and regional climate models spanning the last Millennium in the target region.
2.4 Model simulations
The global GCM simulations used here were produced with the ECHO-G (Legutke and 5
Voss, 1999) climate model, consisting of the the ECHAM4 atmospheric component and the HOPE-G ocean model. ECHAM4 is used with a T30 horizontal resolution
(ca. 3.75◦lat
×lon) and HOPE-G with a horizontal resolution of approx. 2.8◦lat×lon, with a finer resolution in the tropics increasing towards the Equator where it reaches a minimum meridional grid point separation of 0.5◦. The model is run using flux adjust-10
ments to avoid climate drift. This work makes use of two existing simulations with this model (Erik1 and Erik2) produced by driving the model with estimations of the evolution of some natural and anthropogenic forcings during the last millennium. The external forcings include estimations of changes in solar irradiance, the parameterized effect of stratospheric volcanic aerosols and concentrations of greenhouse gases (CO2, CH4 15
and N2O). Both simulations were produced starting from different initial conditions and driven by identical forcings from year 1000 AD onwards. For a description of the sim-ulations and the used external forcings as well as model details, the reader is referred to Zorita et al. (2005) and Gonz ´alez-Rouco et al. (2006, 2009).
The regional climate model simulations used herein were produced with a climate 20
version of the Fifth-generation Pennsylvania-State University-national Center for Atmo-spheric Research Mesoscale Model (Dudhia, 1993, Grell et al., 1994). The model domain is double nested with resolutions of 90 km and 30 km, respectively. The high resolution domain covers the area of the Iberian Peninsula. Two 1000 yr long simula-tions were run. Each simulation (Erik1-MM5 and Erik2-MM5) was produced by driving 25
CPD
7, 3919–3957, 2011Cross-comparison at the Pyrenees
I. Dorado Li ˜n ´an et al.
Title Page
Abstract Introduction
Conclusions References
Tables Figures
◭ ◮
◭ ◮
Back Close
Full Screen / Esc
Printer-friendly Version Interactive Discussion
Discussion
P
a
per
|
Dis
cussion
P
a
per
|
Discussion
P
a
per
|
Discussio
n
P
a
per
|
for the model, simulation experiments and the physics configuration are also provided in G ´omez-Navarro et al. (2011a, b).
3 Results
3.1 Regional Pyrenees MXD chronologies and climate signal
The PCA performed on the set of MXD chronologies to be used in developing re-5
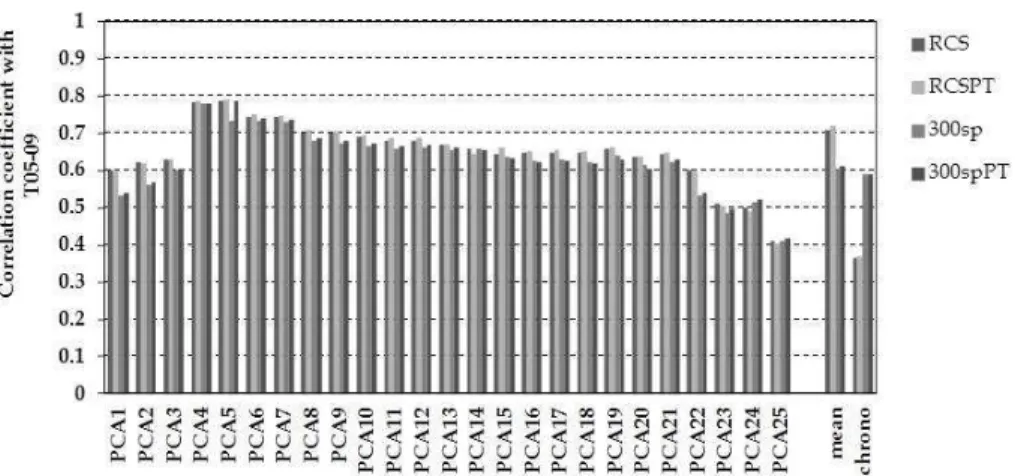
gional reconstructions based on nested PCs, reveals that the first principal component (PC1) is dominant and captures on average 60 % of the variance (Fig. 3). The high percentage of explained variance by PC1 shows slight variations across the different PCA runs, displaying higher percentages of explained variance for PCA containing a smaller number of MXD chronologies (PCA1, PCA2, and from PCA20 to PCA24). The 10
leading PC derived from chronologies standardized with 300 sp and 300 spPT, rather than with RCS or RCSPT, also explains slightly more common variance, although the difference is very small. The first Empirical Orthogonal Function (EOF) describes a coherent spatial pattern of the signal regardless of the standardization method used (Fig. 4). The individual points (MXD chronologies) present the same sign and similar 15
magnitude in the maps of the first EOF for each of the four standardization methods. This suggests that spatially coherent modes of tree-ring variation exist, which may re-flect regional-scale modes of climate parameters driving tree growth. The second and subsequent PCA modes, which are similar regardless of the standardization method used, become less coherent spatially and seasonally, with sign and magnitude of the 20
relationship, occasionally differing between individual points likely in response to local or site influences.
The leading mode (PC1) shows high correlations with the seasonal May-to-September temperature and has positive loadings across all the Pyrenees sites. The highest correlations with climate are for the PCA that includes the highest number of 25
CPD
7, 3919–3957, 2011Cross-comparison at the Pyrenees
I. Dorado Li ˜n ´an et al.
Title Page
Abstract Introduction
Conclusions References
Tables Figures
◭ ◮
◭ ◮
Back Close
Full Screen / Esc
Printer-friendly Version Interactive Discussion
Discussion
P
a
per
|
Dis
cussion
P
a
per
|
Discussion
P
a
per
|
Discussio
n
P
a
per
|
series. The small differences observed in the variance captured by PC1 among the dif-ferent standardization methods have not a significant effect on the correlation between PC1 with May-to September-temperature (T05–09) (Fig. 5). The coefficients among
the different standardization methods are almost identical. In summary, the mean cor-relation of PC1 withT05–09 is 0.64, being slightly higher for the standardization method
5
RCS and RCSPT (r=0.65) than for 300 sp and 300 spPT (r=0.63).
The regional chronologies computed as arithmetic means of the 22 MXD site chronologies (mean) display generally higher correlations withT05–09 when the
stan-dardization methods RCS and RCSPT (RCS mean and RCSPT mean respectively) were used rather than 300 sp and 300 spPT (300 sp mean and 300 sp mean respec-10
tively) (Fig. 5). In comparison to the dominant mode of PCA, only the PC1 of PCA4 and PCA5 display larger correlation coefficients than the RCS mean and RC-SPT mean. In contrast, among regional series computed as single chrononologies
(chrono), RCS chrono and RCSPT chrono overall display the lowest correlations with
T05–09 (below 0.4), while 300 sp chrono and 300 spPT chrono show coefficients of a
15
similar order of magnitude as those displayed by the PCs.
3.2 May-to-September regional reconstruction: scaling and regression
A total of 24 regional reconstructions for the Pyrenees were developed using both scaling and regression techniques applied to each of the 12 regional chronologies de-veloped. The correlations between the reconstructions based on nested PCs and the 20
instrumental T05–09 record are high for both high and low-frequency variations (Ta-ble 1). In contrast, correlations for reconstructions from the group chrono are low and they reveal diverging low-frequency information when using RCS and RCSPT as standardization methods (RCS chrono R, RCSPT chrono R, RCS chrono S, RC-SPT chrono S). Reconstructions based on mean regional chronologies display high 25
correlations with the instrumentalT05–09, however, slightly lower in the low frequency
CPD
7, 3919–3957, 2011Cross-comparison at the Pyrenees
I. Dorado Li ˜n ´an et al.
Title Page
Abstract Introduction
Conclusions References
Tables Figures
◭ ◮
◭ ◮
Back Close
Full Screen / Esc
Printer-friendly Version Interactive Discussion
Discussion
P
a
per
|
Dis
cussion
P
a
per
|
Discussion
P
a
per
|
Discussio
n
P
a
per
|
The calibration-verification test conducted against the targetT05–09 in two periods
(1900–1953; 1953–2005) generally shows a coherent relationship between observed and predicted values for the 24 regional reconstructions; however, large differences in the reduction of error statistic (RE) appear (Table 1). Regional chronologies based on nested PCs display high correlation coefficients in the two calibration periods, both 5
regression-calibrated (r1900
−1952=0.81 andr1953−2005=0.75 on average) and scaling-calibrated (r1900
−1952=0.73 andr1953−2005=0.80 on average). Similarly, REs are also high for the two verifications. On the contrary, even though correlation values are fairly high for the two periods, RE values decline to large negative values when the recon-structed values are obtained by linear regression of single regional chronologies, espe-10
cially reconstructions from the groupchrono. Single regional chronologies computed as means display higher RE values when the reconstruction is performed using scaling than regression (RCS mean S, RCSPT mean S, 300 sp mean S, 300 spPT mean S), The set of reconstructions based on RCS chrono and RCSPT chrono displays RE val-ues of below 0 regardless of the technique used for reconstructing.
15
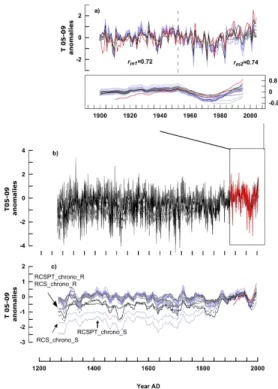
The temperature reconstructions for the months May to September (T05–09) span
the period from 1265 AD to 2005 AD. From the entire time span, the below-average es-timation of the mean May-to-September temperatures by some of the regional recon-structions (RCSPT chrono S, RCS chrono S, RCSPT chrono R and RCS chrono R) starts at the beginning of the reconstruction in 1265 and lasts until around 1850 (Fig. 6). 20
mPYR also displays a similar trend but less pronounced than for RCS chrono S and RCSPT chrono S. Despite this difference regarding the trends, all reconstructions dis-play similar intermediate to low frequency variations, which are, however, less visible in the case of RCSPT chrono R and RCS chrono R due to their reduced variations amplitude. Periods with persistent climate anomalies such as the Medieval Climate 25
CPD
7, 3919–3957, 2011Cross-comparison at the Pyrenees
I. Dorado Li ˜n ´an et al.
Title Page
Abstract Introduction
Conclusions References
Tables Figures
◭ ◮
◭ ◮
Back Close
Full Screen / Esc
Printer-friendly Version Interactive Discussion
Discussion
P
a
per
|
Dis
cussion
P
a
per
|
Discussion
P
a
per
|
Discussio
n
P
a
per
|
between 1950 AD and 1980 AD is shown by all 25 reconstructions including the mPYR. On the other hand, conspicuous maxima also appear during 1300–1330, 1360–1460 and 1710–1740.
3.3 Cross-comparison of model simulation and proxy based climate reconstructions
5
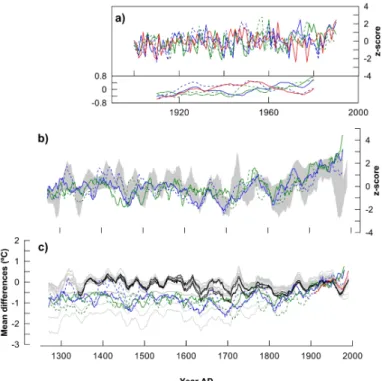
Simulated May-to-September temperatures show a good agreement with the instru-mental record for the first part of the 20th century (Fig. 7a) However, from 1940 on-wards the discrepancies arise at the inter-annual time scale, that is, the simulations display peak temperatures which are in contrast to the instrumental record (e.g. be-tween 70 s and 80 s). On the inter-decadal scale, the two global (Erik1 and Erik2) 10
and the regional MM5-Erik2 simulations display a marked positive trend for the entire calibration period in disagreement with the instrumental series. Indeed, the observed instrumental temperatures display a positive trend until 1960 and then a minimum until 1990. This negative temperature trend in the latest part of the 20th century is only reproduced by the regional simulation MM5-Erik1.
15
Global and regional simulations indicate large inter-decadal changes that are in agreement with those displayed by the collection of May-to-September temperature reconstructions based on MXD from the Pyrenees (Fig. 7b). A high synchrony is found among the simulations and the tree-ring based reconstructions in periods with large negative temperature anomalies observed at the end of the 18th century, during the 20
Dalton and Sp ¨orer solar minima, and during periods of positive anomalies as well, e.g. during the middle of the 15th century, middle to end of the 16th century and during the middle of the 18th century. Some simulations lack pronounced negative periods such as the Late Maunder solar minimum which are present in the recon-structions. The simulations Erik1 and MM5-Erik1 display identical periods of negative 25
CPD
7, 3919–3957, 2011Cross-comparison at the Pyrenees
I. Dorado Li ˜n ´an et al.
Title Page
Abstract Introduction
Conclusions References
Tables Figures
◭ ◮
◭ ◮
Back Close
Full Screen / Esc
Printer-friendly Version Interactive Discussion
Discussion
P
a
per
|
Dis
cussion
P
a
per
|
Discussion
P
a
per
|
Discussio
n
P
a
per
|
MM5-Erik2 this negative period is delayed. Overall, Erik1 and MM5-Erik1, in relation to the reconstructions, seems to simulate better the negative anomalies.
Model simulations and proxy reconstructions disagree to some extent on the magnitude of the warming trend over the 20th century (1900–1990). Global sim-ulations display on average an increase of about 1◦C in this period, while for 5
the regional models this increase is less pronounced, i.e. +0.4◦C for MM5-Erik1 and +0.7◦C for MM5-Erik2. The reconstructions, including mPYR, mostly dis-play negative trends for the same period, ranging from −1◦C (RCS chrono S) to −0.1◦C (PCs RCS S; PCs RCSPT S). Some reconstruction show trends close to zero (PCs RCS R; PCs 300 sp R; PCs 300 sp R) and PCs RCSPT R is the only one show-10
ing a very slight increase (+0.05◦C). The instrumental record displays a decrease of about−0.45◦C for the same period.
The total amplitude of the temperature variations at annual timescales (respect to the 1900–1990 mean) for the period 1265–1990 is similar for the two global simulations (from−2.69 to 2.93◦C for Erik1 and from−2.73 to 2.95◦C for Erik2) while the regional
15
amplitude of MM5-Erik1 is slightly lower (from−2.29 to 2.83◦C) and the larger for MM5-Erik2 (from−2.58 to 3.33◦C). If the increase in temperatures along the 20th century is not considered, MM5-Erik1 is the simulation with larger temperature amplitude over the period 1265–1900 (from 2.29 to 2.83◦C), while the other regional simulation displays the smallest (MM5-Erik2, from−2.58 to 2.37◦C). At inter-decadal time scales (Fig. 7c),
20
the picture does not change and the amplitude of the variations is the highest for MM5-Erik2 (from−1.8 to 0.5◦C) when considering the whole period, and for MM5-Erik1 (from −1.7 to 0.2◦C) when excluding the 20th century.
At annual timescales, the amplitudes of 24 reconstructions and the mPYR varies within ranges quantitatively larger than those displayed by the simulations (RC-25
CPD
7, 3919–3957, 2011Cross-comparison at the Pyrenees
I. Dorado Li ˜n ´an et al.
Title Page
Abstract Introduction
Conclusions References
Tables Figures
◭ ◮
◭ ◮
Back Close
Full Screen / Esc
Printer-friendly Version Interactive Discussion
Discussion
P
a
per
|
Dis
cussion
P
a
per
|
Discussion
P
a
per
|
Discussio
n
P
a
per
|
the pre-industrial period or including the 20th century. Only the reconstructions RC-SPT chrono R, RCS chrono R, RCRC-SPT chrono S and RCS chrono S (Fig. 7c) show increased amplitudes when considering the 20th century. Similarly, at inter-decadal timescales, the reconstructions range from the largest amplitude of RCSPT mean S (from−2.49 to 0.59◦C) to the tiniest of PCs 300 sp R (from −0.32 to 0.39◦C). When
5
considering only the pre-industrial period, changes on the amplitude of variations at inter-decadal scales in the reconstructions do not differ much from the amplitudes con-sidering the whole period.
Generally, the maximum values displayed by the reconstructions are below those showed by the model simulations, regardless of the consideration of the 20th for 10
the calculation. If only considering pre-industrial annual temperature variations (1265–1900) to define the amplitude, the reconstructions based on nested PCs and scaled (PCs RCS S; PCs RCSPT S; PCs 300 spPT S; PCs 300 spPT S) are the ones displaying amplitudes similar to those exhibited by the simulations. However, at inter-decadal timescales, the amplitudes showed by PCs RCS S, PCs RCSPT S, 15
PCs 300 spPT S and PCs 300 spPT S (from−0.97 to 0.28◦C; from−1 to 0.37◦C; from −0.66 to 0.38◦C and from−0.81 to 0.4◦C, respectively) are smaller than those exhib-ited by the model simulations, especially MM5-Erik1.
4 Discussion
How the individual chronologies should be standardized to remove local influences 20
preserving at the same time as much climate information as possible, is a key chal-lenge in dendroclimatology. Increased efficiency in preserving low-frequency climate information in tree-ring records will improve the usage of such proxy data for climate reconstructions and model validation. The regional chronology standardization (RCS; Esper et al., 2003) does not preserve decadal or annual frequencies with better ef-25
CPD
7, 3919–3957, 2011Cross-comparison at the Pyrenees
I. Dorado Li ˜n ´an et al.
Title Page
Abstract Introduction
Conclusions References
Tables Figures
◭ ◮
◭ ◮
Back Close
Full Screen / Esc
Printer-friendly Version Interactive Discussion
Discussion
P
a
per
|
Dis
cussion
P
a
per
|
Discussion
P
a
per
|
Discussio
n
P
a
per
|
On the other hand, the proxy-based climate reconstructions need to encode a climate signal which is not locally confined to be suitable for comparison with model outputs, since simulations can only capture main climate features with a spatial scale compara-ble at least to the spatial resolution of the models. Thus, individual or site chronologies should ideally be aggregated into one regional chronology to capture a regional rather 5
than a local climate signal. So far, the construction of regional reconstructions from a set of several individual chronologies (from the same and/or different variables) have been achieved by PCA (Peters et al., 1981; Enright et al., 1984; D’Arrigo et al., 1999) arithmetic means (Briffa et al., 2004; Tang et al., 2009) or regional chronologies com-piled into a single file including all the individual measurements (Esper et al., 2007; 10
B ¨untgen et al., 2008).
The standardization technique used have contributed to visible differences among various reconstructions as reported by other authors (Esper et al., 2002, Helama et al., 2004) and our results suggest that these differences may be enhanced when deriving a regional chronology from the individual chronologies. We could not find 15
large differences among regional reconstructions when they were calculated as an average of the 22 MXD site chronologies (mean) or when using nested PCs (PCs), regardless of the standardization method applied to the individual chronologies. In this case, the four standardization procedures yielded similar results. The similarity between mean and nested PCs regional chronologies comes as no surprise, since, 20
the PCA approach to define a regional chronology is known to produce similar re-sults to those obtained using the arithmetic mean (Peters et al., 1981). Differences due to the standardization arose in the regional reconstructions which were derived from regional chronologies computed as a single chronology including all 804 indi-vidual series in one run (the group named chrono). Regional chronologies from the 25
CPD
7, 3919–3957, 2011Cross-comparison at the Pyrenees
I. Dorado Li ˜n ´an et al.
Title Page
Abstract Introduction
Conclusions References
Tables Figures
◭ ◮
◭ ◮
Back Close
Full Screen / Esc
Printer-friendly Version Interactive Discussion
Discussion
P
a
per
|
Dis
cussion
P
a
per
|
Discussion
P
a
per
|
Discussio
n
P
a
per
|
and RCS chrono, respectively). Correlations betweenT05–09 and RCS chrono and RCSPT chrono are consistently lower compared to the correlations displayed by other regional chronologies, pointing to a less preserved climate signal in RCS chrono and RCSPT chrono. Furthermore, the resulting reconstructions disagree in some aspects with any other newly developed reconstruction, e.g. concerning a pronounced posi-5
tive trend spanning the entire series lengths (RCSPT chrono S and RCS chrono S), and the extremely reduced amplitude of past climate variations (RCSPT chrono R and RCS chrono R). In contrast, the two regional chronologies derived of a similar pro-cedure but different standardization (300 sp chrono and 300 spPT chrono) display high correlations with temperature and the reconstructions based on these two chronologies 10
are similar to the ones derived from the regional chronologiesmeanand PCs. There-fore, it becomes obvious that the differences stem from the computation of the regional chronology, not only by using a single file containing all the individual measurements but also from the application of the RCS as the standardization method.
RCS requires sampling loads structured in age classes with similar replication (Es-15
per et al., 2002), which limits its application in practice. Although it has been found that RCS does not seem to be so sensitive to some of these requirements as initially thought (i.e. pith off-set; Esper et al., 2003, 2009), it seems that sample depth and age structure have strong effects on the resulting chronology (Esper et al., 2003; Bunn et al., 2004; Briffa and Melvin, 2008). The set of samples from the Pyrenees does 20
not fulfil the RCS requirements: the sample depth diagram shows an extremely high number of samples concentrated in the most recent period (from 1800 to 2005 AD, ap-proximately), whereas the replication in the rest of the period (from 1265 to 1800 AD) is much lower. Such anomalously high and low replications can introduce a bias into the final chronology (Cook and Peters, 1997; Esper et al., 2003; Helama et al., 2004) 25
CPD
7, 3919–3957, 2011Cross-comparison at the Pyrenees
I. Dorado Li ˜n ´an et al.
Title Page
Abstract Introduction
Conclusions References
Tables Figures
◭ ◮
◭ ◮
Back Close
Full Screen / Esc
Printer-friendly Version Interactive Discussion
Discussion
P
a
per
|
Dis
cussion
P
a
per
|
Discussion
P
a
per
|
Discussio
n
P
a
per
|
RCSPT chrono R and RCS chrono R due to their poor calibration. This leads to a sub-sequent underestimation of the variability imparted by the regression technique, and to reconstructions with reduced amplitude (Cook et al., 1994).
In the context of reconstruction techniques, scaling is known to preserve more vari-ance than regression. Indeed, the amplitude of our reconstructions is larger when 5
performed with scaling than with regression. However, RE values may become low or negative (Esper et al., 2005b; McCarrol et al., 2011). In our case, the magnitude of negative RE obtained was slightly higher for scaling and mostly for reconstructions based on single regional chronologies. For series with generally good calibrations, RE values were similar for reconstructions based on scaling and regression. In any case, 10
it has to be borne in mind that RE is an extremely rigorous statistics with no lower boundary and no test for its statistical significance exists (Cook et al., 1994). Thus, RE values should be interpreted carefully.
Similarly, the actual (PYR) and the modified reconstructions of B ¨untgen et al. (2008) (mPYR), which are also based on a regional chronology computed using RCS, display 15
similar but less pronounced positive trends. The calibration statistics show a some-what unstable relationship between the regional chronology and the target T05–09, not shown by other reconstructions. Taking into consideration that the sample replica-tion was also suboptimal for the applicareplica-tion of RCS in this case, the possibility that the trend displayed by the reconstruction may be an artefact should not be neglected. 20
Based on the calibration-verification tests, regional reconstructions derived from nested PCs performed better than others regardless of the standardization procedure applied to the individual chronologies, or irrespective of the reconstruction technique used, which indicates that this approach emphasizes the leading mode of co-variation between the tree-ring series (Peters et al., 1981). This results in a better correlation of 25
CPD
7, 3919–3957, 2011Cross-comparison at the Pyrenees
I. Dorado Li ˜n ´an et al.
Title Page
Abstract Introduction
Conclusions References
Tables Figures
◭ ◮
◭ ◮
Back Close
Full Screen / Esc
Printer-friendly Version Interactive Discussion
Discussion
P
a
per
|
Dis
cussion
P
a
per
|
Discussion
P
a
per
|
Discussio
n
P
a
per
|
instrumental measurements and proxy estimates has been previously described and the possible causes discussed (Frank et al., 2007). The tree-ring data from the Pyre-nees display a strong and stable relationship with the climate variable and, therefore, a loss of tree sensitivity to climate seems unlikely (“divergence problem”; Briffa et al., 1998, D’Arrigo et al., 2008). Thus, this mismatch may be due to the effect of the stan-5
dardization methods on the low-frequency climate information encoded in tree-ring se-ries (Cook et al., 1995; Esper et al., 2002) or alternatively related to the instrumental data used for calibration (Frank et al., 2007; Esper et al., 2005b, 2010). The selected instrumental data for the Pyrenees and the homogenization and adjustments applied to these data also have a determinant effect on the resulting proxy-based reconstruc-10
tions (Frank et al., 2007). In our case, no clear conclusion can be drawn without further specific work directed to answer this particular question.
The comparison between the output of the model simulations and the range es-tablished by the different reconstructions shows that the agreement between recon-structed and simulated May-to-September temperatures at the Pyrenees is good, es-15
pecially at intermediate to low frequencies. At multi-decadal timescales, the different series exhibit synchronized variability with a similar behaviour, e.g. a warmer century from 1300 AD to 1400 AD, a colder period between 1600–1800 AD (little ice age, LIA), the solar minima and the modern warming. Thus, the external forcings applied to the model matches the timing of the main past periods of anomalous temperatures in 20
the Pyrenees region. Actually, the spread among the four simulated temperatures is mostly within the range estimated from the different standardization and reconstruction methods applied over the last 750 yr. Similar results comparing simulations and proxy based temperature reconstructions have been described by D’Arrigo et al. (1999) for the Northern Hemisphere and by Tan et al. (2009) for China.
25
CPD
7, 3919–3957, 2011Cross-comparison at the Pyrenees
I. Dorado Li ˜n ´an et al.
Title Page
Abstract Introduction
Conclusions References
Tables Figures
◭ ◮
◭ ◮
Back Close
Full Screen / Esc
Printer-friendly Version Interactive Discussion
Discussion
P
a
per
|
Dis
cussion
P
a
per
|
Discussion
P
a
per
|
Discussio
n
P
a
per
|
and minima reproduced by all four simulations, Erik1 and MM5-Erik1 also match in the warm and cold periods which occurred in the 15th to 16th century (including the Maunder solar minimum). However, those episodes were not captured by Erik2.
Model simulations also show some clear discrepancies in comparison to the tree-ring based reconstructions. The most relevant is the positive trend from 1850 to present dis-5
played by the simulations but not reproduced by the reconstructions. We already know that reconstructions may underestimate the climate variations but since the model runs incorporate both natural and anthropogenic forcings, it is difficult to distinguish the ef-fect of the individual forcings in the resulting simulation and especially in the resulting trend. Thus, it is difficult to know whether the observed difference between simulations 10
and reconstructions is due to an underestimation of the proxy-based reconstructions or by an overestimation of the models.
At higher frequencies, i.e. decadal time scales, the agreement between model sim-ulations and reconstructions is lower because the climate variability at this time scales is mostly internal and not driven by the external forcing (Zorita et al., 2007; G ´omez-15
Navarro et al., 2011b). For instance, a warm episode with the maximum around AD 1730 displayed by the Pyrenees reconstructions is not reproduced by any of the four simulations and does not match any maximum of the external forcing. This maximum in temperature has been described for other European temperature recon-struction (Leijonhufvud et al., 2010; Zorita et al., 2010), which points to a regional to 20
hemispheric-scale maximum generated by internal climate dynamics. Therefore, this particular warm episode may not necessarily appear in the simulations due to the pos-sible shortcomings of models in regard to model internal climate dynamics.
The 20th century is highlighted as an interesting period for evaluating the skill of both proxy based reconstructions and model simulations to replicate climate variations. The 25
CPD
7, 3919–3957, 2011Cross-comparison at the Pyrenees
I. Dorado Li ˜n ´an et al.
Title Page
Abstract Introduction
Conclusions References
Tables Figures
◭ ◮
◭ ◮
Back Close
Full Screen / Esc
Printer-friendly Version Interactive Discussion
Discussion
P
a
per
|
Dis
cussion
P
a
per
|
Discussion
P
a
per
|
Discussio
n
P
a
per
|
both instrumental and reconstructed temperatures display and negative trend along 1900–1990 while model simulations display a positive trend. It needs to be consid-ered that model simulations do not include tropospheric aerosol forcing and vegetation changes which may have a cooling effect on the regional climate (Hansen et al., 2002). In contrast, the increasing trends in regional and global temperatures described by 5
the simulations may be ascribed to the increase in solar irradiance and greenhouse gases forcing (Gonz ´alez-Rouco et al., 2010). The Pyrenees range, however, has been experiencing an increase in the vegetation cover and active vegetation successions processes since the 1950s due to the abandonment of agricultural and stock-breeding activities (Garcia-Ruiz and Lasanta, 1990) and because of reforestation politics initi-10
ated in the 1940s and intensified later (Ortigosa et al., 1990). Since then, the forest coverage has increased by approximately 15 % (considering close forest, open forest and repopulations) in some areas (Lasanta and Vicente-Serrano, 2007). Whether this increase in vegetation coverage can produce negative temperature trends is open to discussion. It is likely that some cooling may evolve from this influencing the tempera-15
ture variation at the Pyrenees on the second half of the 20th century which seems to be missing in the external forcing of model simulations. However, since one of the sim-ulations (MM5-Erik1) displays a minimum in the 20th century, the described regional cooling could also be due to other factors altering the internal variability without the need to involve vegetation changes or aerosol forcing.
20
The absolute amplitude of temperature variations is still poorly understood and a clarification of the discrepancies regarding the estimated variability is crucial for mod-elling future temperature trends. It is worth mentioning that among the model simula-tions the finer resolution of regional models enhances the amplitude of the temperature variations. MM5-Erik2 displays larger amplitudes when considering the whole period 25
CPD
7, 3919–3957, 2011Cross-comparison at the Pyrenees
I. Dorado Li ˜n ´an et al.
Title Page
Abstract Introduction
Conclusions References
Tables Figures
◭ ◮
◭ ◮
Back Close
Full Screen / Esc
Printer-friendly Version Interactive Discussion
Discussion
P
a
per
|
Dis
cussion
P
a
per
|
Discussion
P
a
per
|
Discussio
n
P
a
per
|
than in reconstructions if we consider the whole common period (1265–1990). How-ever, if the 20th century is not considered, the amplitude of the annual temperature variations are usually wider in the tree-ring based reconstructions performed with scal-ing than in model simulations. Furthermore, reconstructions performscal-ing better cali-brations with the instrumental record (PCs RCS S; PCs RCSPT S; PCs 300 spPT S; 5
PCs 300 spPT S) are also displaying annual amplitudes closer to those of the model outputs.
5 Conclusions
Similarities between the inter-decadal temperature variations obtained with all stan-dardization methods indicate the good performance of all stanstan-dardization procedures 10
for retaining inter-annual to inter-decadal climate information. However, when the re-gionally representative tree-ring series are built as a single chronology (concentrating all single measurements into one file) and standardized with the RCS method, odd results may be obtained if the requirements of sample replication and age categoriza-tion are not fulfilled for the RCS method. Overall, nested PCs have demonstrated to 15
be the most appropriate approach to build a regional chronology based on a set of local chronologies, regardless of the standardization procedure used for the individual site chronologies. Additionally, no large differences were found between reconstruction techniques (scaling and regression) when using chronologies based on nested PCs. Thus, the quality of the final reconstruction seems to depend more on the standard-20
ization performed and the method applied to construct the regional chronology, rather than on the reconstruction method employed.
We provide a set of newly developed May-to-September mean temperature recon-structions for the Pyrenees which represent an improvement in comparison to the re-construction by B ¨untgen et al. (2008), although our rere-constructions still do not perfectly 25
CPD
7, 3919–3957, 2011Cross-comparison at the Pyrenees
I. Dorado Li ˜n ´an et al.
Title Page
Abstract Introduction
Conclusions References
Tables Figures
◭ ◮
◭ ◮
Back Close
Full Screen / Esc
Printer-friendly Version Interactive Discussion
Discussion
P
a
per
|
Dis
cussion
P
a
per
|
Discussion
P
a
per
|
Discussio
n
P
a
per
|
Nevertheless, the good agreements on inter-decadal scales between tree-ring based reconstructions and global and regional model simulations points to solar variability combined with volcanic activity as the main factors driving summer temperature vari-ations over the last millennium at the Pyrenees. Since we have developed regional reconstructions, it is difficult to conclude whether the more realistic topography and 5
land use categories of the regional model would yield a more accurate replication of temperature variations at local scales, but it does seem to yield larger amplitude of temperature variations compared to the global models.
An important point is that the instrumental and reconstructed temperature series do not agree with the increasing trend displayed by the simulations for the 20th century. 10
This trend is most probably due to the greenhouse gas forcing over the more recent period but since the model runs incorporate both natural and anthropogenic forcing, it is difficult to distinguish the effect of the individual forcings in the resulting simulation and especially in the resulting trend. In addition, cooling factors such as aerosols and vegetation changes are not included as external forcings in the simulations and their 15
contributions to the changes in the surface temperatures are still unclear.
Acknowledgements. We thank Bj ¨orn G ¨unther and Daniel Nievergelt for performing the den-sity measurements and Pedro ´Angel Jim ´enez Mu ˜noz for providing the data for the map. This research was funded by MILLENNIUM (017008-2).
References
20
Agust´ı-Panareda, A., Thompson, R., and Livingstone, D. M.: Reconstructing temperature vari-ations at high elevation lake sites in Europe during the instrumental period, Verh. Int. Ver. Limn., 27, 479–483, 2000.
Briffa K. R. and Melvin, T. M.: A closer look at Regional Curve Standardisation of tree-ring records: justification of the need, a warning of some pitfalls, and suggested improvements
25
CPD
7, 3919–3957, 2011Cross-comparison at the Pyrenees
I. Dorado Li ˜n ´an et al.
Title Page
Abstract Introduction
Conclusions References
Tables Figures
◭ ◮
◭ ◮
Back Close
Full Screen / Esc
Printer-friendly Version Interactive Discussion
Discussion
P
a
per
|
Dis
cussion
P
a
per
|
Discussion
P
a
per
|
Discussio
n
P
a
per
|
Briffa, K. R., Schweingruber, F., Jones, P., and Osborn, T.: Reduced sensitivity of recent tree growth to temperature at high northern latitudes, Nature, 391, 678–682, 1998.
Briffa, K. R., Osborn, T. J., Schweingruber, F. H., Jones, P. D., Shiyatov, S. G., and Vaganov, E. A.:Tree-ring width and density data around the Northern Hemisphere: part 1, local and regional climate signals, Holocene, 12, 737–757, 2002.
5
Briffa, K. R., Osborn, T. J., and Schweingruber, F. H.:Large-scale temperature inferences from tree rings: a review, Global Planet. Change, 40, 11–26, 2004.
Brunet, M., Jones, P. D., Sigro, J., Saladie, O., Aguilar, E., Moberg, A., Della-Marta, P. M., Lister, D., Walther, A., and Lopez, D.: Temporal and spatial temperature variabil-ity and change over Spain during 1850–2005, J. Geophys. Res.-Atmos., 112, D12117,
10
doi:10.1029/2006JD008249, 2007.
Brunet, M., Asin, J., Sigr ´o, J., Ba ˜n ´on, M., Garc´ıa, F., Aguilar, E., Palenzuela, J. E., Pe-terson, T. C., and Jones, P.: The minimization of the screen bias from ancient Western Mediterranean air temperature records: an exploratory statistical analysis, Int. J. Climatol, doi:10.1002/joc.2192, 2010.
15
B ¨untgen, U., Frank, D. C., Nievergelt, D., and Esper, J.: Summer temperature variations in the European Alps, AD 755–2004, J. Climate, 19, 5606–5623, 2006.
B ¨untgen, U., Frank, D. C., Kaczka, R. J., Verstege, A., Zwijacz-Kozica, T., and Esper, J.: Growth/climate response of a multi-species tree-ring network in the Western Carpathian Tatra Mountains, Poland and Slovakia, Tree Physiol, 27, 689–702, 2007.
20
B ¨untgen, U., Frank, D. C., Grudd, H., and Esper, J.: Long-term summer temperature variations in the Pyrenees, Clim. Dynam., 31, 615–631, 2008.
B ¨untgen, U., Frank, D. C., Trouet, V., and Esper, J.: Diverse climate sensitivity of Mediterranean tree-ring width and density, Trees-Struct. Funct., 24, 261–273, 2010.
Bunn, A. G., Sharac, T. J., and Graumlich, L. J.: Using a simulation model to compare methods
25
of tree-ring detrending and to investigate the detectability of low-frequency signals, Tree-Ring Res., 60, 77–90, 2004.
Collins, W. D., Rasch, P. J., Eaton, B., Fillmore, D. W., Kiehl, J., Beck, T. C., and Zender, C.: Simulation of Aerosol Distributions and Radiative Forcing for INDOEX: Regional Climate Impacts, J. Geophys. Res., 107, 8028, 2002.
30
Cook, E. R. and Holmes, R. L.: Program ARSTAN, Version 1, 72 pp., 1986.
CPD
7, 3919–3957, 2011Cross-comparison at the Pyrenees
I. Dorado Li ˜n ´an et al.
Title Page
Abstract Introduction
Conclusions References
Tables Figures
◭ ◮
◭ ◮
Back Close
Full Screen / Esc
Printer-friendly Version Interactive Discussion
Discussion
P
a
per
|
Dis
cussion
P
a
per
|
Discussion
P
a
per
|
Discussio
n
P
a
per
|
Kluwer Academic Publishers, 1990.
Cook, E. R. and Peters, K.: Calculating unbiased tree-ring indices for the study of climatic and environmental change, Holocene, 7, 361–370, 1997.
Cook, E. R., Briffa, K. R., and Jones, P. D.: Spatial regression methods in dendroclimatology: A review and comparison of two techniques, Int. J. Climatol., 14, 379–402, 1994.
5
Cook, E. R., Briffa, K. R., Meko, D. M., Graybill, D. A., and Funkhouser, G.:The segment length curse in long tree-ring chronology development for paleoclimatic studies, Holocene, 5, 229– 37, 1995.
D’Arrigo, R. D., Gordon, C. J., Free, M., and Robock, A.: Northern Hemisphere annual to decadal temperature variability for the past three centuries: Tree-ring and model estimates,
10
Climatic Change, 42, 663–675, 1999.
D’Arrigo, R., Wilson, R., Liepert, B., and Cherubini, P.: On the ’Divergence Problem’ in Northern Forests: A Review of the Tree-Ring Evidence and Possible Causes, Global Planet. Change, 60, 289–305, 2008.
Dudhia, J.: A nonhydrostatic version of the Penn StateNCAR mesoscale model: Validation tests
15
and simulation of an Atlantic cyclone and cold front, Mon. Weather Rev., 121, 1493–1513, 1993.
Enright, N. J.: Principal components analysis of tree-ring/climate relationships in white spruce (Picea glauca) from Schefferville, Canada, J. Biogeogr., 11, 353–361, 1984.
Esper, J., Cook, E. R., and Schweingruber, F. H.: Low-frequency signals in long tree-ring
20
chronologies and the reconstruction of past temperature variability, Science, 295, 2250– 2253, 2002.
Esper, J., Cook, E. R., Krusic, P. J., Peters, K., and Schweingruber, F. H.: Tests of the RCS method for preserving low-frequency variability in long tree-ring chronologies, Tree-Ring Res., 59, 81–98, 2003.
25
Esper, J., Frank, D. C., and Wilson, R. J. S.: Climate reconstructions: low frequency ambition and high frequency ratification, EOS, 85, 113–130, 2004.
Esper, J., Wilson, R. J. S., Frank, D. C., Moberg, A., Wanner, H., and Luterbacher, J.: Climate: past ranges and future changes, Quaternary Sci. Rev., 24, 2164–2166, 2005a.
Esper, J., Frank, D. F., Wilson, R. J. S., and Briffa, K. R.: Effect of scaling and regression
30
on reconstructed temperature amplitude for the past millennium, Geophys. Res. Lett., 32, L07711, doi:10.1029/2004GL021236, 2005b.
CPD
7, 3919–3957, 2011Cross-comparison at the Pyrenees
I. Dorado Li ˜n ´an et al.
Title Page
Abstract Introduction
Conclusions References
Tables Figures
◭ ◮
◭ ◮
Back Close
Full Screen / Esc
Printer-friendly Version Interactive Discussion
Discussion
P
a
per
|
Dis
cussion
P
a
per
|
Discussion
P
a
per
|
Discussio
n
P
a
per
|
Long-term drought severity variations in Morocco, Geophys. Res. Lett., 34, L17702, doi:10.1029/2007GL030844, 2007.
Esper, J., Frank, D., B ¨untgen, U., and Kirdyanov, A.: Influence of pith offset on tree-ring chronol-ogy trend, TRACE 7, 205–210, 2009.
Esper, J., Frank, D., B ¨untgen, U., Verstege, A., Hantemirov, R. M., and Kirdyanov, A.: Trends
5
and uncertainties in Siberian indicators of 20th century warming, Glob. Change Biol., 16, 386–398, 2010.
Frank, D. C., B ¨untgen, U., B ¨ohm, R., Maugeri, M., and Esper, J.: Warmer early instrumen-tal measurements versus colder reconstructed temperatures: shooting at a moving target, Quaternary Sci. Rev., 26, 3298–3310, 2007.
10
Fritts, H. C.: Tree Rings and Climate, Academic Press, New York, 1976.
Garcia-Ruiz, J. M. and Lasanta, T.: Land use changes in the Spanish Pyrenees, Mt. Res. Dev., 10, 201–214, 1990.
G ´omez-Navarro, J. J., Mont ´avez, J. P., Jerez, S., Jim ´enez-Guerrero, P., Lorente-Plazas, R., Gonz ´alez-Rouco, J. F., and Zorita, E.: A regional climate simulation over the Iberian
Penin-15
sula for the last millennium, Clim. Past, 7, 451–472, doi:10.5194/cp-7-451-2011, 2011a. G ´omez-Navarro, J. J., Mont ´avez, J. P., Jim ´enez-Guerrero, P., Jerez, S., Lorente-Plazas, R.,
Gonz ´alez-Rouco, J. F., and Zorita, E.: Internal and external variability in regional simulations of the Iberian Peninsula climate over the last millennium, Clim. Past Discuss., 7, 2579–2607, doi:10.5194/cpd-7-2579-2011, 2011b.
20
Gonz ´alez-Rouco, J. F., Beltrami, H., Zorita, E., and von Storch, H.: Simulation and inversion of borehole temperature profiles in surrogate climates: Spatial distribution and surface cou-pling, Geophys. Res. Lett., 33, L024693, doi:10.1029/2005GL024693, 2006.
Gonz ´alez-Rouco, J. F., Beltrami, H., Zorita, E., and Stevens, M. B.: Borehole climatol-ogy: a discussion based on contributions from climate modeling, Clim. Past, 5, 97–127,
25
doi:10.5194/cp-5-97-2009, 2009.
Grell, G. A., Dudhia, J., and Stauffer, D. R.: A description of the fifth-generation penn state/ncar mesoscale model (mm5). – Technical Report NCAR/TN-398+STR, National Center for At-mospheric Research, 1994.
Grudd, H.: Tornetrask tree-ring width and density AD 500–2004: a test of climatic sensitivity
30
and a new 1500 year reconstruction of northern Fennoscandian summers, Clim. Dynam., 31, 843–857, 2008.