Topographic data generated from Radarsat Images
Over West Kalimantan, Indonesia
Ishak Hanafiah Ismullah & Rian Nurtyawan
Department of Geodetic Engineering FTSL, Bandung Institute of Technology
Abstract. Indonesia is a tropical country which has dominant cloud coverage, and some of the area has cloud cover almost all year long. Mapping by optical sensors, especially with Photogrammetric method shows a very good result, but the main constraint is cloud cover conditions, and this was the weakness point of this method.
This study describe the technique for deriving Topographic data from Radarsat Synthetic Aperture Radar stereo image pair and apply it to an image pair over West Kalimantan, Indonesia. This paper contains also brief discussion of the use of stereo SAR to derive Digital Elevation Model, the site condition and the source of validation data. The result shows that Radarsat data recommended only for 1 : 100.000 or smaller.
Keywords: Radarsat; Photogrammetry; DEM; Radargrammetry; West Kalimantan.
1
Introduction
The aim of this study is to assess the Radarsat imagery for topographic mapping, especially the geometric point of view by radargrammetric processing. Topographic condition will represented by Digital Elevation Model (DEM) of the study area.
When a target or study area is imaged from two different incidence angles, in the case of spaceborne radar, differential relief displacements cause image parallax on the radar image. This process allows for radar images to be viewed stereospically. For same side stereo airborne radar, has been used operationally for some years to generate topographic maps by radargrammetric technique, but since Radar satellite launched in 1995 (Radarsat), implementation radar satellite become promising for some application, especially for cloudy area, to obtain topographic map.
Radarsat sensors has some possibilities to arrange incidence angle into 3 positions, and this was the main different comparing with Radar imageries came from ERS satellite, which has fix position incidence angle, 23 . 0
In addition, to provide stereoscopic viewing, radar parallax may be measured and used to compute approximate heights.
Different with aerial photography, the acquisition data for radar imageries is always done by side looking, while aerial photography always done by vertical optical axis.
2
Geometric Configuration
The basis of any stereo process is that, by looking at the same point from two different positions in space. This is illustrated in Fig.1 below, where relief displacements cause image parallax on the radar image and toward the sensor.
Figure 1 Image parallax on the radar image.
In Figure 1, h is object height,
P
1 is parallax from 1st image, is parallaxfrom 2
2
P
nd image and dP is radar parallax =
2
1
P
P
−
.
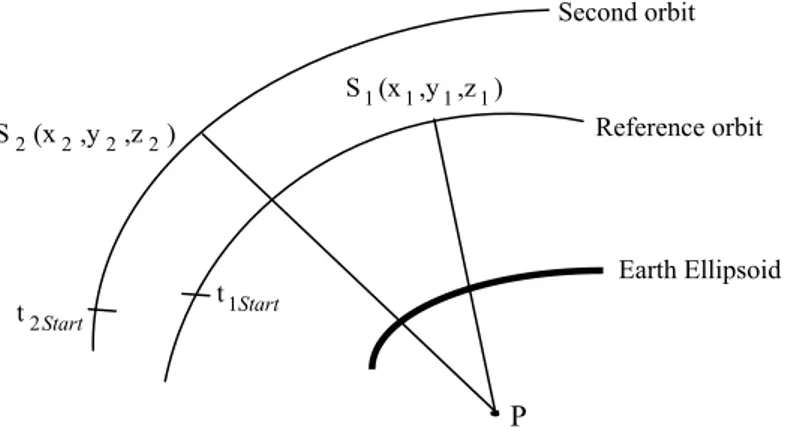
Figure 2 Imaging geometry with zero Doppler position (S1 and S ) of the two sensors with reference to the point P on the Earth Ellipsoid.
2
Second orbit
t2Start
Reference orbit S1(x1,y1,z1)
t1Start Earth Ellipsoid
P S2(x2,y2,z2)
1
θ
θ
21
θ
2
θ
Radar 1 Radar 2
h
1
P
2From the same side stereo imaging geometry, we can calculate the three-dimensional position of a point as illustrated in Figure 2.
The coordinate of P are calculated by solving the following system of nonlinear equations:
)
,
,
(
1x
y
z
G
≡
22 2 2 2
b
P
a
P
P
z y x−
−
= 0 Ellipsoid equation (1)
≡
)
,
,
(
2x
y
z
G
P
S
P
S
P
S
−
′
−
′
−
λ
)
)(
(
2
= 0 SAR Doppler equation (2)
)
,
,
(
3x
y
z
G
≡
R0 +mr.j− S −P = 0 Slant range equation (3)where:
P
(
P
x,
P
yP
z)
is the point on the ellipsoidS is the respective sensor position
P
′
is the speed of pointP
in the coordinate systemconcerned relative to the inertial system
S′ is the respective sensor velocity
j is the image coordinate in range
0
R
is the offset in the slant ranger
m
is the slant range sampling intervalλ
is the radar wavelengtha and b are the parameters of the two semi axis of the ellipsoid
The solution of this system of nonlinear equations is obtained by iteration using Newton’s method.
The three dimensional position vector
P
can be transformed into map coordinates (e.g. Northings and Eastings) and a height above a reference ellipsoid or geoid. When arranged into a regular map coordinate grid, the heights are referred to as Digital Elevation Model (DEM).Consider the same side viewing configuration illustrated in Fig. 1, where we have a target at height h viewed at incidence angle
θ
1 andθ
2 respectively.Trigonometric relation shows that the displacement of the target from its true position when viewed from Radar sensor,
= h cot
1
If we are to gain stereo information from the two views, the only condition is that the difference in displacement caused by viewing from the two positions is measurable. This means,
dP = |
P
2−
P
1 | (5)where dP is the spatial resolution image, or radar parallax.
We can easily invert this equation to find the minimum height difference measurable from stereo SAR for any given spatial resolution and incidence angle, this means,
h =
1
2 cot
cot
θ
hθ
h
dP
± (6)
h is the minimum height measurable.
3
Stereo SAR Processing
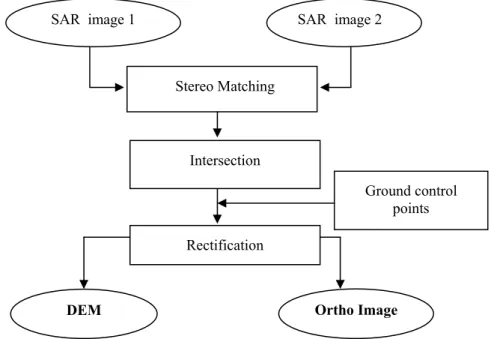
The processing stages in Radargrammetric for Radarsat imageries are illustrated in flow diagram as shown in Figure 3.
SAR image 1 SAR image 2
Stereo Matching
Intersection
Rectification
DEM Ortho Image
Ground control points
3.1
Stereo Matching
Stereo matching covers all aspects of data input and the matching itself, which involves the systematic identification of the same points in the two different images. Radar parallax are measured for each point and eliminate these Radar parallax in order to obtain the relative stereoscopic model.
3.2
Intersection
Intersection is a well define problem and has been approached through radargrammetric modeling. The disparity between the two images is converted into grid reference using specified ellipsoid, WGS’84.
3.3
Rectification
In this stage, the irregular grid of position and height is placed into regular map projection grid, essentially rectifying and geocoding the data.
4
Site Description and Radarsat Data
West Kalimantan is always covered by cloud almost all year long, and has heterogen topographic condition, from flat, hilly and mountainous terrain.
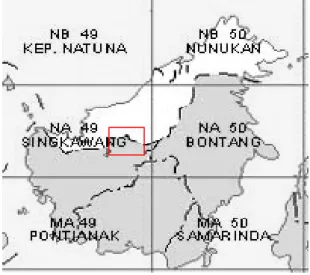
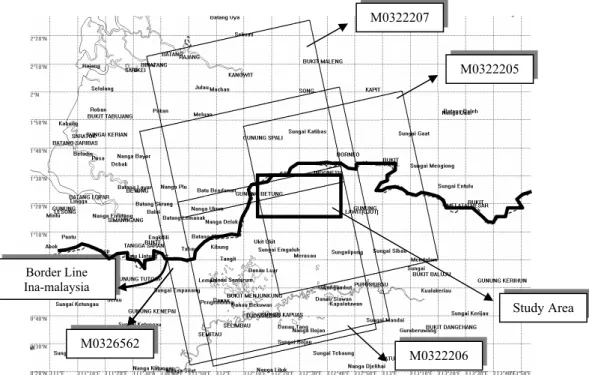
Figure 4 shows the location of study area in west Kalimantan, and Figure 5 shows the coverage of the Radarsat images over study area.
Study Area M0322205 M0322207 M0322206 M0326562 Border Line Ina-malaysia
Figure 5 Radarsat coverage over study area.
Table 1 and Table 2 show the specification and total data using for this study.
Table 1 Radarsat data specification.
No Scene ID Beam Mode Date Orbit
1 2 3 4 M0326562 M0322206 M0322205 M0322207 Wide 2 Standart 7 Standart 6 Standart 7
27 June 2003 26 April 2003 9 April 2003 26 April 2003
Ascending Ascending Ascending Ascending
Table 2 Radarsat Incident angle.
No Scene ID Incident angle
5
Generation of Topographic Data over West Kalimantan Site
Although all the existing Radarsat data for this study (4 scenes) have the same ascending orbit, each scene have different beam mode. Radargrammetric processing done using PCI 8.3 version software, and Photogrammetric map (1:50.000) used for validation.
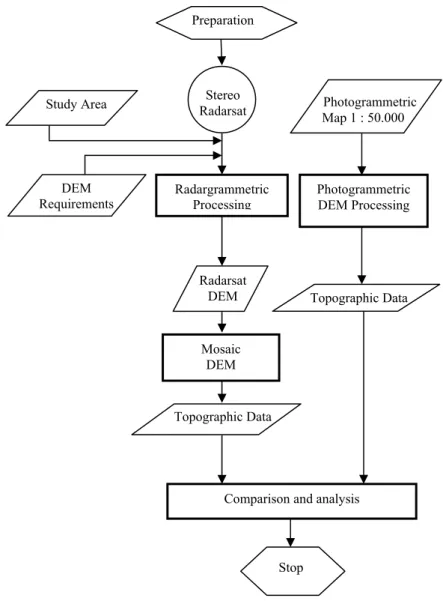
Flow diagram of the study, illustrated in Figure 6 below,
Figure 6 Study methodology. Preparation
Stereo
Radarsat Photogrammetric Map 1 : 50.000 Study Area
Radargrammetric Processing
Radarsat DEM
Photogrammetric DEM Processing
Topographic Data DEM
Requirements
Mosaic DEM
Topographic Data
Comparison and analysis
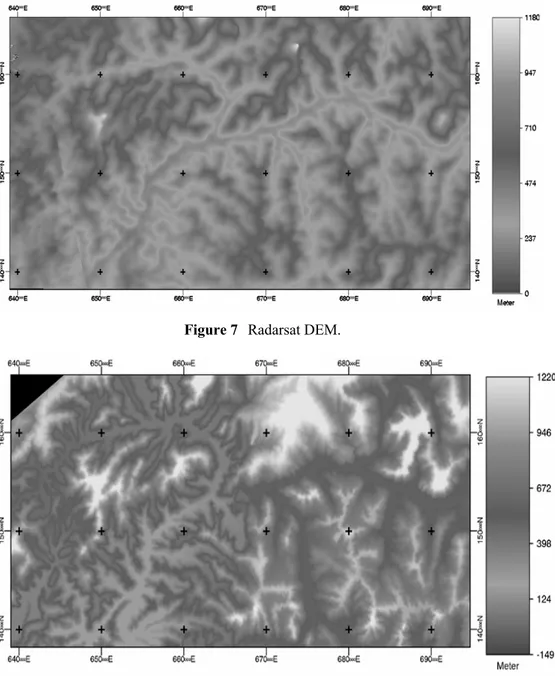
After executing SAR stereo radargrammetric processing, the result of Radarsat DEM illustrated in Figure 7, and Figure 8 illustrated the result of Photogrammetric DEM.
Figure 7 Radarsat DEM.
6
Comparison and Analysis
As Photogrammetric DEM used for validation, the different value from two sources data (Photogrammetric DEM and Radarsat DEM) for any point i is x i,
then we can calculate the RMSE using
RMSE =
n xi
∑
±2 ) (
where n = total evaluation points
xi = (Radarsat DEM – Photogrammetric DEM).
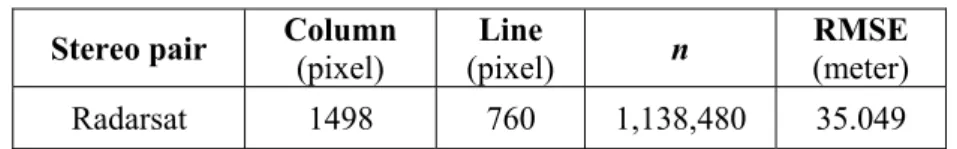
Table 3 shows the result of RMSE From Radarsat DEM,
Table 3 Result of RMSE from Radarsat DEM.
Stereo pair Column
(pixel)
Line
(pixel) n
RMSE
(meter)
Radarsat 1498 760 1,138,480 35.049
The DEM accuracy can be divided into groups or classes. For a good map, 90 % of the heights should have an accuracy not more than half contour interval or if less than 90 %, we will obtain less accuracy map.
Table 4 illustrated the probability of errors for the map classes,
Table 4 Probability of errors (Petrie & Kennie, 1990).
Prob. of errors (S) Percentage (1/2 contour interval) Map Class
1.6449 90.00% I
1.5 86.60% II
1.0 68.27% III
0.6745 50.00% IV
The results describe above shows that it is possible to derive topographic data from stereo Radarsat images by radargrammetric technique.
For topographic map in the scale of 1 : 100.000, contour interval is 50 meters, so for a good map, 90% should have an accuracy not more than half contour interval, means 25 meters.
1.6449 x
σ
= 25 meters
σ
= 15.198 metersRadarsat result illustrated at Table 3 shows that RMSE is 35.049 meters, is not accepted for a good map, but accepted for 4th Class Topographic map with 50% of the height should have not more than half contour interval,
0.6745 x
σ
= 25 meters
σ
= 37.064 metersFor Topographic map in the scale of 1 : 250.000 contour interval is 125 meters. From the same Table 3, for a good map, (1st class map)
1.6449 x
σ
= 62.5 meters
σ
= 37.996 metersSo, Radarsat result accepted for 1 : 100.000 Topographic map (4th Class) and accepted for 1 : 250.000 as a good map over study area.
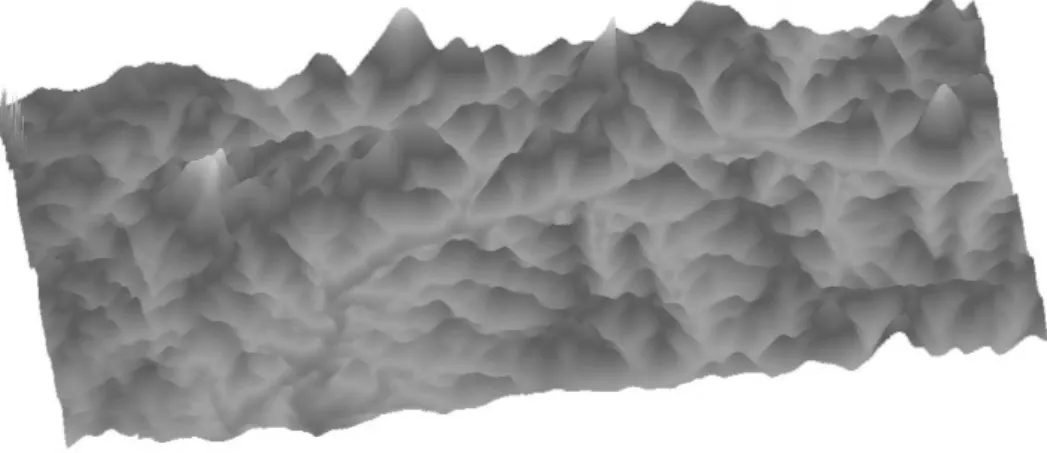
Figure 9 shows the final Topographic data of the study area.
Figure 9 Final Topographic data of the study area (3D view).
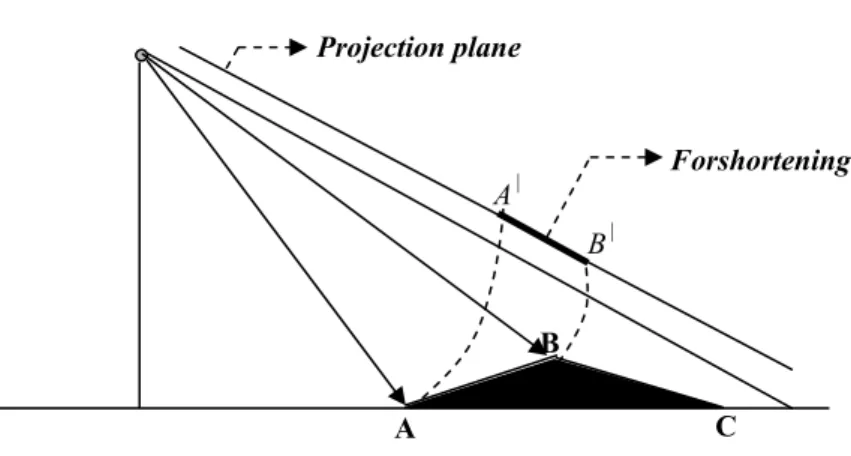
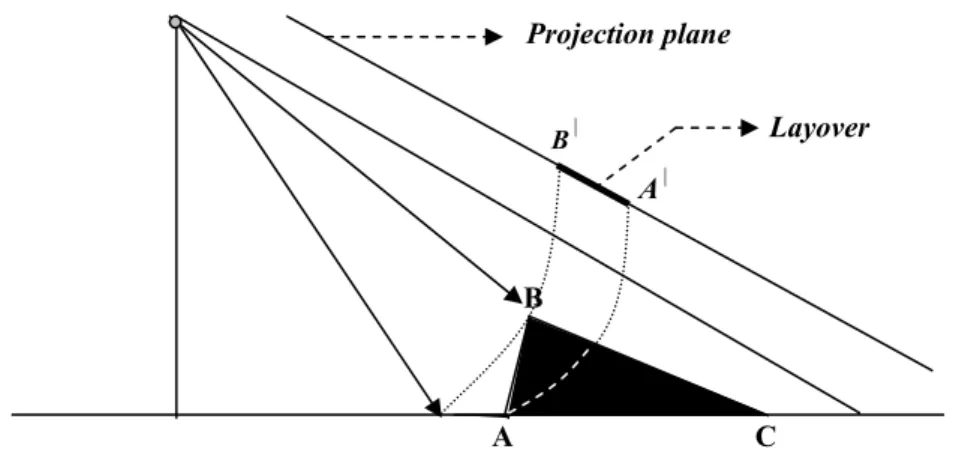
systems, e.q. Shadow, Forshortening, and Layover effects. Figure 11a, 11b, 11c illustrated the topographic distortions.
Figure 10 Different Radarsat and Photogrammetric (3-D views).
Figure 11a Shadow effect (No information in the shadow area).
A
B
C
Shadow
D A|
B|
Projection plane
Projection plane
A
B
C
Forshortening A|
B|
A B
C
B|
A|
Layover Projection plane
Figure 11c Layover effect (AB become B|A| in the projection).
7
Conclusion and Recommendation
Base on the results previously described above, it can be concluded that Radargrammetric process for Radarsat images is not suitable for large scale, but should be used for 1 : 100,000 or smaller scale topographic map,
This study only investigates the use of the same side Radarsat stereo pair. Therefore more study is recommended with another stereo pairs combination, e.g,
a. images from ascending and descending orbit modes;
b. beam mode combination. (Fine, Standart or Wide beam); and c. use of Ground control points with corner reflectors.
References
1. Ackerman, F., Experimental investigation into accuracy of contouring through DTM, Proceeding of Digital terrain Modelling Symposium, 165-192, St. Louis, USA (1978).
2. Dirk Geudtner, The Interferometric Processing of ERS SAR-1 data,
European Space Agency (1996).
3. Image Center, Radar Remote Sensing. Cours Materials. Ontario Canada.
4. Ismullah, I. H., Model Tinggi Permukaan Dijital Hasil Pengolahan
Radar Interferometri Satelit untuk Wilayah Berawan, Dissertation, Bandung Institute of Technology (2002).
6. Petrie, G. & Kennie, T. J. M., Terrain Modelling in Surveying and Civil Engineering. McGraw-Hill, Inc. London, England (1991).
7. Nurtyawan, Rian, Model Tinggi Permukaan Digital Hasil Penurunan Citra Radarsat, Magister Thesis, Bandung Institute of Technology (2005).