TCD
4, 767–786, 2010Spatially extensive estimates in annual
accumulation
S. de la Pe ˜na et al.
Title Page
Abstract Introduction
Conclusions References
Tables Figures
◭ ◮
◭ ◮
Back Close
Full Screen / Esc
Printer-friendly Version Interactive Discussion
Discussion
P
a
per
|
Dis
cussion
P
a
per
|
Discussion
P
a
per
|
Discussio
n
P
a
per
|
The Cryosphere Discuss., 4, 767–786, 2010 www.the-cryosphere-discuss.net/4/767/2010/ doi:10.5194/tcd-4-767-2010
© Author(s) 2010. CC Attribution 3.0 License.
The Cryosphere Discussions
This discussion paper is/has been under review for the journal The Cryosphere (TC). Please refer to the corresponding final paper in TC if available.
Spatially extensive estimates in annual
accumulation in the dry zone of the
Greenland Ice Sheet inferred from radar
altimetry
S. de la Pe ˜na1, P. Nienow1, A. Shepherd2, V. Helm3, D. Mair4, E. Hanna5, P. Huybrechts6, Q. Guo7, R. Cullen8, and D. J. Wingham9
1
School of Geosciences, University of Edinburgh. Institute of Geography, Drummond St., Edinburgh, EH8 9XP, UK
2
School of Earth and Environment, University of Leeds, Leeds, LS2 9JT, UK
3
Alfred Wegener Institute, Am Handelshafen 12, 27570, Bremerhaven, Germany
4
Department of Geography and Environment, University of Aberdeen Elphinstone Road, Aberdeen, AB24 3UF, UK
5
Department of Geography, University of Sheffield, Sheffield, S10 2TN, UK
6
TCD
4, 767–786, 2010Spatially extensive estimates in annual
accumulation
S. de la Pe ˜na et al.
Title Page
Abstract Introduction
Conclusions References
Tables Figures
◭ ◮
◭ ◮
Back Close
Full Screen / Esc
Printer-friendly Version Interactive Discussion
Discussion
P
a
per
|
Dis
cussion
P
a
per
|
Discussion
P
a
per
|
Discussio
n
P
a
per
|
7
School of Engineering, University of California Merced, 5200 North Lake Rd. Merced, CA 95343, USA
8
European Space Agency ESTEC, Keplerlaan 1 Postbus 299 2200 AG Noordwijk, The Netherlands
9
Dept. of Earth Sciences, University College London, Gower Street, London WC1E 6BT, UK
Received: 12 May 2010 – Accepted: 9 June 2010 – Published: 17 June 2010
Correspondence to: S. de la Pe ˜na ([email protected])
TCD
4, 767–786, 2010Spatially extensive estimates in annual
accumulation
S. de la Pe ˜na et al.
Title Page
Abstract Introduction
Conclusions References
Tables Figures
◭ ◮
◭ ◮
Back Close
Full Screen / Esc
Printer-friendly Version Interactive Discussion
Discussion
P
a
per
|
Dis
cussion
P
a
per
|
Discussion
P
a
per
|
Discussio
n
P
a
per
|
Abstract
We present estimates of accumulation rate along a 200 km transect ranging in elevation from 2750 to 3165 m in the dry snow zone on the western slope of the Greenland Ice Sheet. An airborne radar altimeter is used to estimate the thickness of annual internal layers and, in conjunction with ground based snow/firn density profiles, annual accu-5
mulation rates between 1998 and 2003 are derived. The observed inter-annual vari-ability is high, with the annual mean accumulation rate estimated at 0.372 m.w.e. yr−1 (s.d.±0.063 m.w.e. yr−1). Mean accumulation rates modelled using meteorological data overestimate our results by 13% on average, but by 37% and 32% in the years 2001 and 2002. The methodology presented here demonstrates the potential to obtain 10
accurate and spatially extensive accumulation rates from radar altimeters in regions of ice sheets where field observations are sparse.
1 Introduction
It is known that the arctic region is warming and that the margins of the Greenland Ice Sheet are experiencing substantial thinning (Hassol, 2004; Steffen et al., 2004; Zwally 15
et al., 2005; Pritchard et al., 2009). Increasing fresh water input from the Greenland Ice Sheet (GrIS) to the oceans has created a growing concern about the effects it could have on climate and sea level rise. Although changes in the volume of an ice sheet may be estimated by observing variations in its surface elevation (e.g. Wingham et al., 1998; Shepherd et al., 2001 and 2002; Zwally et al., 2005) and from gravity 20
measurements (e.g. Velicogna, 2009), these methods do not distinguish ice dynamics and accumulation fluctuations which may introduce errors in mass balance estimates.
Observations show that surface melt extent and duration have increased dramati-cally since the late 1970s (Abdalati and Steffen, 1997; Steffen et al., 2004; Mote, 2007; Hanna et al., 2008). Meanwhile, there are reports of an increase in the surface eleva-25
TCD
4, 767–786, 2010Spatially extensive estimates in annual
accumulation
S. de la Pe ˜na et al.
Title Page
Abstract Introduction
Conclusions References
Tables Figures
◭ ◮
◭ ◮
Back Close
Full Screen / Esc
Printer-friendly Version Interactive Discussion
Discussion
P
a
per
|
Dis
cussion
P
a
per
|
Discussion
P
a
per
|
Discussio
n
P
a
per
|
al., 2006), supporting calibrated climate models which show that some regions of the ice sheet have experienced higher than average accumulation rates, especially in the south (Burgess et al., 2010). A recent study reveals that the total accumulation in the GrIS is up by 24%, and that the surface mass balance estimates to be 63% higher than previous calculations (Ettema et al, 2009). However, Greenland’s weather and accu-5
mulation patterns have high spatial and temporal variability (Mosley-Thompson et al., 2001; Steffen et al., 2004; Wang et al., 2007), and elevation changes may be caused by factors other than accumulation and melt such as snow compaction and densifi-cation processes (Parry et al., 2007). For this reason, accurate estimates of mass balance made from elevation change observations require continuous measurements 10
of accumulation and compaction rates across different regions of an ice sheet. Direct observations of snow accumulation in Greenland are limited, and measurements are affected by wind patterns and for the most part made at stations located in coastal re-gions (Dethloffet al., 2002), while accumulation estimates derived from ice cores and snow density measurements are also limited spatially.
15
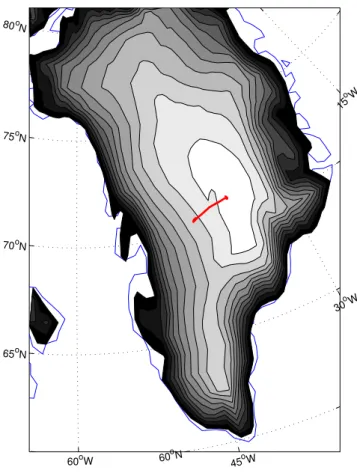
Here, we use airborne radar altimetry data and snow density measurements de-rived from snow/firn cores and neutron-probe observations obtained over the dry snow zone of the GrIS to estimate annual accumulation rates for the years 1998-2003 along a 200 km transect ranging in elevation from 2750 m to 3165 m on the western slope of the GrIS (Fig. 1). The estimates obtained are compared with snow accumulation 20
rates derived from a weather prediction numerical model run retrospectively using data from the European Centre for Medium-Range Weather Forecast (ECMWF) 45-year (1957–2002) reanalysis ERA-40 and ECMWF operational analysis for 2002-onwards data (Hanna et al., 2005, 2006 and 2008). This model has been recently corrected and calibrated for Greenland with recent field measurements (Bales et al., 2009). Tech-25
TCD
4, 767–786, 2010Spatially extensive estimates in annual
accumulation
S. de la Pe ˜na et al.
Title Page
Abstract Introduction
Conclusions References
Tables Figures
◭ ◮
◭ ◮
Back Close
Full Screen / Esc
Printer-friendly Version Interactive Discussion
Discussion
P
a
per
|
Dis
cussion
P
a
per
|
Discussion
P
a
per
|
Discussio
n
P
a
per
|
estimated accumulation rates presented. ASIRAS is designed to emulate the opera-tion of the SAR/Interferometric Radar Altimeter (SIRAL) onboard the recently launched CryoSat-2 (Wingham et al., 2006), thus one of the objectives of this paper is to demon-strate the viability of estimating accumulation rates from CryoSat-2 or other space borne altimeters with similar operating characteristics. CryoSat-2 has a poorer ver-5
tical resolution, and due to its larger footprint, it has higher speckle noise, so further data processing would be required for an analysis of accumulation layers.
2 Data and methodology
The data reported here were derived from observations made by ASIRAS during the 2004 CryoSat Validation and Calibration field experiment. On September 17th 2004, 10
the ASIRAS radar altimeter was flown along the Expedition Glaciologique au Groen-land (EGIG) line (Fischer et al., 1995) over the GrIS operating in High Altitude Mode (HAM). We present a 200 km transect, along the EGIG line, on the western slope of the dry snow region of the ice sheet ranging in elevation from 2750 m to 3165 m. The system is a pulse-width limited, coherent, and phase sensitive radar altimeter that op-15
erates in the Ku band, at a central frequency of 13.5 GHz and with a bandwidth of 1 GHz. The system has a footprint of 4.5 m along track (after SAR processing) and the large bandwidth provides high vertical resolution, so it is possible to analyze in detail the structure of the observed snowpack.
Radar signals can penetrate snow, and are partially backscattered by changes en-20
countered in both snow density and crystal structure. Thus stratigraphically distinct layers in the snowpack as are commonly formed early in the fall in the dry snow region of the GrIS (Autumn hoar) make it possible to identify widespread internal layers re-flecting annual accumulation (Hawley et al., 2006). An advantage in using the Autumn hoar to identify annual layers is that it coincides with the commonly used concept of a 25
TCD
4, 767–786, 2010Spatially extensive estimates in annual
accumulation
S. de la Pe ˜na et al.
Title Page
Abstract Introduction
Conclusions References
Tables Figures
◭ ◮
◭ ◮
Back Close
Full Screen / Esc
Printer-friendly Version Interactive Discussion
Discussion
P
a
per
|
Dis
cussion
P
a
per
|
Discussion
P
a
per
|
Discussio
n
P
a
per
|
and Stauffer, 1994). Thus, when referring to the observed accumulation rate in 1999, we are referring to the period covering∼October 1998 to∼September 1999.
To estimate the distance travelled, we calculate the speed of light in snow based on the dielectric permittivity of snow. By neglecting any water content (dry snow), we assume we are working on a lossless media so we can obtain the permittivity of snow 5
ne directly from the snow density, for which we use mean values for each of the layers detected based on snow density profiles obtained from snow/firn cores and neutron-probe observations. The permittivity for dry snow with a density under 0.5 kg m−3 is given by (Yankielun et al., 2004):
ne=(1+1.9ρs)1/2 (1)
10
whereρs is the density of snow. Using Eq. 1, we can estimate the speed of light vc
through the snowpack from its linear relationship with the electric permittivity of snow,
vc=c/ne, where cis the speed of light in vacuum. The snow density measurements used to estimate dielectric permittivity and accumulation were obtained from snow/firn cores and neutron-probe observations acquired at Summit, Greenland at 3200 m (Haw-15
ley et al. 2008) and at a site located 25 km west of the start of the transect at an altitude of 2650 m (Hawley et al., 2006). Summit is located 150 km north from the surveyed path, but along the ice divide and at only 35 m above the elevation of our easternmost observation. We assume a linear decrease in density with elevation from the lower site to Summit and use the estimated densities at each point along the transect to derive 20
dielectric permittivity and accumulation. Although this is a simplistic approximation, conditions at regions of the GrIS above 2000m remain very similar and there is no reason to suggest that changes in density in this area are not directly dependant on elevation.
We estimated the depth of each observed layer at 25 km intervals along the 200 km 25
TCD
4, 767–786, 2010Spatially extensive estimates in annual
accumulation
S. de la Pe ˜na et al.
Title Page
Abstract Introduction
Conclusions References
Tables Figures
◭ ◮
◭ ◮
Back Close
Full Screen / Esc
Printer-friendly Version Interactive Discussion
Discussion
P
a
per
|
Dis
cussion
P
a
per
|
Discussion
P
a
per
|
Discussio
n
P
a
per
|
110 km along the transect), the depth of the observed layers vary as much as ±9 cm between the different waveforms, while at higher elevations no differences larger than the system range accuracy, which is estimated to fall within 3 cm (Hawley et al., 2006), are observed. In a previous study, winter accumulation rate estimated from ASIRAS at one site over the percolation zone was estimated at 0.63±0.06 m.w.e., which com-5
pared favourably with the 0.61 m.w.e. measured in the field (Helm et al., 2007). Un-certainty is introduced from the assumption that each layer delimits exactly one annual accumulation period. In reality, the snow density changes that cause radar reflections are not formed at exactly the same time every year. For example, it is known that the 2002 summer melt season was unusually long with areas experiencing 2 weeks more 10
melt than on average (Steffen et al., 2004), so if temperatures remained unusually high across the whole ice sheet, the formation of the autumn hoar may have been delayed, slightly modifying the length of the period for which the accumulation rate estimates are made. However, this is highly unlikely due to the predominant cold temperatures in the dry snow zone of the GrIS.
15
3 Results and discussion
The radar altimeter observations along the 200 km transect are shown in Fig. 2. Indi-vidual waveforms are aligned with respect to the signal in each waveform estimated to be the surface, which reveals horizontal continuity in the firn structure with clear lay-ers observable to a depth of about 10 m (travel time =80 ns). A strong return from 20
the surface is evident, with several weaker reflections from the volume of the snowpack along the whole transect. These weaker reflections occur at interfaces within the snow-pack where sharp changes in the firn density/structure occur, as described earlier, and represent annual accumulation periods. The distance between the annual layers de-creases with increasing elevation; this is expected, since the mean snow accumulation 25
TCD
4, 767–786, 2010Spatially extensive estimates in annual
accumulation
S. de la Pe ˜na et al.
Title Page
Abstract Introduction
Conclusions References
Tables Figures
◭ ◮
◭ ◮
Back Close
Full Screen / Esc
Printer-friendly Version Interactive Discussion
Discussion
P
a
per
|
Dis
cussion
P
a
per
|
Discussion
P
a
per
|
Discussio
n
P
a
per
|
are lower. It has been observed elsewhere that radar signals penetrate deeper into the snowpack as snow density decreases, thereby revealing additional layers with in-creasing elevation and dein-creasing snow density (Scott et al., 2006). The change in thickness of each layer is clearest in 2004 (the top layer), decreasing from 1.57 m at 2750 m (70.45◦N, 43.52◦W) to 1.16 m at 3165 m (71.17◦N, 37.88◦W). The layers un-5
derneath reveal a smaller change in thickness, likely due to the fact that they have been subject to compaction for longer. For this reason, only accumulation estimates for layers below the 2004 layers are made.
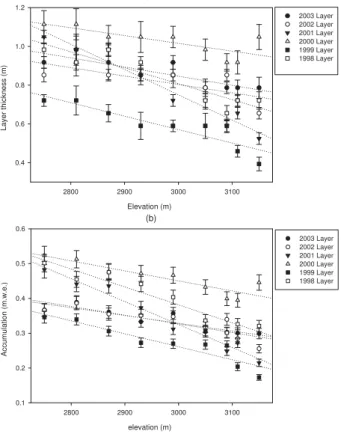
Figure 3a shows the estimated thickness of the annual layers for 1998–2003. The decrease in layer thickness with increasing elevation is evident in all years, and there 10
is substantial inter-annual variability observed in the rate at which thickness decreases with elevation. A decrease in thickness of 14–18% is observed in 2000 and 2003, 23– 27% in 1998 and 2002, and 45% and 50% in 1999 and 2001 respectively. Figure 3b combines the estimated annual layer thickness (Fig. 3a) with derived snow density to estimate the total accumulation for each annual layer down to 1998. There are large 15
inter-annual variations in accumulation ranging from 0.271±0.056 m.w.e. yr−1in 1999 to 0.458±0.045 m.w.e. yr−1 in 2000 (Table 1). Accumulation rate decreases from west to east along the 200 km transect reducing by between 14–18% for 2003 and 2000; 30–36% for 2002 and 1998; 50–55% for 2001 and 1999 (percentages calculated from the trend shown by a linear regression estimated for each year, with an average 20
correlation coefficient r2 of 0.826), confirming that the trajectory of moist air masses follows an easterly path along the western slope of the GrIS in the vicinity of the EGIG line. Furthermore, strong katabatic winds may further contribute to the transfer of snow from higher to lower elevations away from the ice divide. It is noteworthy that while the thickness in the annual layers between the lowest and highest elevations along 25
TCD
4, 767–786, 2010Spatially extensive estimates in annual
accumulation
S. de la Pe ˜na et al.
Title Page
Abstract Introduction
Conclusions References
Tables Figures
◭ ◮
◭ ◮
Back Close
Full Screen / Esc
Printer-friendly Version Interactive Discussion
Discussion
P
a
per
|
Dis
cussion
P
a
per
|
Discussion
P
a
per
|
Discussio
n
P
a
per
|
We calculated the mean accumulation rates at 25 km intervals along the transect (Ta-ble 2) and present these in conjunction with both the mean annual estimates derived from the ERA-40 data-based model output and estimates made from two previous field based studies (Fischer et al., 1994; Anklin and Stauffer, 1994). Comparison with field data was only possible at our lowermost point at 2750 m, with an estimated accumula-5
tion rate of 0.461 m.w.e.±0.099 compared to 0.423±0.012. In practice, the difference is only related to the accuracy of the system to estimate layer thickness, since both in-situ and ASIRAS derived accumulation estimates are made using the same densities. Our estimates are higher from the previously recorded observations, with an increase in accumulation of 19% at sites above 3000 m, but only 6% higher at sites below 3000 m 10
(which is within our error estimate). The ERA-40 model over-predicts the ASIRAS de-rived accumulation rates by an average of 13.5%. As stated earlier, there is a clear spatial gradient in accumulation rate, with an annual mean of 0.461 m.w.e.±0.099 at 2750 m elevation decreasing to 0.296 m.w.e.±0.084 at 3165 m. To prove that the as-sumption of a linear decreasing density from 2650 m to Summit does not introduce 15
large errors, we made a second estimate of the accumulation rates using a constant density for each annual layer. In the highest point (where the snow density is the low-est and thus the error would be the highlow-est) the low-estimates were 0.0298 m.w.e.±0.014 larger, or roughly 10%.
To further illustrate the importance of monitoring short scale spatial and temporal 20
variability, we compare our results with accumulation rates derived from an ERA-40 data-based meteorological model. The model runs with meteorological data thus do not depend on density measurements. The model was downscaled to 5×5 km grid and calbrated against kriged ice-core data mapped to the same grid (Bales et al., 2009). Figure 4 illustrates the spatial and the temporal variability of the estimates derived both 25
TCD
4, 767–786, 2010Spatially extensive estimates in annual
accumulation
S. de la Pe ˜na et al.
Title Page
Abstract Introduction
Conclusions References
Tables Figures
◭ ◮
◭ ◮
Back Close
Full Screen / Esc
Printer-friendly Version Interactive Discussion
Discussion
P
a
per
|
Dis
cussion
P
a
per
|
Discussion
P
a
per
|
Discussio
n
P
a
per
|
accumulation for a given year may be subject to unusual meteorological conditions that affect the model output. It is known that the GrIS experienced unusually high temper-atures in 2002 (Steffen et al., 2004; Wang et al., 2007), which increased precipitation in the coastal regions but may not have significantly enhanced accumulation rates in the higher regions of the ice sheet. Coincidentally, the model results show the high-5
est accumulation rates in 50 years for south-eastern Greenland in 2002 (Hanna et al., 2006).
4 Summary and conclusions
We presented estimates of annual snow accumulation rates derived from observations made by the ASIRAS airborne radar altimeter along a 200 km transect of the dry snow 10
region on the western slope of the Greenland Ice Sheet. Different layers are identified within the snowpack, each associated with the annual snow accumulation for the period 1998–2003. The average annual accumulation is estimated at 0.372±0.063 m.w.e., but the rates exhibit both high spatial and temporal variability, with the mean accumu-lation rate estimated at 0.271 m.w.e. in 1999 and at 0.458 m.w.e. in 2000. A clear gra-15
dient in the thickness of each layer and in the associated estimates of annual accumu-lation is seen along the transect, with a 34.2%±16% mean decrease in accumulation from west to east each year. This trend has been observed in previous studies (Fischer et al., 1994; Anklin and Stauffer, 1994; Burgess et al., 2010) and reflects the dominant transport of water vapour in the region from west to east. Inter-annual variability in 20
accumulation has also been observed previously (Fischer et al., 1994). Comparison with historical records suggests that the accumulation patterns have increased by 19% above 3000 m over the last 30 years.
A new generation of radar altimeters have made it possible to obtain accurate esti-mates of snow accumulation from altimetry by combining the radar observations with 25
TCD
4, 767–786, 2010Spatially extensive estimates in annual
accumulation
S. de la Pe ˜na et al.
Title Page
Abstract Introduction
Conclusions References
Tables Figures
◭ ◮
◭ ◮
Back Close
Full Screen / Esc
Printer-friendly Version Interactive Discussion
Discussion
P
a
per
|
Dis
cussion
P
a
per
|
Discussion
P
a
per
|
Discussio
n
P
a
per
|
variability that cannot be predicted by the model. The differences seen between the model and our estimates provides insight on uncertainties in surface mass balance es-timates – a difference of approximately 45 km3on average from these results if applied to the dry snow area of the GrIS, significant if compared to the estimated total surface mass balance ranging from 170 to 308 km3yr−1
(Fettweis, 2007). In the context of the 5
ESA CryoSat-2 mission, designed to obtain very accurate measurements of ice sheet elevation change, the methodology we present will prove particularly useful for improv-ing the accuracy of mass balance estimates of the GrIS, since CryoSat-2 may also have the potential to identify subsurface accumulation layers. The methodology presented here shows the potential that current radar altimeters have to yield reliable estimates 10
of snow accumulation over large regions of the ice sheets which are otherwise difficult to monitor.
Acknowledgements. This work was funded by the UK Natural Environmental Reserach Council through grant NER/O/S/2003/00620 to the University of Edinburgh.
References
15
Abdalati, W. and Steffen ,K.: Snowmelt on the Greenland Ice Sheet as derived from passive
microwave Satellite Data, J. Climate., 10, 165–175, 1997.
Anklin, M. and Stauffer, B.: Pattern of annual snow accumulation along a west Greenland flow
lone: no significant change observed during recent decades, Tellus, 46B, 294–303, 1994. Bales, R. C., Guo, Q., Shen, D., McConnell, J. R., Du, G., Burkhart, J. F., Spikes, V. B., Hanna,
20
E., and Cappelen, J.: Annual accumulation for Greenland updated using ice core data devel-oped during 2000–2006 and analysis of daily coastal meteorological data. J. Geophys. Res., 114, D06116, doi:10.1029/2008JD011208, 2009.
Box, J. E., Bromwich, D. H., and Baim L.-S.: Greenland ice sheet surface mass balance 1991– 2000: Application of Polar MM5 mesoscale model and in situ data. J. Geophys. Res., 109,
25
D16105, doi:10.1029/2003JD004451, 2004.
TCD
4, 767–786, 2010Spatially extensive estimates in annual
accumulation
S. de la Pe ˜na et al.
Title Page
Abstract Introduction
Conclusions References
Tables Figures
◭ ◮
◭ ◮
Back Close
Full Screen / Esc
Printer-friendly Version Interactive Discussion
Discussion
P
a
per
|
Dis
cussion
P
a
per
|
Discussion
P
a
per
|
Discussio
n
P
a
per
|
ice sheet annual (1958–2007), J. Geophys. Res., 115, F02004, doi:10.1029/2009JF001293, 2010.
Dethloff, K., Schwager, M., Christensen, J. H., Kiilsholm, S., Rinke, A., and Dorn, W.: Recent
Greenland accumulation estimated from regional climate model simulations and ice core analysis, J. Climate, 15, 19, 2821–2832, 2002.
5
Ettema, J., van den Broeke, M. R., van Meijgaard, E., van de Berg, W. J., Bamber, J. L., Box, J. E., and Bales, R. C.: Higher surface mass balance of the Greenland ice sheet revealed by high-resolution climate modelling, Geophys. Res. Lett., 36, L12501, doi:10.1029/2009GL038110, 2009.
Fettweis, X.: Reconstruction of the 1979–2006 Greenland ice sheet surface mass balance
10
using the regional climate model MAR, The Cryosphere, 1, 21–40, 2007.
Fischer, H., Wagenbach, D., Laternser, M., and Haeberli, W.: Glacio-meterological and isotopic studies along the EGIG line, central Greenland, J. Glaciol., 41, 515–527, 1995.
Hassol, S. J.: Impacts of a Warming Arctic: Arctic Climate Impact Assessment, Cambridge University Press, 2004.
15
Hanna, E., Huybrechts, P., Steffen, K., Cappelen, J., Huff, R., Shuman, C., Irvine-Fynn, T.,
Wise, S., and Griffiths, M.: Increased runoff from melt from the Greenland Ice Sheet: a
response to global warming, J. Climate, 21(2), 331–341, 2008.
Hanna, E., McConnell, J., Das, S., Cappelen, J., and Stephens, A.: Observed and modelled Greenland ice sheet snow accumulation, 1958–2003, and links with regional climate forcing,
20
J. Clim., 19, 344–358, 2006.
Hanna, E., Huybrechts, P., Janssens, I., Cappelen, J., Steffen, K., and Stephens, A.: Runoff
and mass balance of the Greenland ice sheet, 1958–2003, J. Geophys. Res., 110, D13108, doi:1029/2004JD005641, 2005.
Hawley, R. L. and Morris, E. M.: Borehole optical stratigraphy and neutron-scattering density
25
measurements at Summit, Greenland, J. Glaciol., 52(179), 491–496, 2008.
Hawley, R. L., Morris, E. M., Cullen, R., Nixdorf, U., Shepherd, A., and Wingham, D. J.: ASIRAS airborne radar resolves internal annual layers in the dry-snow of Greenland, Geophys. Res. Lett, 33(4), L04502, doi:10.1029/2005GL025147, 2006.
Helm, V., Rack, W., Cullen, R., Nienow, P., Mair, D., Parry, V., and Wingham, D. J.: Winter
30
accumulation in the percolation zone of Greenland measured by airborne radar altimeter, Geophys. Res. Lett., 34, L06501, doi:10.1029/2006GL029185, 2007.
TCD
4, 767–786, 2010Spatially extensive estimates in annual
accumulation
S. de la Pe ˜na et al.
Title Page
Abstract Introduction
Conclusions References
Tables Figures
◭ ◮
◭ ◮
Back Close
Full Screen / Esc
Printer-friendly Version Interactive Discussion
Discussion
P
a
per
|
Dis
cussion
P
a
per
|
Discussion
P
a
per
|
Discussio
n
P
a
per
|
R., Wright, W., and Yungel, J.: Greenland Ice Sheet: high-elevation balnace and peripheral thinning, Science, 289, 428–430, 2000.
Mosley-Thompson, E., McConnell, J. R., Bales, R. C., Li, Z., Lin, P.-N., Steffen, K.,
Thomp-son, L. G., Edwards, R., and Bathke, D.: Local to regional-scale variability of annual net accumulation on the Greenland ice sheet from PARCA cores, J. Geophys. Res., 106, 24,
5
33839–33851, 2001.
Mote, T. L.: Greenland surface melt trends 1973–2007: Evidence of a large increase in 2007, Geophys. Res. Lett., 34, L22507, doi:10.1029/2007GL031976, 2007.
Nghiem, S. V., Steffen, K., Neumann, G., and Huff, R.: Mapping of ice layer extent and snow
accumulation in the percolation zone of the Greenland ice sheet, J. Geophys. Res., 110,
10
F02017, doi:10.1029/2004JF000234, 2005.
Parry, V., Nienow, P., Mair, D., Scott, J., Hubbard, B., Steffen, K., and Wingham, D.:
Investi-gations of meltwater refreezing and density variations in the snowpack and firn within the percolation zone of the Greenland ice sheet, Annals of Glac., 46, 61–68, 2007.
Pritchard, H. D., Arthern, R. J., Vaughan, D. G., and Edwards, L. A.: Extensive dynamic thinning
15
on the margins of the Greenland and Antarctic ice sheets, Nature, Oct 15, 461(7266), 971– 975, doi:10.1038/nature08471, 2009.
Scott, J., Nienow, P., Mair, D., Parry, V., Morris, E., and Wingham, D. J.: Importance of seasonal and annual layers in controlling backscatter to radar altimeters across the percolation zone of an ice sheet, Geophys. Res. Lett., 33, L24502, doi:10.1029/2006GL027974, 2006.
20
Steffen, K., Nghiem, S. V., Huff, R., and Neumann, G.: The melt anomaly of 2002 on the
Greenland Ice Sheet from active and passive microwave satellite observations, Geophys. Res. Lett., 31, L20402, doi:10.1029/2004GL020444, 2004.
Shepherd, A., Wingham, D. J., and Mansley, J. A. D.: Inland thinning of the Amundsen Sea sector, West Antarctica, Geophys. Res. Lett., 29(10), 1364, 10.1029/2001GL014183, 2002.
25
Shepherd, A., Wingham, D. J., Mansley, J. A. D., and Corr, H. J.: Inland thinning of Pine Island Glacier, West Antarctica, Science, 291, 862–864, 2001.
Thomas, R. H.: Greenland: recent mass balance observations, in: Bamber, J. L. and Payne, A. J., Mass balance of the cryosphere: observations and modelling of contemporary and future change, 393–436, Cambridge University Press, 2004.
30
Velicogna, I.: Increased rates of ice loss from Greenland and Antarctic ice sheets revealed by GRACE, Geophys. Res. Lett., 36, L195053, doi:10.1029/2009GL40222, 2009.
TCD
4, 767–786, 2010Spatially extensive estimates in annual
accumulation
S. de la Pe ˜na et al.
Title Page
Abstract Introduction
Conclusions References
Tables Figures
◭ ◮
◭ ◮
Back Close
Full Screen / Esc
Printer-friendly Version Interactive Discussion
Discussion
P
a
per
|
Dis
cussion
P
a
per
|
Discussion
P
a
per
|
Discussio
n
P
a
per
|
formation on the Greenland ice sheet, 2000–2004. J. Geophys. Res., 112, F04013, doi:10.1029/2007JF000760, 2007.
Wingham, D. J., Francis, C. R., Baker, S., Bouzinac, C., Brockley, D., Cullen, R., de Chateau-Thierry, P., Laxon, S. W., Mallow, U., Mavrocordatos, C., Phalippou, L., Ratier, G., Rey, L., Rostan, F., Viau, P., and Wallis, D. W.: A mission to determine the fluctuations in Earth’s land
5
and marine ice fields, Advances Space Res, 37, doi:10.1016/j.asr.2005.07.027, 2006. Wingham, D. J., Ridoutm, A. J., Scharroo, R., Arthern, R. J., and Schum, C. K.: Antarctic
elevation change from 1992 to 1996, Science, 282, 456–458, 1998.
Yankielun, N., Rosenthal, W., and Davis, R. E.: Alpine snow depth measurements from aerial FMCW radar, Cold Reg. Sci. Technol., 40, 123–134, 2004.
10
TCD
4, 767–786, 2010Spatially extensive estimates in annual
accumulation
S. de la Pe ˜na et al.
Title Page
Abstract Introduction
Conclusions References
Tables Figures
◭ ◮
◭ ◮
Back Close
Full Screen / Esc
Printer-friendly Version Interactive Discussion
Discussion
P
a
per
|
Dis
cussion
P
a
per
|
Discussion
P
a
per
|
Discussio
n
P
a
per
|
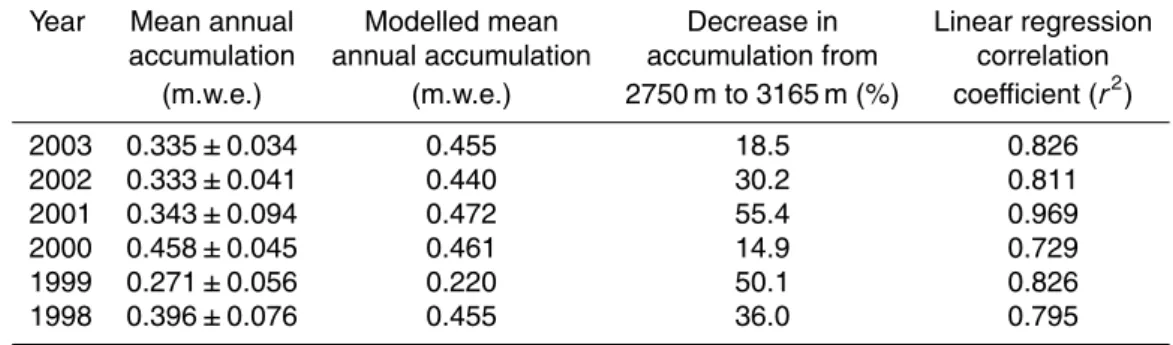
Table 1.Mean annual accumulation rates for the years 1998–2003. Values are in m.w.e.
Year Mean annual Modelled mean Decrease in Linear regression
accumulation annual accumulation accumulation from correlation
(m.w.e.) (m.w.e.) 2750 m to 3165 m (%) coefficient (r2)
2003 0.335±0.034 0.455 18.5 0.826
2002 0.333±0.041 0.440 30.2 0.811
2001 0.343±0.094 0.472 55.4 0.969
2000 0.458±0.045 0.461 14.9 0.729
1999 0.271±0.056 0.220 50.1 0.826
TCD
4, 767–786, 2010Spatially extensive estimates in annual
accumulation
S. de la Pe ˜na et al.
Title Page
Abstract Introduction
Conclusions References
Tables Figures
◭ ◮
◭ ◮
Back Close
Full Screen / Esc
Printer-friendly Version Interactive Discussion
Discussion
P
a
per
|
Dis
cussion
P
a
per
|
Discussion
P
a
per
|
Discussio
n
P
a
per
|
Table 2.Mean accumulation rates (in m.w.e.) estimated every 25 km.
Elevation 1998–2003 Fischer et al. Anklin et al. 1998–2003
(m) ASIRAS derived (1984–1989) (1977–1989) Modeled
2750 0.461±0.108 0.439±0.088 0.437±0.072 0.486±0.071
2810 0.442±0.080 − − 0.496±0.074
2870 0.418±0.078 0.385±0.065 0.402±0.049 0.483±0.069
2930 0.393±0.083 − − 0.457±0.062
2990 0.370±0.069 0.344±0.062 0.349±0.050 0.420±0.049
3050 0.342±0.083 − − 0.399±0.015
3090 0.322±0.059 − − 0.375±0.042
3110 0.307±0.063 0.250±0.035 0.249±0.022 0.350±0.037
TCD
4, 767–786, 2010Spatially extensive estimates in annual
accumulation
S. de la Pe ˜na et al.
Title Page
Abstract Introduction
Conclusions References
Tables Figures
◭ ◮
◭ ◮
Back Close
Full Screen / Esc
Printer-friendly Version Interactive Discussion
Discussion
P
a
per
|
Dis
cussion
P
a
per
|
Discussion
P
a
per
|
Discussio
n
P
a
per
|
60oW 45oW
30
oW
15 oW
60oN
65o N
70o N 75o
N 80oN
TCD
4, 767–786, 2010Spatially extensive estimates in annual
accumulation
S. de la Pe ˜na et al.
Title Page
Abstract Introduction
Conclusions References
Tables Figures
◭ ◮
◭ ◮
Back Close
Full Screen / Esc
Printer-friendly Version Interactive Discussion
Discussion
P
a
per
|
Dis
cussion
P
a
per
|
Discussion
P
a
per
|
Discussio
n
P
a
per
|
Distance along traverse (km)
Two−way travel time (ns)
0 25 50 75 100 125 150 175 200
0
10
20
30
40
50
60
70
80
90
100
Fig. 2.ASIRAS profiles showing the waveforms recorded over most of the dry region of the ice
TCD
4, 767–786, 2010Spatially extensive estimates in annual
accumulation
S. de la Pe ˜na et al.
Title Page
Abstract Introduction
Conclusions References
Tables Figures
◭ ◮
◭ ◮
Back Close
Full Screen / Esc
Printer-friendly Version Interactive Discussion
Discussion
P
a
per
|
Dis
cussion
P
a
per
|
Discussion
P
a
per
|
Discussio
n
P
a
per
|
(a)
Elevation (m)
2800 2900 3000 3100
Layer thickness (m)
0.4 0.6 0.8 1.0 1.2
2003 Layer 2002 Layer 2001 Layer 2000 Layer 1999 Layer 1998 Layer
(b)
elevation (m)
2800 2900 3000 3100
Accumulation (m.w.e.)
0.1 0.2 0.3 0.4 0.5 0.6
2003 Layer 2002 Layer 2001 Layer 2000 Layer 1999 Layer 1998 Layer
Fig. 3. Seven annual layers are identified corresponding to the annual accumulation for each
year from 1998 to 2004. Figure 3a show the thickness for each layer. For scaling purposes, the 2004 accumulation layer is omitted. Figure 3b show the annual snow accumulation estimates
TCD
4, 767–786, 2010Spatially extensive estimates in annual
accumulation
S. de la Pe ˜na et al.
Title Page
Abstract Introduction
Conclusions References
Tables Figures
◭ ◮
◭ ◮
Back Close
Full Screen / Esc
Printer-friendly Version Interactive Discussion
Discussion
P
a
per
|
Dis
cussion
P
a
per
|
Discussion
P
a
per
|
Discussio
n
P
a
per
|
0.1 0.2 0.3 0.4 0.5 0.6 0.7
2700 2800
2900 3000
3100 3200
1998 1999 2000 2001 2002 Accumulation (m.w.e.)
Elevation (m)
Accumulation Period
(b)
0.1 0.2 0.3 0.4 0.5 0.6 0.7