TCD
6, 1715–1738, 2012RADARSAT-2 observations of Central Antarctica
B. Scheuchl et al.
Title Page
Abstract Introduction
Conclusions References
Tables Figures
◭ ◮
◭ ◮
Back Close
Full Screen / Esc
Printer-friendly Version Interactive Discussion
Discussion
P
a
per
|
Dis
cussion
P
a
per
|
Discussion
P
a
per
|
Discussio
n
P
a
per
|
The Cryosphere Discuss., 6, 1715–1738, 2012 www.the-cryosphere-discuss.net/6/1715/2012/ doi:10.5194/tcd-6-1715-2012
© Author(s) 2012. CC Attribution 3.0 License.
The Cryosphere Discussions
This discussion paper is/has been under review for the journal The Cryosphere (TC). Please refer to the corresponding final paper in TC if available.
Twelve years of ice velocity change in
Antarctica observed by RADARSAT-1 and
-2 satellite radar interferometry
B. Scheuchl1, J. Mouginot1, and E. Rignot1,2
1
University of California Irvine, Department of Earth System Science, Irvine, California, USA
2
Jet Propulsion Laboratory, Pasadena, California, USA
Received: 13 April 2012 – Accepted: 29 April 2012 – Published: 15 May 2012
Correspondence to: B. Scheuchl ([email protected])
TCD
6, 1715–1738, 2012RADARSAT-2 observations of Central Antarctica
B. Scheuchl et al.
Title Page
Abstract Introduction
Conclusions References
Tables Figures
◭ ◮
◭ ◮
Back Close
Full Screen / Esc
Printer-friendly Version Interactive Discussion
Discussion
P
a
per
|
Dis
cussion
P
a
per
|
Discussion
P
a
per
|
Discussio
n
P
a
per
|
Abstract
We report changes in ice velocity of a 6.5 million km2region around South Pole encom-passing the Ronne/Filchner and Ross Ice Shelves and a significant portion of the ice streams and glaciers that constitute their catchment areas. Using the first full interfero-metric synthetic-aperture radar (InSAR) coverage of the region completed in 2009 and
5
partial coverage acquired in 1997, we process the data to assemble a comprehensive map of ice velocity changes with a nominal precision of detection of±3–4 m yr−1. The largest observed changes, an increase in speed of 100 m yr−1 in 12 yr, are near the frontal regions of the large ice shelves and are associated with the slow detachment of large tabular blocks that will eventually form icebergs. On the Ross Ice Shelf, our data
10
reveal a slow down of Mercer and Whillans Ice Streams with a 12 yr velocity difference of 50 m yr−1 (16.7 %) and 100 m yr−1 (25.3 %) at their grounding lines. The slow down spreads 450 km upstream of the grounding line and more than 500 km onto the shelf, i.e., far beyond what was previously known. Also slowing in the Ross Ice Shelf sector are MacAyeal Ice Stream and Byrd Glacier with a 12 yr velocity difference near their
15
grounding lines of 30 m yr−1 (6.7 %) and 35 m yr−1 (4.1 %), respectively. Bindschadler Ice Stream is faster by 20 m yr−1(5 %). Most of these changes in glacier speed extend on the Ross Ice Shelf along the ice streams’ flow lines. At the mouth of the Filch-ner/Ronne Ice Shelves, the 12 yr difference in glacier speed is below the 8 % level. We detect the largest slow down with a 12 yr velocity difference of up to 30 m yr−1 on
20
Slessor and Recovery Glaciers, equivalent to 6.7 % and 3.3 %, respectively. Founda-tion Ice Stream shows a modest speed up (30 m yr−1or 5 %). No change is detected on Bailey, Rutford, and Institute Ice Streams. On the Filchner Ice Shelf proper, ice slowed down rather uniformly with a 12 yr velocity difference of 50 m yr−1, or 5 % of its ice front speed, which we attribute to an 12 km advance in its ice front position. Overall,
25
TCD
6, 1715–1738, 2012RADARSAT-2 observations of Central Antarctica
B. Scheuchl et al.
Title Page
Abstract Introduction
Conclusions References
Tables Figures
◭ ◮
◭ ◮
Back Close
Full Screen / Esc
Printer-friendly Version Interactive Discussion
Discussion
P
a
per
|
Dis
cussion
P
a
per
|
Discussion
P
a
per
|
Discussio
n
P
a
per
|
1 Introduction
Ice velocity is crucial information for estimating the mass balance of glaciers and ice sheets and for studying ice dynamics. Satellite information has fundamentally changed the way velocity information is collected today. Firstly, Global Positioning System (GPS) has simplified the way ground measurements are made, allowing for high precision
5
measurements of key areas at dense temporal spacing. For detailed analyses of spe-cific motion patterns (i.e. Bindschadler et al., 2003), field measurements continue to be vital in glaciology (e.g. Aðalgeirsd ´ottir et al., 2008). Secondly, spaceborne remote
sensing satellites are a means to measure ice velocity without the necessity of ground campaigns. They allow data collection over vast areas, thereby providing information
10
that would be practically impossible to collect in the field. Since the launch of the Euro-pean ERS satellites in the early 1990’s, spaceborne Interferometric Synthetic Aperture Radar (InSAR) data have become the single most important means of measuring ice velocity. Projects and area coverage have evolved from single glaciers, over ice fields to most recently covering the vast ice sheets of Greenland and Antarctica (Rignot et al.,
15
2011b; Joughin et al., 2011). InSAR satellite data coverage in Central Antarctica re-mains sparse. The first complete interferometric mapping campaign covering South Pole took place in 2009 as part of a coordinated acquisition campaign for the Interna-tional Polar Year (IPY) (Jezek and Drinkwater, 2008).
In this paper, we present a new ice velocity map and a grounding line map based on
20
RADARSAT-2 InSAR data collected in fall 2009. We revisit and re-calibrate the InSAR data collected by RADARSAT-1 in 1997. A difference map is created using the two data sets to reveal for the first time changes in speed over a vast extent of Central Antarctica in the 12 yr interim. After exposing the details of the data processing, we discuss the changes observed along Siple Coast and the Filchner/Ronne sectors and conclude on
25
TCD
6, 1715–1738, 2012RADARSAT-2 observations of Central Antarctica
B. Scheuchl et al.
Title Page
Abstract Introduction
Conclusions References
Tables Figures
◭ ◮
◭ ◮
Back Close
Full Screen / Esc
Printer-friendly Version Interactive Discussion
Discussion
P
a
per
|
Dis
cussion
P
a
per
|
Discussion
P
a
per
|
Discussio
n
P
a
per
|
2 Data
We use InSAR data from the 1997 RADARSAT-1 Antarctic Mapping Mission (AMM) and the 2009 RADARSAT-2 mapping campaign. Imaging of South Pole requires left looking capability, which 1 used in experimental mode in 1997 and RADARSAT-2 is able to use operationally since RADARSAT-2008. Most other SAR sensors are right looking,
5
hence pointing away from South Pole and leaving a coverage gap that is sensor de-pendent but typically south of 80◦S. More recently, TerraSAR-X has added capabilities in left looking mode that are being explored (Floricioiu and Jezek, 2009) but the area coverage provided by this radar is not as comprehensive as RADARSAT-1/2.
In 1997, RADARSAT-1 underwent a special orbit maneuver to switch to left looking
10
mode. Most of the campaign was devoted to radar amplitude mapping of Antarctica, with a number of interferometric pairs acquired after that in a test mode, with only one interferometric pair along each track. The limited data collect in combination with short data strips made data processing and mosaicking difficult, but a map of Siple Coast ice streams was successfully generated using these data, complemented with other ice
15
velocity measurements (Joughin et al., 2002).
The first, and so far only, complete interferometric data coverage of Central Antarc-tica with interferometric SAR data was achieved using RADARSAT-2 in left looking mode in fall 2009 with a limited gap filler campaign to complete the mapping in spring 2011 (Crevier et al., 2010). During the International Polar Year (IPY 2007–2008), the
20
contributions of four space agencies were coordinated by the IPY Space Task Group (STG) (Jezek and Drinkwater, 2008). One goal of STG was to achieve pole-to-pole InSAR coverage of the ice sheets. For Antarctica, standard right looking data cover-ing the coast to about 80◦ South were acquired by the Japanese ALOS PALSAR and the European Envisat ASAR. The Canadian Space Agency committed to fill the region
25
TCD
6, 1715–1738, 2012RADARSAT-2 observations of Central Antarctica
B. Scheuchl et al.
Title Page
Abstract Introduction
Conclusions References
Tables Figures
◭ ◮
◭ ◮
Back Close
Full Screen / Esc
Printer-friendly Version Interactive Discussion
Discussion
P
a
per
|
Dis
cussion
P
a
per
|
Discussion
P
a
per
|
Discussio
n
P
a
per
|
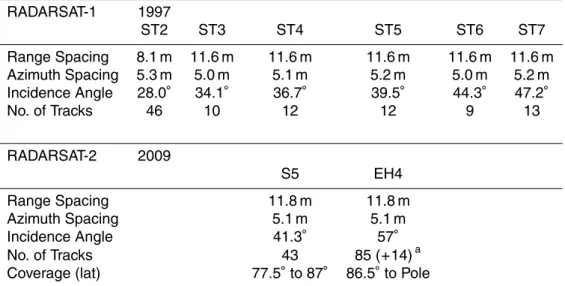
Careful planning was required to avoid conflicts and maintain sensor health (Morena et al., 2004). To cover the entire area, two different modes were combined: (1) 85 tracks in Standard 5 mode for the region between 78◦to 87◦S; and (2) 43 tracks in Extended High 4 mode for South Pole and vicinity. Three consecutive orbits were acquired along each track to enable the generation of two 24 day interferograms per track.
Acquisi-5
tions were planned with a small overlap region between the ground coverage of the two modes. Residual coverage gaps caused by acquisition conflicts during the 2009 campaign were closed with a gap filler campaign that took place in Spring 2011. Ta-ble 1 summarizes the RADARSAT-1 and -2 data collected and used in this study.
3 Methods
10
The RADARSAT-1 and -2 interferometric data allows the extraction of ice surface ve-locity (1997 and 2009) and grounding line position (2009 only).
3.1 Velocity measurements
Two dimensional ice velocity is extracted assuming surface parallel flow from a combi-nation of speckle tracking and interferometric analysis (Michel and Rignot, 1999; Rignot
15
et al., 2011b). In areas where phase unwrapping is successful, the unwrapped inter-ferometric phase is used in range instead of range offsets from speckle tracking. Since three data cycles are available in 2009, we generate two velocity products per track and combine them to reduce data noise.
3.1.1 Tide correction
20
TCD
6, 1715–1738, 2012RADARSAT-2 observations of Central Antarctica
B. Scheuchl et al.
Title Page
Abstract Introduction
Conclusions References
Tables Figures
◭ ◮
◭ ◮
Back Close
Full Screen / Esc
Printer-friendly Version Interactive Discussion
Discussion
P
a
per
|
Dis
cussion
P
a
per
|
Discussion
P
a
per
|
Discussio
n
P
a
per
|
oceanic tides, i.e. hours to days (Rignot et al., 2000). A second tidal modulation is a potential variation of the horizontal rate of motion with tides due to small changes in buttressing and driving stress forces on the ice shelves (Bamber et al., 2007). For the vertical component, the error amounts to 37 m yr−1in speed (at 28◦incidence angle of the radar illumination away from the vertical direction) per 1 m tide change between
in-5
terferometric data acquisitions. Such an error is small compared to the absolute value of ice shelf velocities (or 1 km yr−1), but is large when examining temporal changes in ice velocity.
Here, we use the CATS2008a opt tide model (Padman et al., 2008) and the TPXO6.2 load model (Egbert and Erofeeva, 2002) to estimate vertical position above the ellipsoid
10
for each data point on ice shelves at the different acquisition times of RADARSAT-1 and 2. The corresponding elevation difference between epochs is converted into a range displacement which is subtracted from the range offsets obtained from speckle tracking – or the interferometric phase – before converting these displacements into ice velocity (Mouginot et al., 2012). The precision of the tidal model is estimated at±5.4 cm vertical
15
displacement based on a comparison with 16 independent tide records at or near Ross Ice Shelf (Padman et al., 2008), the root-mean-square residual magnitudes for the four main tidal constituents for the load model are between±2.2 and±3.8 cm (Egbert and Erofeeva, 2002).
3.1.2 Velocity calibration
20
A critical step in data processing is the absolute calibration of the velocity data. This task is rendered difficult if coast-to-coast acquisitions are absent or control points of known (or zero) velocity are not known a priori. This is one of the reasons why only a few 1997 InSAR data could be analyzed in prior studies. The recent assembling of a map of Antarctica that employs coast to coast tracks and provides a comprehensive
25
TCD
6, 1715–1738, 2012RADARSAT-2 observations of Central Antarctica
B. Scheuchl et al.
Title Page
Abstract Introduction
Conclusions References
Tables Figures
◭ ◮
◭ ◮
Back Close
Full Screen / Esc
Printer-friendly Version Interactive Discussion
Discussion
P
a
per
|
Dis
cussion
P
a
per
|
Discussion
P
a
per
|
Discussio
n
P
a
per
|
control points for the 1997 mosaic. A few tracks are calibrated using these control points. To continue the process, new tracks are added in the calibration and mosaick-ing by usmosaick-ing ice velocity from overlappmosaick-ing calibrated tracks (hence non-zero velocity), effectively increasing the number of control points and propagating the calibration pro-cess across the entire surveyed domain to obtain a consistent calibration scheme. With
5
this approach, we calibrate and mosaic together 102 pairs of RADARSAT-1 data from 1997, leaving out only a few pairs with poor correlation levels. Great care is applied in the calibration and mosaicking processes to yield high quality change detection prod-ucts. A high quality 1997 map for change detection cannot be assembled using the RADARSAT-1 1997 data alone. Similarly, the calibration and mosaicking of the
com-10
plex ensemble of Extended High 4 and Standard 5 mode RADARSAT-2 data around South Pole in 2009 cannot be done at a comparable level of precision without the help of overlapping, coast-to-coast tracks from Envisat ASAR and ALOS PALSAR (Mouginot et al., 2012).
3.2 Velocity difference estimate
15
The generation of velocity difference maps requires special care during processing of individual velocity maps because data noise must be minimized to increase the ability to detect subtle changes in speed. Track boundaries are critical areas where calibration or mosaicking errors become visible in difference maps but not necessarily in the original velocity maps if the calibration and mosaicking was not effected in the best manner.
20
Here, we expect identical measurements between overlapping adjacent tracks because the measurements are collected with a time separation of 24 days, hence effectively calculating an average velocity over that time period that smoothes out shorter-time scale fluctuations, for instance associated with tides. In addition, the data collection extended only over 3 months, which minimizes the impact of long-term changes on the
25
TCD
6, 1715–1738, 2012RADARSAT-2 observations of Central Antarctica
B. Scheuchl et al.
Title Page
Abstract Introduction
Conclusions References
Tables Figures
◭ ◮
◭ ◮
Back Close
Full Screen / Esc
Printer-friendly Version Interactive Discussion
Discussion
P
a
per
|
Dis
cussion
P
a
per
|
Discussion
P
a
per
|
Discussio
n
P
a
per
|
analysis of velocity differences on ice shelves. The 1997 and 2009 velocity maps were progressively revised together, in an iterative fashion, to minimize track boundaries. The resulting 1997 map covers more area compared to prior mappings as additional tracks were included in the mapping.
Looking at stagnant areas throughout our study area (more than 77 000 data points
5
were used in Siple Dome, Raymond Ice Ridge, Central Antarctica North of Titan Dome, and Pecora Escarpment near Foundation Ice Stream), we find a 1-sigma variation of the velocity difference of±2.8 m yr−1. The corresponding 2009 velocity variation over the area is±1.8 m yr−1; the 1997 velocity variation is±2.3 m yr−1(higher because fewer overlapping tracks are available for the 1997 data). We conclude that the precision of
10
velocity mapping is about ±2–3 m yr−1; and the precision of detection of changes in speed is about ±3–4 m yr−1 for the 12 yr period. These are nominal errors. Locally, errors may exceed these values.
3.3 Grounding line detection
The grounding line (GL) is the transition boundary where ice detaches from the bed to
15
become afloat in the ocean. Knowledge of the exact location of the grounding line is crucial for ice sheet mass balance calculations, ice sheet modeling, and the analysis of ice-ocean interactions (Rignot et al., 2011a). An ice shelf flaps up and down with changes in the oceanic tide. This vertical motion is detected directly using differential InSAR – DInSAR – at a precision of millimeters, i.e. orders of magnitude better than
20
laser altimetry (±10–20 cm) or even kinematic GPS (a few cm) (Rignot, 1998).
The 2009 RADARSAT-2 AMM includes three consecutive cycles per track. This ac-quisition strategy makes it possible to generate two interferograms per track spanning the same time difference (24 days or one cycle), which we then difference to detect tidal motion and map grounding line position. The RADARSAT-2 DInSAR data set
rep-25
TCD
6, 1715–1738, 2012RADARSAT-2 observations of Central Antarctica
B. Scheuchl et al.
Title Page
Abstract Introduction
Conclusions References
Tables Figures
◭ ◮
◭ ◮
Back Close
Full Screen / Esc
Printer-friendly Version Interactive Discussion
Discussion
P
a
per
|
Dis
cussion
P
a
per
|
Discussion
P
a
per
|
Discussio
n
P
a
per
|
surface slope, aspect, or visible features, the DInSAR approach is a direct measure-ment of the grounding line position. Grounding line mapping cannot be done using InSAR data from 1997 because these data do not include repeat pairs. Methods using phase coherence to map grounding lines do not detect the grounding line per se but the outer limit of tidal flexing instead, which is typically several km seaward of the actual
5
grounding line. This was demonstrated in the case of Evans Ice Stream in (Rignot et al., 2011a). The offset between these two positions is equivalent to the width of the flexure zone, which is not a constant. The width of the flexure zone varies with ice thickness and also with the tidal cycle because of the visco-elastic nature of the deformation. It is therefore not possible to compare the 1997 and 2009 mappings at this time with high
10
confidence. The 2009 grounding line will however serve as a reference for measuring future changes.
4 Results
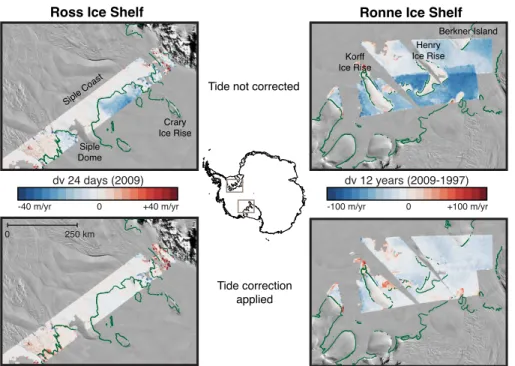
Figure 1 shows the impact of our tide correction on data quality and track to track boundary. Without tide correction, it would not be possible to detect changes in ice
15
shelf velocity in our study area, because the actual signal is comparable in magnitude to the tidal modulation. We find that the tide estimates from the Padman model are of sufficient quality to implement a tide correction that eliminates patch boundary be-tween tracks on the ice shelf as well as inconsistencies bebe-tween overlapping tracks acquired at different times. This demonstrates that the tidal signal is removed eff
ec-20
tively, consistently and accurately in our data. A few notable exceptions exist where the tidal correction is questionable. For instance near the grounding line of Slessor Glacier and Bailey Ice Stream (see Figs. 2c and 4), we detect a residual signal which is not spatially consistent with the signal recorded in the surrounding areas, including on grounded ice, which suggests that the tidal correction is in error. Looking at this
prob-25
TCD
6, 1715–1738, 2012RADARSAT-2 observations of Central Antarctica
B. Scheuchl et al.
Title Page
Abstract Introduction
Conclusions References
Tables Figures
◭ ◮
◭ ◮
Back Close
Full Screen / Esc
Printer-friendly Version Interactive Discussion
Discussion
P
a
per
|
Dis
cussion
P
a
per
|
Discussion
P
a
per
|
Discussio
n
P
a
per
|
line (Rignot et al., 2011a). The MOA-based grounding line is about the same as the DInSAR grounding line for Bailey Ice Stream, but some ice rises in the mouth of Bai-ley Ice Stream are not accounted for in the MOA-based product. A large difference between MOA-based and DInSAR based grounding lines occurs on Slessor Glacier. There, the MOA-based grounding line is 150 km too far inland from its actual location
5
detected with DInSAR (see Fig. 4). We may ignore tide model results upstream of the DInSAR groundling line for Slessor Glacier but this is not sufficient to explain resid-ual errors (see Fig. 4). In addition, recent observations from instrumented mammals suggest that the sub-ice-shelf cavity at that location is deeper than previously thought, which is another source of error in the tidal predictions (Padman, pers. comm.). This
10
example illustrates that a precise knowledge of the grounding line position and depth of the sea floor are critical for estimating tidal motion beneath ice shelves and for de-tecting long-term, subtle changes in ice shelf velocity with InSAR.
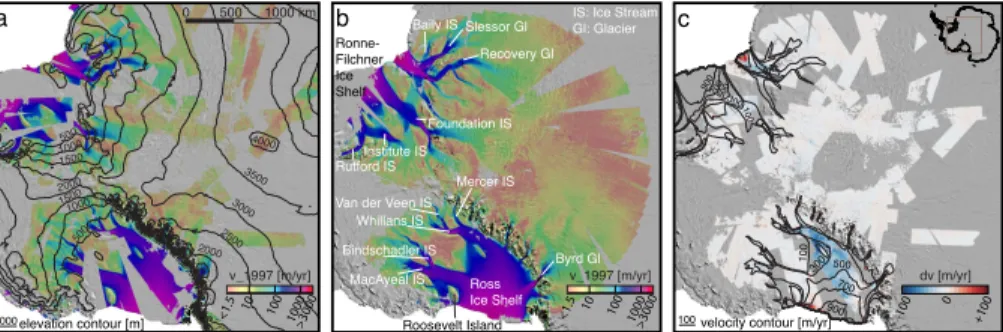
Figure 2 shows the surface velocity product for 1997 (Fig. 2a) and 2009 (Fig. 2b) overlaid on the MODIS mosaic of Antarctica or MOA (Haran et al., 2005). The 1997
15
coverage is the first interferometric coverage of the region that is presented to its full extent, with improved calibration. Prior analysis of the 1997 data were focused on the Ross Ice Shelf sector, with a mix of InSAR and non-InSAR data (Joughin et al., 2002, 2005). Our map includes a partial coverage of the Filchner-Ronne sector. The 2009 map is nearly complete, with residual gaps in West Antarctica caused by the
system-20
atically poor levels of temporal coherence of the InSAR signal (Rignot et al., 2011b). The difference map (Fig. 2c) reveals many interesting features, which we will now discuss. Most notable is a widespread slow down on Ross Ice Shelf and Mercer and Whillans Ice Streams (formerly known as Ice Streams A and B). This slow down – early reports date back to Thomas (1976) – was studied in more detail at discrete
25
TCD
6, 1715–1738, 2012RADARSAT-2 observations of Central Antarctica
B. Scheuchl et al.
Title Page
Abstract Introduction
Conclusions References
Tables Figures
◭ ◮
◭ ◮
Back Close
Full Screen / Esc
Printer-friendly Version Interactive Discussion
Discussion
P
a
per
|
Dis
cussion
P
a
per
|
Discussion
P
a
per
|
Discussio
n
P
a
per
|
Ice Stream), and affects all the tributaries of these ice streams up to their presumed source, i.e. where the ice motion signal meets our noise floor. Prior studies reported on limited discrete points up to 400 km upstream for Whillans Ice Stream and 150 km upstream for Mercer Ice Stream. Our result also shows the extent of the slow down reaching more than 500 km onto Ross Ice Shelf, an indication that the signatures of
5
the ice stream changes determine the regional velocity changes on the shelf.
At the northwestern edge of the Ross Ice Shelf, we observe a zone of speed up that coincides with a portion of the ice shelf that is about to detach and form a tab-ular iceberg. The velocity difference between the two epochs exceeds 100 m yr−1, though the main difference most likely results from the pre-calving event that
hap-10
pened past 1997. A similar pre-calving event is detected along the northeastern front of the Filchner Ice Shelf, where the velocity difference between 1997 and 2009 also exceeds 100 m yr−1. Locally, velocity differences between stable shelf portions and fast blocks reach 150 m yr−1. Wide cracks are observable in the respective radar amplitude imagery at the transition boundary between speed up and no speed up for both
ar-15
eas, which justifies our labeling of these areas as pre-detached. These two pre-calving events represent the largest changes in speed in our map. Outside of these areas of speed up and the widespread slow down of the Mercer an Whillans Ice Streams, most of the other observed changes are small in magnitude, i.e. at the 10–20 m yr−1 level over 12 yr versus absolute speeds in the range of several hundred meters per year
20
(Fig. 2), i.e. at the percent level. This means that we observe little change in speed of the glaciers and ice shelves between the two dates.
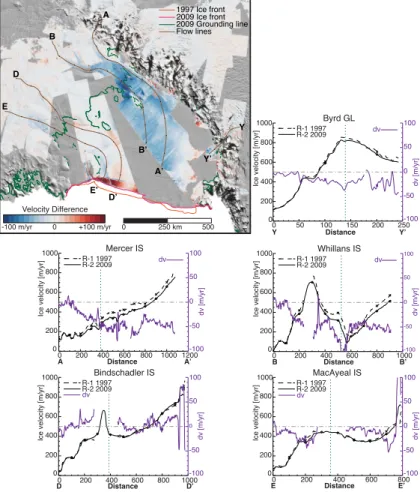
Figure 3 shows a more detailed analysis for the Ross Ice Shelf region. The map shows the 12 yr velocity difference overlaid on the MOA, the 2009 grounding line, as well as the 1997 and 2009 ice fronts. In addition, MOA provides information on the
25
TCD
6, 1715–1738, 2012RADARSAT-2 observations of Central Antarctica
B. Scheuchl et al.
Title Page
Abstract Introduction
Conclusions References
Tables Figures
◭ ◮
◭ ◮
Back Close
Full Screen / Esc
Printer-friendly Version Interactive Discussion
Discussion
P
a
per
|
Dis
cussion
P
a
per
|
Discussion
P
a
per
|
Discussio
n
P
a
per
|
velocity difference, dv, we provide the velocity difference in % of the glacier speed at
the grounding line in the text below to provide some context for each glacier. Our re-sults show that Byrd Glacier slowed down slightly with a 12 yr velocity difference of less than 35 m yr−1 or 4.1 % at the grounding line. The slow down extends roughly 100 km upstream of the grounding line and decreases with distance. For comparison, Mercer
5
and Whillans Ice Streams experience a more significant slow down. Their 12 yr velocity difference near the grounding line is up to 50 m yr−1 (16.7 %) and 100 m yr−1 (25.3 %), respectively. Most likely, as a result of slow down and thickening, their grounding line must have migrated downstream between 1997 and 2009. The decrease in speed in-creases from the interior toward the grounding zone, to peak at the grounding line and
10
subsequently remains fairly constant on the ice shelf (with dv at about 50 m yr−1).
Bind-schadler Ice Stream displays a modest speed up near the grounding line region, which is only partially covered in our data (dv up to 20 m yr−1 or 5 %). A speed up can be
traced up to about 200 km upstream of the grounding line. I contrast, MacAyeal Ice Stream slowed down slightly between 1997 and 2009 with a 12 yr velocity difference
15
of up to 30 m yr−1or 6.7 %). Here, the slow down (dv between 10 m yr−1and 30 m yr−1)
can be traced to about 300 km upstream of the grounding line. The respective velocity difference pattern on the western portion of Ross Ice Shelf is determined by these two ice streams and is different from the pattern on the eastern half which is determined by Whillans and Mercer Ice Stream change signatures.
20
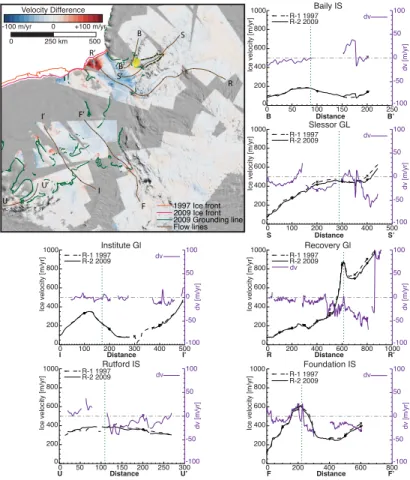
Figure 4 shows detail for the Ronne-Filchner Ice Shelf. The 1997 coverage is less extensive compared to Ross Ice Shelf. A more complete map by Joughin and Padman (2003) mixes data from 1997 and 2000 and is not used here. The DInSAR grounding line is shown in green. For Slessor Glacier, we also indicate the erroneous MOA-based grounding line (yellow/black dashed line) discussed earlier. In the region indicated by
25
TCD
6, 1715–1738, 2012RADARSAT-2 observations of Central Antarctica
B. Scheuchl et al.
Title Page
Abstract Introduction
Conclusions References
Tables Figures
◭ ◮
◭ ◮
Back Close
Full Screen / Esc
Printer-friendly Version Interactive Discussion
Discussion
P
a
per
|
Dis
cussion
P
a
per
|
Discussion
P
a
per
|
Discussio
n
P
a
per
|
speed is larger. The 12 yr velocity difference is up to 30 m yr−1, equivalient to 6.7 % and 3.3 % for Slessor and Recovery Glaciers, respectively. This slow down is confined to within 100 km upstream of the grounding line region in the case of Recovery but more pervasive over a vast area for Slessor. The flow line for Foundation Ice Stream shows a spike in speed change near the grounding line, which may indicate residual errors in
5
tide correction. Even with this uncertainty present, the data reveal velocity increase at the grounding line (dv less than 30 m yr−1 or 5 %). We detect only a small slow down
on Institute Ice Stream, i.e., dv of less than 10 m yr−1or 5 %. Coverage of Rutford Ice
Stream is spotty, particularly around the grounding line. The velocity difference over 12 yr upstream of the grounding line indicates a higher speed in 2009 (dv up to about
10
15 m yr−1, or 3.8 %).
On the Filchner/Ronne Ice Shelves proper, we detect a widespread and spatially rel-atively uniform slow down. The 12 yr velocity difference reaches 50 m yr−1 for Filchner Ice Shelf, or 5 % of its ice front speed. The observed region on Ronne Ice Shelf is small and mainly covers the area around Korffand Henry Ice Rise. The 12 yr velocity
15
difference is about 30 m yr−1 or 7.5 % of the Ice Shelf velocity in the area. We note here that because our InSAR data combine data acquired 24-day apart, we are not sensitive to transitory signals occurring at much lower temporal frequencies. Further-more, because our mosaic combines many tracks acquired at different times and for different tidal modulation, we are quite sure that the changes in speed detected on the
20
ice shelves are not tidal related. If they were, it would be impossible to mosaic the data together correctly, especially at patch boundaries. The signal observed on the ice shelf therefore represents a true change in overall speed between the two epochs.
5 Discussion
The velocity of Rutford Ice Stream is influenced by oceanic tides (Gudmundsson, 2006;
25
Aðalgeirsd ´ottir et al., 2008). The relationship is complex, with diurnal and fortnightly
TCD
6, 1715–1738, 2012RADARSAT-2 observations of Central Antarctica
B. Scheuchl et al.
Title Page
Abstract Introduction
Conclusions References
Tables Figures
◭ ◮
◭ ◮
Back Close
Full Screen / Esc
Printer-friendly Version Interactive Discussion
Discussion
P
a
per
|
Dis
cussion
P
a
per
|
Discussion
P
a
per
|
Discussio
n
P
a
per
|
period of 24 days is larger than one periodicity, there is potential for residual tidal in-fluence on the change map. The measured changes in speed over 12 yr are less than 5 % of the absolute velocity, with slight speed up upstream of the grounding line and slight slow down downstream. This pattern is suggestive of residual uncertainties in tidal correction rather than a real change in ice dynamics. Tidal errors could be due
5
to inaccurate estimates of the depth of the sea floor in the sub-ice-shelf cavity. The residual signal is small however, it does not extend into the grounded part of the ice stream, which suggests that Rutford Ice Stream did not change speed between the 1997 and 2009 surveys at a detectable level. This is consistent with earlier studies that revealed stable grounding line positions (Rignot, 1998), no change in ice surface
10
elevation (Pritchard et al., 2009) and a mass budget close to zero (Rignot et al., 2008). Recovery and Slessor Glaciers are exhibiting the largest slow down (when expressed in velocity difference) in the Filchner/Ronne sector. The impact of this slow down on grounding line fluxes is at the percent level, or less than 1 Gt yr−1, which is negligible compared to the mass budget of the entire region. In a recent study, Pritchard et al.
15
(2009) detect a slight thickening of Slessor Ice Stream, which is consistent with our report of a more extensive area of slight slow down. No thickening is apparent in the altimetry data from Recovery Ice Stream, which is consistent with slight changes in speed being confined closer to the grounding line region in our data.
On the Filchner Ice Shelf, the magnitude of the slow down is real, but small with a 12
20
yr velocity difference at the 50 m yr−1level versus ice shelf speeds of up to 1000 m yr−1. Between 1997 and 2009, the ice front advanced by about 12 km (see Fig. 4), which increased side shear and would explain the slow down. This aspect needs to be con-firmed with model simulations.
On Ronne, multiple iceberg calving events caused a retreat of the ice front between
25
TCD
6, 1715–1738, 2012RADARSAT-2 observations of Central Antarctica
B. Scheuchl et al.
Title Page
Abstract Introduction
Conclusions References
Tables Figures
◭ ◮
◭ ◮
Back Close
Full Screen / Esc
Printer-friendly Version Interactive Discussion
Discussion
P
a
per
|
Dis
cussion
P
a
per
|
Discussion
P
a
per
|
Discussio
n
P
a
per
|
On Ross Ice Shelf sector, Pritchard et al. (2009) report thickening of stagnant Kamb Ice Stream at 60 cm yr−1, but thinning of Whillans and Mercer Ice Streams at 20 cm yr−1. The latter is opposite to what we expect for ice stream slow down. The observed thin-ning must therefore be related to changes in surface mass balance. Indeed, an analysis for the time period 1995–2003 revealed a decrease in snowfall during that time period
5
that may have caused an average decrease in surface elevation of 6 cm yr−1 (Helsen et al., 2008). A similar analysis should be pursued for the 1997–2009 time period.
Byrd Glacier velocities are affected by tides and the drainage of sub-glacial lakes. A 10 % speed up was observed between 2005 and 2007 as a result of sub-glacier drainage (Stearns et al., 2008). The authors show a 48 yr record of ice velocity that
10
reveals no changes in speed along the main trunk of Byrd between 1960 and 2005. The velocity record prior to 2000 is sparse, so a surge cycle may be possible but has not been observed. The 2009 velocities of Byrd Glacier (See Fig. 3, Byrd flow line) are consistent with the pre-surge values (Stearns et al., 2008). We conclude that despite the existence of a mini surge between 2005 and 2007, Byrd Glacier continues
15
to maintain a rather steady flow regime over the last few decades.
The slow down of Whillans and Mercer Ice Streams was analyzed using an earlier, partial version of the 1997 map, combined with ground measurements from different years (Joughin et al., 2002, 2005). Our analysis shows a general agreement of the mean annual deceleration for the trunk of Whillans Ice Stream but an increased rate of
20
slow down at the grounding line near Crary Ice Rise for our observation period com-pared to pre-1990 ground measurements. A more detailed shelf-wide comparison of the 2009 velocity map with pre-1990 ground measurements will be discussed else-where (Thomas et al., 2012).
6 Conclusions
25
TCD
6, 1715–1738, 2012RADARSAT-2 observations of Central Antarctica
B. Scheuchl et al.
Title Page
Abstract Introduction
Conclusions References
Tables Figures
◭ ◮
◭ ◮
Back Close
Full Screen / Esc
Printer-friendly Version Interactive Discussion
Discussion
P
a
per
|
Dis
cussion
P
a
per
|
Discussion
P
a
per
|
Discussio
n
P
a
per
|
and provides ice motion results with a precision of ±2–3 m yr−1 on average and de-tection of changes in speed with a precision of about ±3–4 m yr−1. Our change map provides new, important information about the evolution of this sector of Antarctica, or lack thereof. Filchner and Ross Ice Shelves exhibit signs of pre-calving events.
Other than those, the Filchner/Ronne sector shows few changes, with most ice
5
streams slowing down slightly. The 12 yr velocity difference for all glaciers and ice streams in the region is below 8 %, which is of little consequence for the overall mass budget of the region. The most distinct signal, however, is a slight slow down of the Filchner Ice Shelf, consistent with an ice shelf advance, and a small slow down of Slessor Glacier over a large sector that warrants further study. On the Ross Ice Shelf,
10
we confirm the slow down of Mercer and Whillans Ice Stream, with a 12 yr velocity dif-ference of 16.7 % and 25.3 %, respectively. Our change map shows, for the first time, the entire spatial extent of the change. The slow down, extends hundreds of km up-stream and onto the shelf. Regional variations in velocity changes on Ross Ice Shelf proper are defined by the ice streams and glaciers that constitute its catchment area.
15
Overall, however, the observed changes have little impact on the mass balance of the region. We therefore conclude that in contrast with their counterparts in the Amundsen and Bellingshausen Seas (Rignot et al., 2008) the ice streams and ice shelves in the broad region under investigation herein have not been changed in a significant way in the past 12 yr, which suggests that the ice dynamics of the entire region does not have
20
a strong impact on the mass budget of the Antarctic continent.
Acknowledgements. The authors wish to thank Mr. Yves Crevier (Canadian Space Agency) for
championing the 2009 RADARSAT-2 AMM and for his support in filling remaining coverage gaps in 2011. Mr. Gord Rigby and Mr. Thomas Logan from MDA were instrumental in planning and executing RADARSAT-2 data acquisitions. RADARSAT-1 data were provided by ASF. Dr. Lau-25
TCD
6, 1715–1738, 2012RADARSAT-2 observations of Central Antarctica
B. Scheuchl et al.
Title Page
Abstract Introduction
Conclusions References
Tables Figures
◭ ◮
◭ ◮
Back Close
Full Screen / Esc
Printer-friendly Version Interactive Discussion
Discussion
P
a
per
|
Dis
cussion
P
a
per
|
Discussion
P
a
per
|
Discussio
n
P
a
per
|
References
Aðalgeirsd ´ottir, G., Smith, A. M., Murray, T., King, M. A., Makinson, K., Nicholls, K. W., and
Behar, A. E.: Tidal influence on Rutford Ice Stream, West Antarctica: observations of surface flow and basal processes from closely spaced GPS and passive seismic stations, J. Glaciol., 54, 715–724, doi:10.3189/002214308786570872, 2008. 1717, 1727
5
Bamber, J. L., Alley, R. B., and Joughin, I.: Rapid response of modern day ice sheets to ex-ternal forcing, Earth Planet. Sc. Lett., 257, 1–13, doi:10.1016/j.epsl.2007.03.005, available online: http://www.sciencedirect.com/science/article/pii/S0012821X07001628, last access: May 2012, 2007. 1720
Bindschadler, R. A., Vornberger, P. L., King, M. A., and Padman, L.: Tidally-driven stick-10
slip motion in the mouth of Whillans Ice Stream, Antarctica, Ann. Glaciol., 36, 263–272, doi:10.3189/172756403781816284, 2003. 1717
Crevier, Y., Drinkwater, M., and Jezek, K.: IPY-STG SAR coordination group synopsis and lessons learned, Polar Science – Global Impact, International Polar Year Oslo Science Con-ference, 8–12 June 2010, Oslo, Norway. Oslo, Research Council of Norway, IPY-OSC Sec-15
retariat, Abstract 382880, 2010. 1718
Egbert, G. D. and Erofeeva, S. Y.: Efficient inverse modeling of barotropic ocean tides, J. Atmos. Ocean. Tech., 19, 183–204, http://dx.doi.org/10.1175/1520-0426(2002)019h0183:EIMOBOi
2.0.CO;2, 2002. 1720
Floricioiu, D. and Jezek, K.: International viewpoint and news – Antarctica during the 20
IPY: TerraSAR-X images the Recovery Glacier System, Environ. Geol., 58, 457–458, doi:10.1007/s00254-009-1743-4, 2009. 1718
Gudmundsson, G. H.: Fortnightly variations in the flow velocity of Rutford Ice Stream, West Antarctica, Nature, 444, 1063–1064, doi:10.1038/nature05430, 2006. 1727
Haran, T., Bohlander, J., Scambos, T., Painter, T., and Fahnestock, M.: MODIS mosaic of 25
Antarctica (MOA) image map, National Snow and Ice Data Center, Digital media, Boulder, Colorado, USA, updated 2006, 2005. 1724
Helsen, M. M., van den Broeke, M. R., van de Wal, R. S. W., van de Berg, W. J., van Meij-gaard, E., Davis, C. H., Li, Y., and Goodwin, I.: Elevation changes in Antarctica mainly deter-mined by accumulation variability, Science, 320, 1626–1629, doi:10.1126/science.1153894, 30
TCD
6, 1715–1738, 2012RADARSAT-2 observations of Central Antarctica
B. Scheuchl et al.
Title Page
Abstract Introduction
Conclusions References
Tables Figures
◭ ◮
◭ ◮
Back Close
Full Screen / Esc
Printer-friendly Version Interactive Discussion
Discussion
P
a
per
|
Dis
cussion
P
a
per
|
Discussion
P
a
per
|
Discussio
n
P
a
per
|
Jezek, K. and Drinkwater, M.: International viewpoint and news – global interagency IPY polar snapshot year: an update, Environ. Geol., 55, 1379–1380, doi:10.1007/s00254-008-1393-y, 2008. 1717, 1718
Joughin, I. and Padman, L.: Melting and freezing beneath Filchner-Ronne Ice Shelf, Antarctica, Geophys. Res. Lett., 30, 1477, doi:10.1029/2003GL016941, 2003. 1726
5
Joughin, I., Tulaczyk, S., Bindschadler, R., and Price, S. F.: Changes in West Antarctic ice stream velocities: observation and analysis, J. Geophys. Res. (Solid Earth), 107, 2289, doi:10.1029/2001JB001029, 2002. 1718, 1724, 1729
Joughin, I., Bindschadler, R. A., King, M. A., Voigt, D., Alley, R. B., Anandakrishnan, S., Horgan, H., Peters, L., Winberry, P., Das, S. B., and Catania, G.: Continued decel-10
eration of Whillans Ice Stream, West Antarctica, Geophys. Res. Lett., 32, L22501, doi:10.1029/2005GL024319, 2005. 1724, 1729
Joughin, I., Smith, B. E., and Abdalati, W.: Glaciological advances made with interferomet-ric synthetic aperture radar, J. Glaciol., 56, 1026–1042, doi:10.3189/002214311796406158, 2011. 1717
15
Lazzara, M. A., Jezek, K. C., Scambos, T. A., MacAyeal, D. R., and van der Veen, C. J.: On the recent calving of icebergs from the Ross Ice Shelf, Polar Geogr., 23, 201–212, doi:10.1080/10889379909377676, 1999. 1728
Michel, R. and Rignot, E.: Flow of Glaciar Moreno, Argentina, from repeat-pass shuttle imag-ing radar images: comparison of the phase correlation method with radar interferometry, J. 20
Glaciol., 45, 93–100, 1999. 1719
Morena, L. C., Pearce, C., Olfert, L., Elder, C., and Rolland, P.: RADARSAT-2 order handling and mission planning, Can. J. Remote Sens., technical note, 30, 304–320, 2004. 1719 Mouginot, J., Rignot, E., and Scheuchl, B.: Mosaicking of ice motion in Antarctica: data and
methods, in preparation, 2012. 1720, 1721 25
Padman, L., Erofeeva, S. Y., and Fricker, H. A.: Improving Antarctic tide models by as-similation of ICESat laser altimetry over ice shelves, Geophys. Res. Lett., 35, L22504, doi:10.1029/2008GL035592, 2008. 1720
Pritchard, H. D., Arthern, R. J., Vaughan, D. G., and Edwards, L. A.: Extensive dynamic thin-ning on the margins of the Greenland and Antarctic ice sheets, Nature, 461, 971–975, 30
doi:10.1038/nature08471, 2009. 1728, 1729
TCD
6, 1715–1738, 2012RADARSAT-2 observations of Central Antarctica
B. Scheuchl et al.
Title Page
Abstract Introduction
Conclusions References
Tables Figures
◭ ◮
◭ ◮
Back Close
Full Screen / Esc
Printer-friendly Version Interactive Discussion
Discussion
P
a
per
|
Dis
cussion
P
a
per
|
Discussion
P
a
per
|
Discussio
n
P
a
per
|
Rignot, E., Padman, L., MacAyeal, D. R., and Schmeltz, M.: Observation of ocean tides be-low the Filchner and Ronne Ice Shelves, Antarctica, using synthetic aperture radar inter-ferometry: comparison with tide model predictions, J. Geophys. Res., 105, 19615–19630, doi:10.1029/1999JC000011, 2000. 1720
Rignot, E., Bamber, J. L., van den Broeke, M. R., Davis, C., Li, Y., van de Berg, W. J., and van 5
Meijgaard, E.: Recent Antarctic ice mass loss from radar interferometry and regional climate modelling, Nat. Geosci., 1, 106–110, doi:10.1038/ngeo102, 2008. 1728, 1730
Rignot, E., Mouginot, J., and Scheuchl, B.: Antarctic grounding line mapping from differential satellite radar interferometry, Geophys. Res. Lett., 38, L10504, doi:10.1029/2011GL047109, 2011a. 1722, 1723, 1724
10
Rignot, E., Mouginot, J., and Scheuchl, B.: Ice Flow of the Antarctic Ice Sheet, Science, 333, 1427–1430, doi:10.1126/science.1208336, 2011b. 1717, 1719, 1724, 1736
Rignot, E., Mouginot, J., and Scheuchl, B.: MEaSUREs Antarctic Grounding Line from Dif-ferential Satellite Radar Interferometry, NASA EOSDIS DAAC at NSIDC, available online: http://nsidc.org/data/nsidc-0498.html, last access: May 2012, 2011c. 1722
15
Rignot, E., Mouginot, J., and Scheuchl, B.: MEaSUREs InSAR-Based Antarctica Velocity Map, NASA EOSDIS DAAC at NSIDC, available online: http://nsidc.org/data/nsidc-0484.html, last access: May 2012, 2011d. 1725
Stearns, L. A., Smith, B. E., and Hamilton, G. S.: Increased flow speed on a large East Antarctic outlet glacier caused by subglacial floods, Nat. Geosci., 1, 827–831, doi:10.1038/ngeo356, 20
2008. 1729
Thomas, R.: Thickening of the Ross Ice Shelf and equilibrium state of the West Antarctic ice sheet, Nature, 259, 180–183, 1976. 1724
Thomas, R., Rignot, E., and Scheuchl, B.: Substantial velocity changes on the Ross Ice Shelf, Antarctica, in preparation, 2012. 1729
TCD
6, 1715–1738, 2012RADARSAT-2 observations of Central Antarctica
B. Scheuchl et al.
Title Page
Abstract Introduction
Conclusions References
Tables Figures
◭ ◮
◭ ◮
Back Close
Full Screen / Esc
Printer-friendly Version Interactive Discussion
Discussion
P
a
per
|
Dis
cussion
P
a
per
|
Discussion
P
a
per
|
Discussio
n
P
a
per
|
Table 1.Left looking RADARSAT-1 (September–October 1997) and RADARSAT-2 (February–
April 2009+limited gap filler in 2011) modes used for interferometric data collects in Antarctica.
RADARSAT-1 1997
ST2 ST3 ST4 ST5 ST6 ST7
Range Spacing 8.1 m 11.6 m 11.6 m 11.6 m 11.6 m 11.6 m
Azimuth Spacing 5.3 m 5.0 m 5.1 m 5.2 m 5.0 m 5.2 m
Incidence Angle 28.0◦ 34.1◦ 36.7◦ 39.5◦ 44.3◦ 47.2◦
No. of Tracks 46 10 12 12 9 13
RADARSAT-2 2009
S5 EH4
Range Spacing 11.8 m 11.8 m
Azimuth Spacing 5.1 m 5.1 m
Incidence Angle 41.3◦ 57◦
No. of Tracks 43 85 (+14)a
Coverage (lat) 77.5◦ to 87◦ 86.5◦to Pole
TCD
6, 1715–1738, 2012RADARSAT-2 observations of Central Antarctica
B. Scheuchl et al.
Title Page
Abstract Introduction
Conclusions References
Tables Figures
◭ ◮
◭ ◮
Back Close
Full Screen / Esc
Printer-friendly Version Interactive Discussion
Discussion
P
a
per
|
Dis
cussion
P
a
per
|
Discussion
P
a
per
|
Discussio
n
P
a
per
|
-40 m/yr 0 +40 m/yr dv 24 days (2009)
-100 m/yr 0 +100 m/yr dv 12 years (2009-1997)
0 250 km
Ronne Ice Shelf Ross Ice Shelf
Siple Coast
Crary Ice Rise Siple
Dome
Henry Ice Rise Korff
Ice Rise
Berkner Island
Tide not corrected
Tide correction applied
Fig. 1.Impact of tide correction to InSAR based ice velocity estimates. The example on the
TCD
6, 1715–1738, 2012RADARSAT-2 observations of Central Antarctica
B. Scheuchl et al.
Title Page
Abstract Introduction
Conclusions References
Tables Figures
◭ ◮
◭ ◮
Back Close
Full Screen / Esc
Printer-friendly Version Interactive Discussion
Discussion
P
a
per
|
Dis
cussion
P
a
per
|
Discussion
P
a
per
|
Discussio
n
P
a
per
|
100
300500
700 900 100
300
500
700
900
500
1500
1000 2000 1000
1500 500
2500 3000
3500
4000
2000
Roosevelt Island
Ross Ice Shelf
Ronne-Filchner Ice Shelf
Baily IS Slessor Gl
Recovery Gl
Foundation IS
Institute IS Rutford IS
Mercer IS
Van der Veen IS Whillans IS
Bindschadler IS
MacAyeal IS
Byrd Gl IS: Ice Stream Gl: Glacier 0 500 1000 km
v_1997 [m/yr]
<1.5 10 100 1000>3000
v_1997 [m/yr]
<1.5 10 100 1000>3000
dv [m/yr]
-100 +100 0
velocity contour [m/yr]
100
elevation contour [m]
1000
a b c
Fig. 2.Ice surface velocity maps for Central Antarctica for 1997(a)and 2009(b) overlaid on MOA.(c)shows the velocity difference dv (2009–1997) for the entire region. Superimposed on
TCD
6, 1715–1738, 2012RADARSAT-2 observations of Central Antarctica
B. Scheuchl et al.
Title Page Abstract Introduction Conclusions References Tables Figures ◭ ◮ ◭ ◮ Back Close
Full Screen / Esc
Printer-friendly Version Interactive Discussion Discussion P a per | Dis cussion P a per | Discussion P a per | Discussio n P a per |
-100 m/yr 0 +100 m/yr Velocity Difference
0 250 km 500
A A’ B B’ D D’ E E’ Y Y’
1997 Ice front 2009 Ice front 2009 Grounding line Flow lines
Mercer IS
0 200 400 600 800 1000 1200
A Distance A’
0 200 400 600 800 1000
Ice velocity [m/yr]
-100 -50 0 50 100 dv [m/yr] R-1 1997
R-2 2009 dv
Bindschadler IS
0 200 400 600 800 1000 0 200 400 600 800 1000
Ice velocity [m/yr]
-100 -50 0 50 100 dv [m/yr] R-1 1997 R-2 2009 dv
D Distance D’
MacAyeal IS
0 200 400 600 800 0 200 400 600 800 1000
Ice velocity [m/yr]
-100 -50 0 50 100 dv [m/yr] R-1 1997 R-2 2009 dv
E Distance E’
Whillans IS
0 200 400 600 800 1000 0 200 400 600 800 1000
Ice velocity [m/yr]
-100 -50 0 50 100 dv [m/yr] R-1 1997
R-2 2009 dv
B Distance B’
Byrd GL
0 50 100 150 200 250 0 200 400 600 800 1000
Ice velocity [m/yr]
-100 -50 0 50 100 dv [m/yr] R-1 1997
R-2 2009 dv
Y Distance Y’
TCD
6, 1715–1738, 2012RADARSAT-2 observations of Central Antarctica
B. Scheuchl et al.
Title Page Abstract Introduction Conclusions References Tables Figures ◭ ◮ ◭ ◮ Back Close
Full Screen / Esc
Printer-friendly Version Interactive Discussion Discussion P a per | Dis cussion P a per | Discussion P a per | Discussio n P a per |
-100 m/yr 0 +100 m/yr Velocity Difference
0 250 km 500 B B’ S S’ R R’ F F’ I I’ U U’
1997 Ice front 2009 Ice front 2009 Grounding line Flow lines
Baily IS
0 50 100 150 200 250
0 200 400 600 800 1000
Ice velocity [m/yr]
-100 -50 0 50 100 dv [m/yr] R-1 1997
R-2 2009 dv
B Distance B’
Slessor GL
0 100 200 300 400 500
0 200 400 600 800 1000
Ice velocity [m/yr]
-100 -50 0 50 100 dv [m/yr] R-1 1997
R-2 2009 dv
S Distance S’
Recovery Gl
0 200 400 600 800 1000
0 200 400 600 800 1000
Ice velocity [m/yr]
-100 -50 0 50 100 dv [m/yr] R-1 1997 R-2 2009 dv
R Distance R’
Foundation IS
0 200 400 600 800
0 200 400 600 800 1000
Ice velocity [m/yr]
-100 -50 0 50 100 dv [m/yr] R-1 1997
R-2 2009 dv
F Distance F’
Institute Gl
0 100 200 300 400 500
I Distance I’
0 200 400 600 800 1000
Ice velocity [m/yr]
-100 -50 0 50 100 dv [m/yr] R-1 1997
R-2 2009 dv
Rutford IS
0 50 100 150 200 250 300
0 200 400 600 800 1000
Ice velocity [m/yr]
-100 -50 0 50 100 dv [m/yr] R-1 1997
R-2 2009 dv
U Distance U’