BULLETIN OF THE SERBIAN GEOGRAPHICAL SOCIETY
2011.
XCI -
. 3
YEAR 2011
TOME XCI - N 3
O UDC 912 DOI:10.2298/GSGD1103139B
А АЈ А А А А
M
ј , М ј К ћ 5, , ј
: ,
. ,
, 1947. 1967. .
, ,
1:25 000 1:100 000. , .
: , , , , .
, ,
.
, ( ., 2004).
: topos ( .- ) graphos (
.-, ).
:
- ;
- ( ,
, , ,
);
- , , .
, 1:25 000 ( 25), 1:50 000 (
50), 1:100 000 ( 100),
. :
- ,
,
ђ ;
- ,
;
- ,
,
, ,
.
,
. ( ., 1979).
( ) ,
,
. ,
, . .
ђ .
. ,
, ђ
, , ,
( ) ђ ,
.
.
. , ,
, ,
.
- , .
3° , 18°
21° . ,
.
,
, . .
, .
. ђ ,
: x = 0 m y = 500 000 m,
: m = 0,9999 ( ., 2006).
1. , 25, 50 100
ϕ λ [km 2
]
1: 25 000 427-1-1 7′ 30″ 7′ 30″ 140
1: 50 000 427-1 15′ 15′ 555
1: 100 000 427 30′ 30′ 2 220
1, ,
100. 50 ,
,
1, 2, 3, 4. ,
, 25 ( ., 1974).
, .
,
( ). .
ђ , ,
(
., 1995).
,
, .
,
: ,
,
, .
2.
1:25 000 1:50 000 1:100 000
1 ● ● ●
2 ( ) ● ● ○
3 ● ● ●
4 X ● ● ●
5 ● ● ●
6 ● ● ●
7
● ● ●
8
● ● ●
9 ● ● ○
10 ● ● ●
11 ● ● ●
12 - ● ● ○
13 ● ● ●
14 ● ● ●
15 ● ● ○
●
,
ђ
.
, 25,
50 100 :
- ђ
- .
. 2,
( ., 2004).
100.
3.
1:25 000 1:50 000 1:100 000
1 - ● ● ●
2 - ● ● ●
3 - ● ● ●
4 - ● ● ●
5 - ● ● ●
6 - ● ● ●
7 ● ● ●
8 ● ● ●
9
● ● ○
10 - ђ ● ● ●
11 - ђ ● ● ○
12 ● ● ●
13 ● ● ●
14 ( ) ● ● ●
15 Ш - ● ● ○
16 (
) ● ● ●
17 ● ● ●
18 ● ● ●
19 ● ● ○
20 ● ● ●
21 ● ● ●
22 ● ● ●
23 , , ● ● ●
24 ● ● ●
25 ● ● ●
26 ● ● ●
27 ● ● ○
28 ● ● ○
29 - ● ● ○
30 - ● ● ○
31
●
○
50, 100,
25, ,
. ђ ,
,
,
,
( ., 2009). 3,
. ђ ,
100.
.
50 100 25,
.
:
,
, (
) .
. ђ ,
, . ђ
″ ″ ″ ″ (
,
ђ
).
, ,
ђ .
, . , , ,
, , .
. ђ ,
,
, .
. ,
.
, ,
. ,
0.1 mm ,
, ( ., 1974).
, 0.2 mm ( ., 1995).
, .
, ,
, , ,
.
,
.
ђ . ђ ,
. ,
, .
.
,
. ђ
. Ш ,
,
. ђ
.
,
, , .
( ., 2008).
ђ
, ђ
. 25
, ,
. 50
100 . Њ
.
(
) .
,
. ,
,
(
) .
,
,
: . ,
, ,
. ,
ђ .
ђ , .
ђ .
, . (2004). 1:50 000,
, , ђ .
, . (2006). , , . 1, 81-87.
, ., , ., . . (2009). .
, . (1979).
,
, , .
(2008). 1986-2006. , , ,
.
, ., , ., , ., , . (1974). , ,
.
, . (2008). 1:50 000
, , , , .
Robinson, A., Morrison, J., Muehrcke, P., Kimerling, J. and Guptill, S. (1995). Elements of cartography, USA. ISO 19114 – Qualioty evaluation procedures.
UDC 912 DOI:10.2298/GSGD1103139B
EXPRESSIVE FEATURES OF TOPOGRAPHIC MAPS
MIRKO BORISOV
Military Geographical Institute, Belgrade, Serbia
Abstract: In the field of official topographic cartography Serbia has a long tradition which origin dates from Princedom of Serbia. On the territory of Serbia and former federal state, there have been conducted several surveys in the field, of which the last one was conducted in the period from 1947 to 1967. Based on that survey, the entire area of ex state was covered with topographic maps, but some of them are interested for example at the scale from 1:25 000 up to 1:100 000. That maps are analysed in this article, specially their characteristics.
Key words: cartography, topographic map, mathematical base, density of contents, quality of data.
Introduction
Objects on the surface of the Earth are performed by topographic maps in detail with geographically specific forms, which jointly monitored and related thoughtful, represents a view of reality. Topographic maps allow obtaining complete and true perspective of local conditions, respectively, they represents small parts of the Earth's surface (Borisov M., 2004). Hence, the meaning of their name is closely related with the aforementioned: topos
(Greek-place) and graphos (Greek-draw, describe). Topographic maps are intended to:
- Planning and orientation in geospace;
- The study of topographical features of land (the configuration of relief, hydrographical features, mobility, visibility, the protective properties of soil and vegetation coverage);
- Implementation of the scientific, military, economic, and other suitable purposes.
Topographic maps of larger scale, respectively 1:25 000 ( M 25), 1:50 000 ( M 50), and to a certain extent topographic map of scale 1:100 000 (TM 100), differ in their expressive properties of all other maps. Those are:
- Geometrical accuracy of data, because their construction was carried out according to strict mathematical laws and the content is relatively of large scale which ensures the applicability of them in measuring purposes;
- The optimal ratio of the affected areas and the amount of data, which allows seeing of many quantitative and qualitative characteristics of the elements of content;
- Data quality, because they are generally issued by using primary methods of collecting and created according to strict rules of cartography.
At the same time, topographic maps are used both as source and auxiliary maps for producting others, above all, thematic maps at the same or smaller scale.
Mathematical conditionality of making maps
In the first phase, the real (physical) surface of the Earth, its forms and objects are projected to approximate of the Earth's surface, which is limited by the mean see level which is stretched under the mainland and is called the geoid. This projection is accomplished orthogonally, with lines which are perpendicular to the approximate surface of the Earth. The procedure is carried out when determining the geodetic basis or during surveying. This ensures that all objects on the map are represented faithfully and accurately in relation to the adopted coordinate system. Considering the fact that the geoid, due to the structure and mass distribution within the earth, can not be considered analytically as certain geometric body, is replaced according to the forms which is very similar to the surface of the rotating body, apropos the Earth's ellipsoid (spheroid) by certain numerical parameters, and all calculations are performed using that.
In the second phase, the surface of ellipsoid is mapped to the plane. The transition from an ellipsoid to the plane is performed by mathematical laws of mapping for a specific cartographic projection. Strictly considering, therefore, topographic maps are not concrete pictures of the physical surface of the Earth, as it is commonly said; there are the Earth's surface projected on the ellipsoid.
In our case, the Gauss-Krüger projection is used by meridian zones. These areas include the zone of 3° by longitude, whose central meridians are 18° and 21° eastern per Greenwich. Zones are numbered as the sixth and seventh, with the seventh zone that extends to the easternmost point of the state territory. Plane Cartesian coordinates are read in one zone, and additional calculation is necessary for transition from one zone to another, namely, coordinate transformation. For horizontal axis is taken intermediate zone meridian, and for vertical axis equator. The coordinate origin of each zone is the intersection of the zone meridian and equator. Also, it is adopted that the coordinate origin is at the point x = 0 m and y = 500 000 m, and all the values of the coordinates are multiplied with the linear module: m = 0.9999 (Borisov M., 2006).
Table 1 Category, nomenclature and size of sheets of TM 25, TM 50 and TM 100
Arch dimensions Scale Nomenclature
sheet ϕ λ Surface mapping by sheet [km2]
1: 25 000 427-1-1
7′ 30″ 7′ 30″ 140
1: 50 000 427-1
15′ 15′ 555
1: 100 000 427
30′ 30′ 2 220
Table 1 shows the category, nomenclature and size of sheets of topographic maps in larger scale. Aforementioned topographic maps are listed in the system of TM 100. Each sheet of TM 50 has its nomenclature arising from enclosed category, a name of a sheet is the same as a name of the most prominent inhabited place or geographical object located in implied area, with an accompanying number (1, 2, 3, and 4). In a similar way, using a detailed classification, is given nomenclature for TM 25 (Peterca M., and others 1974).
Review and density of graphic content
Availability of topographic maps depends on the scale of mapping, if a content of a map keeps abreast with actual situation, and the general quality of a map. From the point of view and density of content in a topographic map, it is important to emphasize factors: the occupancy map content that is directly related to the other two factors, apropos geographic fidelity and geometric accuracy of a map, then the visibility of a map, the external appearance and print quality.
Modern topographic mapping resulted in our country and in the world to the established conventional solutions and standards in the content of topographic maps causing the accretion of its use-value (availability). The major types of comparative analysis of the views and content on the density of topographical maps, apropos TM 25, TM 50 and TM 100 are:
- Comparison of the structure of a mapping content and
- Consideration of the degree of generalization by some elements of the content.
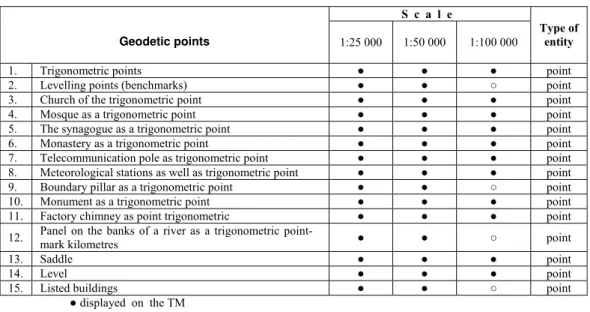
For example and analysis could be taken one element of the mathematical basis and one element of the geographical content. Table 2 provides an overview of the data density of topographic maps that are just related to the geodetic point as one of the most important mathematical elements of a map (Borisov M., 2004). The analysis could be seen a gradual reduction of geodetic points not until the TM 100.
Table 2. Review and density of data on geodetic points
S c a l e
Geodetic points 1:25 000 1:50 000 1:100 000
Type of entity
1. Trigonometric points ● ● ● point
2. Levelling points (benchmarks) ● ● ○ point
3. Church of the trigonometric point ● ● ● point
4. Mosque as a trigonometric point ● ● ● point
5. The synagogue as a trigonometric point ● ● ● point
6. Monastery as a trigonometric point ● ● ● point
7. Telecommunication pole as trigonometric point ● ● ● point
8. Meteorological stations as well as trigonometric point ● ● ● point
9. Boundary pillar as a trigonometric point ● ● ○ point
10. Monument as a trigonometric point ● ● ● point
11. Factory chimney as point trigonometric ● ● ● point
12. Panel on the banks of a river as a trigonometric point-
mark kilometres ● ● ○ point
13. Saddle ● ● ● point
14. Level ● ● ● point
15. Listed buildings ● ● ○ point
● displayed on the TM
○ not displayed on M
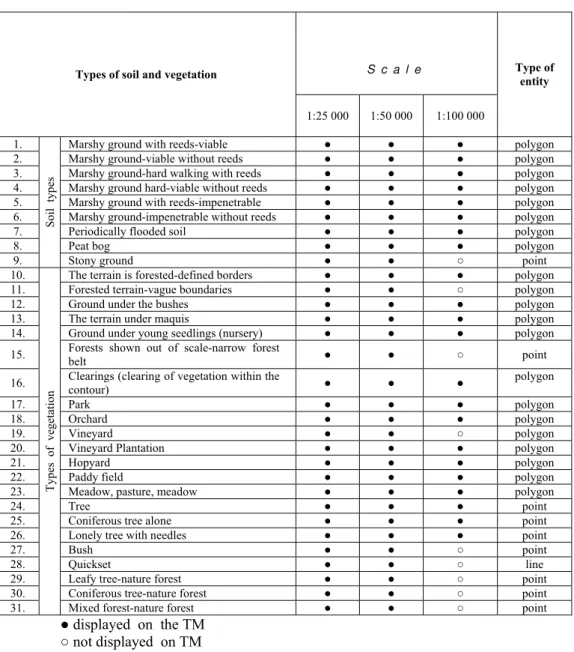
comparative analysis can be observed a gradual reduction of data of the types of soil and review of vegetation at map with scale 1:100.000 (TM 100).
Table 3 Review and density of geographical data of the types of soil and vegetation
S c a l e
Types of soil and vegetation
1:25 000 1:50 000 1:100 000
Type of entity
1. Marshy ground with reeds-viable ● ● ● polygon
2. Marshy ground-viable without reeds ● ● ● polygon
3. Marshy ground-hard walking with reeds ● ● ● polygon
4. Marshy ground hard-viable without reeds ● ● ● polygon
5. Marshy ground with reeds-impenetrable ● ● ● polygon
6. Marshy ground-impenetrable without reeds ● ● ● polygon
7. Periodically flooded soil ● ● ● polygon
8. Peat bog ● ● ● polygon
9.
Soil types
Stony ground ● ● ○ point
10. The terrain is forested-defined borders ● ● ● polygon
11. Forested terrain-vague boundaries ● ● ○ polygon
12. Ground under the bushes ● ● ● polygon
13. The terrain under maquis ● ● ● polygon
14. Ground under young seedlings (nursery) ● ● ● polygon
15. Forests shown out of scale-narrow forest
belt ● ● ○ point
16. Clearings (clearing of vegetation within the
contour) ● ● ●
polygon
17. Park ● ● ● polygon
18. Orchard ● ● ● polygon
19. Vineyard ● ● ○ polygon
20. Vineyard Plantation ● ● ● polygon
21. Hopyard ● ● ● polygon
22. Paddy field ● ● ● polygon
23. Meadow, pasture, meadow ● ● ● polygon
24. Tree ● ● ● point
25. Coniferous tree alone ● ● ● point
26. Lonely tree with needles ● ● ● point
27. Bush ● ● ○ point
28. Quickset ● ● ○ line
29. Leafy tree-nature forest ● ● ○ point
30. Coniferous tree-nature forest ● ● ○ point
31.
T
ypes of
vegetation
Mixed forest-nature forest ● ● ○ point
● displayed on the TM
○ not displayed on M
Quality of data on topographic maps
Talking about the quality of data on topographic maps means the degree of geometric and thematic deviations of data that are shown from their actual position. To determine the geometric accuracy, it is usually applied deductive method of printing, namely, comparison of measured size on topographic maps with the "true" or "provisionally true" values (numeric data about horizontal and vertical network or data from larger scale maps, where the errors in the content of certain elements of comparison would be negligible due to the differences in the scale of appearance). This method provides a direct evaluation of the accuracy of printed maps and reproduction originals, opposed to the inductive method, which considers and determines errors in certain phases of producing of topographic maps.
Geometric accuracy of topographic maps is not always the same and depends on the type of surveying to the type of content, namely, it depends on points of geodetic basis that are given more accurately than, for example, vegetation, whose accuracy of the position is the least. The main scale of topographic maps represents either a fixed or freeze ratio reduction of a display. However, the fact is that the ratio of reduction can not keep a constant value - that is a repercussion of the curvature of surface of the Earth's ellipsoid, which develops to a plane. Thereby, there are the inevitable distortions appear. Therefore, the accuracy of various measurements on maps depends not only on the scale but also on the accompanying deformations. If the scale decrease in all sizes, it would some geographical or topographical objects become so small that it can not be represented on a map. According to some authors, length at the surface of the Earth’s ellipsoid which corresponds to 0.1 mm in a topographic map, is called the boundary map accuracy, namely its graphical accuracy (Peterca M., and others 1974). According to others, the size goes up to 0.2 mm (Robinson A., and others 1995). In any case, it is the size that affects the eligibility of view of topographic detail. At the same time, of course, we shouldn’t forget that at the surface of the Earth’s ellipsoid there are a number of objects, which are, regardless of the scale of the reduced size, due to its importance, must be increased for showing on a map.
Unlike most of the geometric accuracy and perception, the terms of errors and quality in the field of topographic-cartographic scope often are not completely identical and unique, because they can not only include values that can be exactly measured. The estimation of the quality is dependent on the size of the different characteristics and therefore is not free of subjective evaluation. However, the value of a topographic map is a concept that combines variety of objective and subjective quality. The accuracy as one of the quality, beside geometric accuracy can be classified and thematic accuracy, apropos the accuracy of general information. It is impossible to find a mathematical expression for the accuracy of general information. It is possible to determine the number of erroneous in relation to the total amount of information of that kind, such as names or signs on a single map sheet.
Generalization error is also very difficult to describe using mathematical formula that would completely objectively evaluate the quality of work. Moreover, working with the control showed the least deviation value numerically expressed, may not be the best professionally done. A need for generalization of content sometimes devalues mathematically well-placed control formula. While the solution of mathematically defined task can only be right or wrong, the decision of many cartographic tasks can, of course, within certain limits, be a good or poor. There are causes of subjectivism and the difficulties in evaluating the quality of some topographic-cartographic modelling and visualization of data (Radojcic S., 2008).
accuracy is expected as well. It is expected that the reduction of thematic accuracy will occur using the generalization of content on maps with scale TM 50 and TM 100. Their quality is measured by degree of preservation of thematic accuracy.
Conclusion
Topographic maps of larger scale are maps that are used in Serbian Army (and in other armies) and their usage is more popular than usage of maps of other dimensions and scales and purpose. They are suitable both for orientation and movement, and for a variety of planning and monitoring the situation at various levels of commanding. In addition, these maps in our country are significant in cartographical production as basic cartographic sources for production of all other geographic (topographic and thematic) maps.
Content of topographic maps in larger scales, as well as regular and detailed review of the layout of objects and phenomena in space, is considered as a unity of views of the two sides of reality: space and content. On the other hand, as already noted, each topographic map has a mathematical and geographic, or topographic component.
Thus, all objects and phenomena that are shown in a topographic map at larger scale have its spatial and comprehensive distinctness. While the spatial distinctness is measurable, comprehensive distinctness has a conceptual character. Quality content of topographic maps just come as a result of good solutions and compromise between the mathematical basis of reality and geospatial reality.
References