ACPD
10, 20769–20822, 2010VOCALS operations
R. Wood et al.
Title Page
Abstract Introduction
Conclusions References
Tables Figures
◭ ◮
◭ ◮
Back Close
Full Screen / Esc
Printer-friendly Version
Interactive Discussion
Discussion
P
a
per
|
Dis
cussion
P
a
per
|
Discussion
P
a
per
|
Discussio
n
P
a
per
|
Atmos. Chem. Phys. Discuss., 10, 20769–20822, 2010 www.atmos-chem-phys-discuss.net/10/20769/2010/ doi:10.5194/acpd-10-20769-2010
© Author(s) 2010. CC Attribution 3.0 License.
Atmospheric Chemistry and Physics Discussions
This discussion paper is/has been under review for the journal Atmospheric Chemistry and Physics (ACP). Please refer to the corresponding final paper in ACP if available.
The VAMOS
Ocean-Cloud-Atmosphere-Land Study
Regional Experiment (VOCALS-REx):
goals, platforms, and field operations
R. Wood1, C. S. Bretherton1, C. R. Mechoso2, R. A. Weller3, B. Huebert4, F. Straneo3, B. A. Albrecht5, H. Coe6, G. Allen6, G. Vaughan6, P. Daum7,
C. Fairall8, D. Chand1, L. Gallardo Klenner9, R. Garreaud9, C. Grados Quispe10,
D. S. Covert1, T. S. Bates11, R. Krejci12, L. M. Russell13, S. de Szoeke14, A. Brewer8, S. E. Yuter15, S. R. Springston7, A. Chaigneau17, T. Toniazzo16, P. Minnis18, R. Palikonda23, S. J. Abel19, W. O. J. Brown20, S. Williams20,
J. Fochesatto21, and J. Brioude22,8
1
Department of Atmospheric Sciences, University of Washington, Seattle, USA
2
UCLA, Los Angeles, USA
3
Woods Hole Oceanographic Institution, USA
4
ACPD
10, 20769–20822, 2010VOCALS operations
R. Wood et al.
Title Page
Abstract Introduction
Conclusions References
Tables Figures
◭ ◮
◭ ◮
Back Close
Full Screen / Esc
Printer-friendly Version
Interactive Discussion
Discussion
P
a
per
|
Dis
cussion
P
a
per
|
Discussion
P
a
per
|
Discussio
n
P
a
per
|
5
Rosenstiel School of Marine and Atmospheric Science, University of Miami, USA
6
School of Earth, Atmospheric and Environmental Sciences, University of Manchester, UK
7
Brookhaven National Laboratory, Upton, USA
8
NOAA Earth System Research Laboratory, Boulder, USA
9
Departamento de Geofisica, Universidad de Chile, Chile
10
Instituto del Mar del Per ´u, Per ´u
11
NOAA Pacific Marine Environmental Laboratory, Seattle, USA
12
Dept. of Applied Environmental Science (ITM), Stockholm University, Sweden
13
Scripps Institution of Oceanography, University of California, San Diego, USA
14
Oregon State University, Corvallis, USA
15
North Carolina State University, Raleigh, USA
16
Department of Meteorology, University of Reading, UK
17
L’Institut de Recherche pour le D ´eveloppement, Marseille, France
18
NASA Langley Research Center, Hampton, USA
19
The Met Office, Exeter, UK
20
National Center for Atmospheric Research, Boulder, USA
21
Department of Atmospheric Sciences, Geophysical Institute and College of Natural Sciences and Mathematics, University of Alaska, Fairbanks, USA
22
Cooperative Institute for Research in Environmental Sciences, University of Colorado, Boulder, Colorado, USA
23
Science Systems and Applications, Inc., Hampton, USA
Received: 4 August 2010 – Accepted: 17 August 2010 – Published: 1 September 2010
Correspondence to: R. Wood ([email protected])
ACPD
10, 20769–20822, 2010VOCALS operations
R. Wood et al.
Title Page
Abstract Introduction
Conclusions References
Tables Figures
◭ ◮
◭ ◮
Back Close
Full Screen / Esc
Printer-friendly Version
Interactive Discussion
Discussion
P
a
per
|
Dis
cussion
P
a
per
|
Discussion
P
a
per
|
Discussio
n
P
a
per
|
Abstract
The VAMOS Ocean-Cloud-Atmosphere-Land Study Regional Experiment (VOCALS-REx) was an international field program designed to make observations of poorly un-derstood but critical components of the coupled climate system of the southeast Pacific. This region is characterized by strong coastal upwelling, the coolest SSTs in the
tropi-5
cal belt, and is home to the largest subtropical stratocumulus deck on Earth. The field intensive phase of VOCALS-REx took place during October and November 2008 and constitutes a critical part of a broader CLIVAR program (VOCALS) designed to develop and promote scientific activities leading to improved understanding, model simulations, and predictions of the southeastern Pacific (SEP) coupled ocean-atmosphere-land
sys-10
tem, on diurnal to interannual timescales. The other major components of VOCALS are a modeling program with a model hierarchy ranging from the local to global scales, and a suite of extended observations from regular research cruises, instrumented moor-ings, and satellites.
The two central themes of VOCALS-REx are designed to improve understanding of
15
(a) links between aerosols, clouds and precipitation and their impacts on marine stra-tocumulus radiative properties, and (b) physical and chemical couplings between the upper ocean and the lower atmosphere, including the role that mesoscale ocean ed-dies play. A set of hypotheses designed to be tested with the combined field, monitoring and modeling work in VOCALS is presented here. VOCALS-REx involved five research
20
ACPD
10, 20769–20822, 2010VOCALS operations
R. Wood et al.
Title Page
Abstract Introduction
Conclusions References
Tables Figures
◭ ◮
◭ ◮
Back Close
Full Screen / Esc
Printer-friendly Version
Interactive Discussion
Discussion
P
a
per
|
Dis
cussion
P
a
per
|
Discussion
P
a
per
|
Discussio
n
P
a
per
|
1 Introduction
1.1 Scientific motivation
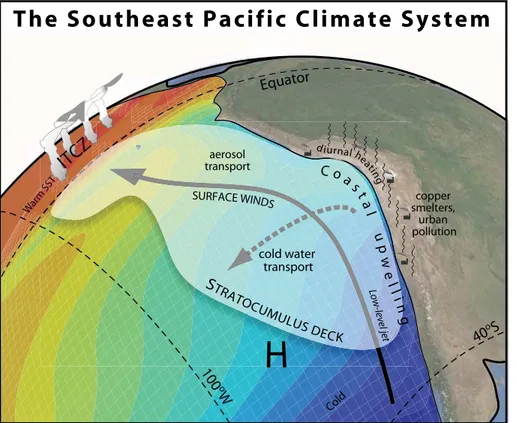
Interactions between the South American continent and the Southeast Pacific (SEP) Ocean are extremely important for both the regional and global climate system. Fig-ure 1 indicates some of the key featFig-ures associated with these interactions. The great
5
height and continuity of the Andes Cordillera forms a sharp barrier to zonal flow, result-ing in strong winds (coastal jet) parallel to the coasts of Chile and Peru (Garreaud and Mu ˜noz, 2005). This, in turn, drives intense oceanic upwelling along these coasts, bring-ing cold, deep, nutrient/biota rich waters to the surface. As a result, the coastal SEP sea-surface temperatures (SSTs) are colder along the Chilean and Peruvian coasts
10
than at any comparable latitude elsewhere. The cold surface, in combination with warm, dry air aloft, is ideal for the formation of marine stratocumulus clouds, and sup-ports the largest and most persistent subtropical stratocumulus deck in the world (Klein and Hartmann, 1993). The presence of this cloud deck has a major impact upon the earth’s radiation budget by reflecting solar radiation. This helps maintain cool SSTs,
15
resulting in tight couplings between the upper ocean and lower atmosphere in this re-gion. The unique climate of the SEP has been very sparsely observed, yet has great economic impact, with fishing in the Humboldt Current system representing 18–20% of the worldwide marine fish catch (source: UN LME report).
Global and regional models have great difficulties in the successful simulation of such
20
a complex system. Most coupled GCMs obtain SSTs that are too warm and have too few clouds over the SEP, and show unrealistic features in the simulation of the warm tropics downstream (deSzoeke and Xie, 2008). There are major uncertainties in the representation of key physical processes in these models, which may be contributing to these errors (e.g. Mechoso et al., 1995; Ma et al., 1996). There are still significant
25
ACPD
10, 20769–20822, 2010VOCALS operations
R. Wood et al.
Title Page
Abstract Introduction
Conclusions References
Tables Figures
◭ ◮
◭ ◮
Back Close
Full Screen / Esc
Printer-friendly Version
Interactive Discussion
Discussion
P
a
per
|
Dis
cussion
P
a
per
|
Discussion
P
a
per
|
Discussio
n
P
a
per
|
indicating an important role for drizzle in determining the cloud cover and radiative properties, in particular in promoting transitions from closed to open mesoscale cel-lular convection (e.g. Comstock et al., 2007; Savic-Jovcic and Stevens, 2008; Wang and Feingold, 2009; Wang et al., 2010) and the formation of so-called “pockets of open cells” (POCs) (Bretherton et al., 2004; Stevens et al., 2005). Physical
param-5
eterizations currently used in large scale models do not yet attempt to represent the mesoscale interactions between precipitation and cloud cover.
There is evidence that precipitation in marine stratocumulus may be influenced by
anthropogenic aerosols (e.g. Geoffroy et al., 2008; Brenguier and Wood, 2009), which
suggests a potential role for aerosols to influence cloud macrostructure in addition
10
to their microphysics. Aerosol indirect effects on warm clouds are poorly understood
(e.g Lohmann and Feichter, 2005). Satellite and research cruise data show strong gradients in aerosol and cloud microphysical properties between the near-coastal and more remote marine region of the SEP (Wood et al., 2008), making this a region where
the Twomey effect may be particularly strong (see e.g. George and Wood, 2010), and
15
a region potentially well-suited to the study of aerosol-cloud interactions.
In the SEP region there are important contributions to the atmospheric aerosol from both natural and anthropogenic sources (Tomlinson et al., 2007; Hawkins et al., 2010).
Cloud droplet effective radii are low offthe coast of Northern Chile, implying elevated
concentrations of cloud droplets (Wood et al., 2008; George and Wood, 2010;
Paine-20
mal and Zuidema, 2010). These elevated concentrations are broadly downwind of
ma-jor copper smelters whose combined sulfur emissions total approximately 1 TgS yr−1,
comparable to the entire sulfur emissions from large industrialized nations such as
Mexico and Germany. Offshore transport events have been shown to lead to elevated
droplet concentrations offshore (Huneeus et al., 2006). However, little is actually known
25
about the aerosol composition in the region since there have been very few measure-ments. We do not yet know the extent of the anthropogenic influence, nor do we fully understand the complex chemistry occurring in the pristine boundary layers further
ACPD
10, 20769–20822, 2010VOCALS operations
R. Wood et al.
Title Page
Abstract Introduction
Conclusions References
Tables Figures
◭ ◮
◭ ◮
Back Close
Full Screen / Esc
Printer-friendly Version
Interactive Discussion
Discussion
P
a
per
|
Dis
cussion
P
a
per
|
Discussion
P
a
per
|
Discussio
n
P
a
per
|
In the absence of cloud macrophysical responses, the reduced droplet effective radii
resulting from increased concentrations of cloud droplets would increase the reflected solar radiation, and estimates of the component of the TOA solar radiation due to
geo-graphic variability in effective radius alone are∼10–20 W m−2or 20–40% of the mean
reflected shortwave (George and Wood, 2010). The magnitude of these estimates is
5
such that the indirect effects of aerosols on clouds could lead to significant decreases
in the amount of solar radiation entering the ocean, with significant implications for the ocean heat budget. However, we are beginning to understand that cloud responses to
aerosols are not solely due to the Twomey effect alone, and that fast feedbacks can
both enhance and counteract the Twomey effect (Ackerman et al., 2004; Xue et al.,
10
2008, e.g.).
Early estimates of surface heat fluxes from climatologies and numerical weather
prediction models showed diverse conclusions as to whether or not the offshore ocean
gained from or lost heat to the atmosphere. Observations from deployment of the IMET surface mooring beginning in 2000 near the location of the annual maximum in stratus
15
cloud cover showed that the ocean gains about 40 W m−2 annually and was subject
to over 1 meter in evaporation. This surface forcing was applied to a relatively thin ocean surface mixed layer (annual maximum thickness of about 150 m) that overlays a cold, fresh water mass formed to the south. For oceanographers, the challenge is to understand how the shallow surface layer under the clouds maintained it temperature
20
and salinity under this surface forcing.
Studies of the upper ocean heat budget offshore of the coastal upwelling zone
indi-cate weak mean advection, energetic eddies, and the need for a source of cold, fresh water (Colbo and Weller, 2007). The supply mechanism, presumably including by a combination of mesoscale and submesoscale processes and the interaction between
25
ACPD
10, 20769–20822, 2010VOCALS operations
R. Wood et al.
Title Page
Abstract Introduction
Conclusions References
Tables Figures
◭ ◮
◭ ◮
Back Close
Full Screen / Esc
Printer-friendly Version
Interactive Discussion
Discussion
P
a
per
|
Dis
cussion
P
a
per
|
Discussion
P
a
per
|
Discussio
n
P
a
per
|
regarding their role in influencing the mixed layer properties over the broader SEP but also their potential rolein modulating the concentration of aerosol precursors such as dimethylsulfide and complex organic species.
Clouds over the SEP exhibit a much stronger diurnal cycle of cloud cover and liq-uid water path LWP (Rozendaal et al., 1995; Wood et al., 2002) than MBL clouds at
5
comparable latitudes in the Northern Hemisphere. Regional model simulations (Gar-reaud and Mu ˜noz, 2004) suggest that a large-scale diurnal subsidence wave formed by the interaction of the coastal jet along the Chilean coast with dry convective heating over the western Andean slopes travels at least 1000 km over the SEP and leads to a strong diurnal cycle of subsidence at remote locations. Using improved observations
10
of how this wave influences the diurnal cycle of marine stratocumulus should be useful for assessing whether the diurnal variations of clouds in large scale models are well represented.
1.2 Motivation for the VOCALS regional experiment
The science issues described above are central to VOCALS (VAMOS
Ocean-Cloud-15
Atmosphere-Land Study), an international CLIVAR program to develop and promote scientific activities leading to improved understanding, model simulations, and predic-tions of the southeastern Pacific (SEP) coupled ocean-atmosphere-land system, on diurnal to interannual timescales. VOCALS is ultimately driven by a need for improved numerical model simulations of the coupled climate system in both the SEP and over
20
the wider tropics and subtropics. At the root of VOCALS’s approach to the problem is the premise that its solution requires the synergy between numerical modeling, field studies, and extended observations such as buoys and satellites. With this in mind, the VOCALS Regional Experiment (VOCALS-REx) was conceived. In this manuscript we present an overview of the hypotheses, instrumentation, sampling platforms, sampling
25
strategies, and missions conducted in pursuit of the science goals.
ACPD
10, 20769–20822, 2010VOCALS operations
R. Wood et al.
Title Page
Abstract Introduction
Conclusions References
Tables Figures
◭ ◮
◭ ◮
Back Close
Full Screen / Esc
Printer-friendly Version
Interactive Discussion
Discussion
P
a
per
|
Dis
cussion
P
a
per
|
Discussion
P
a
per
|
Discussio
n
P
a
per
|
hypotheses presented in Table 1, to evaluate our ability to model the important physical and chemical processes in the SEP, and to help evaluate the performance of satellite retrievals. The VOCALS-REx hypotheses are organized into two broad themes: (1) testing hypotheses related to the impacts of aerosols upon the microphysical and struc-tural properties of stratocumulus clouds and drizzle production; (2) testing hypotheses
5
related to the coupled ocean-atmosphere-land system.
2 VOCALS-REx study region and dates
VOCALS-REx took place during October and November 2008, engaging over 150 sci-entists from 40 institutions in 8 nations. A variety of operations within a limited domain of the SEP coupled climate system were conducted (Fig. 2). REx operations took place
10
in the domain 69–86◦W, 12-31◦S, with a concentration of sampling close to the 20◦S
latitude line. This parallel was chosen as it transects the heart of the SEP stratocu-mulus sheet (Klein and Hartmann, 1993; George and Wood, 2010), exhibits strong longitudinal microphysical contrasts (Bennartz, 2007; Wood et al., 2008; George and Wood, 2010; Bretherton et al., 2010), crosses a region where open cell formation is
15
frequently observed (Wood et al., 2008), and is impacted by mesoscale ocean eddies (e.g. Colbo and Weller, 2007; Toniazzo et al., 2010a).
Overall, the VOCALS-REx period was characterized by near normal atmospheric
conditions off northern Chile and southern Peru. However, significant variations in
MBL depth occurred during October when midlatitude troughs reached the VOCALS
20
region leading to four episodes (1–2 day long) of mid-tropospheric upward motion. In contrast, November exhibited less synoptic forcing and almost continuous subsidence (Rahn and Garreaud, 2010a,b; Toniazzo et al., 2010b).
In the following sections we first discuss the research platforms and the instrumen-tation used to make observations during VOCALS-REx, followed by the chief mission
25
ACPD
10, 20769–20822, 2010VOCALS operations
R. Wood et al.
Title Page
Abstract Introduction
Conclusions References
Tables Figures
◭ ◮
◭ ◮
Back Close
Full Screen / Esc
Printer-friendly Version
Interactive Discussion
Discussion
P
a
per
|
Dis
cussion
P
a
per
|
Discussion
P
a
per
|
Discussio
n
P
a
per
|
3 Platforms and Instrumentation
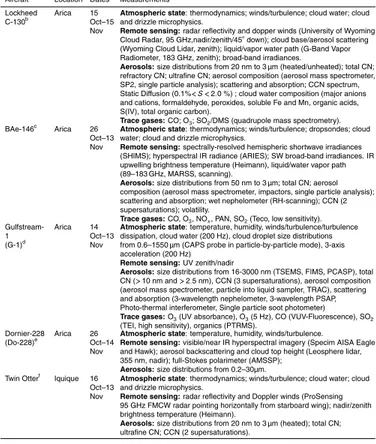
A total of five aircraft (NSF/NCAR C-130, the DoE G-1, the CIRPAS Twin Otter, the FAAM BAe-146, and the NERC Dornier 228, see Table 2) two research vessels (the NOAA R/V Ronald H. Brown, RHB, and the Peruvian IMARPE Jos ´e Olaya, see Ta-bles 3 and 4 respectively) sampled the lower atmosphere and upper-ocean during
5
REx. These mobile platforms were complemented by a number of ground-based ob-servational sites (Table 5).
3.1 Aircraft platforms
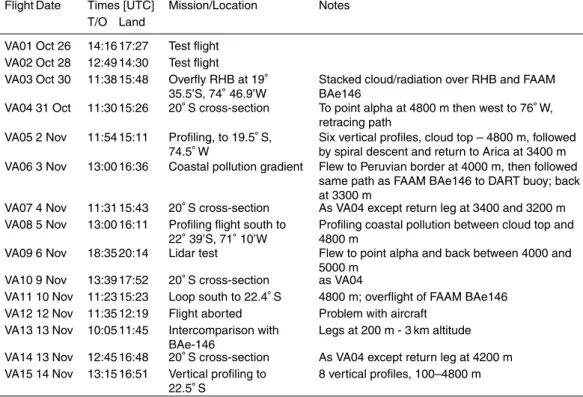
Three of the aircraft deployed in VOCALS-REx (C-130, G-1 and Twin Otter) were op-erational from 14 October to 15 November 2008, with the other two aircraft (BAe-146
10
and Do-228) operational from 26 October-15 November 2008. Table 2 shows the dates over which missions were flown, and Fig. 3 provides a graphical representation of the aircraft sampling as a function of day and longitude. Tables describing the specific aircraft missions are disussed below. The aircraft measurements are designed to crit-ically address several of the VOCALS hypotheses (Table 1), particularly those related
15
to aerosol-cloud-drizzle interactions and those involving the sources and sinks of at-mospheric aerosols.
3.1.1 NSF/NCAR Lockheed C-130
The NSF/NCAR C-130Q is operated by the Research Aviation Facility (RAF) at the National Center for Atmospheric Research (NCAR) in the United States. During REx
20
the C-130 flew missions up to 9 h in duration reaching 1600 km offshore, making it the
longest range aircraft used in REx. The C-130 has a large payload and carries instru-ments and sensors in pods and pylons on both wings. Details of the instrumentation payload on the C-130 are given in Table 2. The aircraft is flown at an airspeed of
ap-proximately 100 m s−1 for boundary layer sampling. Details of the missions flown in
25
ACPD
10, 20769–20822, 2010VOCALS operations
R. Wood et al.
Title Page
Abstract Introduction
Conclusions References
Tables Figures
◭ ◮
◭ ◮
Back Close
Full Screen / Esc
Printer-friendly Version
Interactive Discussion
Discussion
P
a
per
|
Dis
cussion
P
a
per
|
Discussion
P
a
per
|
Discussio
n
P
a
per
|
3.1.2 FAAM BAe-146
The Facility for Airborne Atmospheric Measurements (FAAM) BAe-146 aircraft is
op-erated by a joint agreement between the Met Office and the Natural Environment
Re-search Council (NERC) in the United Kingdom. The BAe-146 served as the medium range aircraft operated in REx, flying missions of typically 5 hours and sampling up
5
to 900 km offshore. The BAe-146 has a large payload and carries instruments and
sensors in pods and pylons on both wings. Details of the instrumentation payload on the BAe-146 are given in Table 2. The aircraft is flown at an airspeed of approximately
100 m s−1 for boundary layer sampling. Details of the missions flown in REx are given
in Table 7.
10
3.1.3 DoE Gulfstream-1 (G-1)
The Department of Energy Gulfstream-1 (G-1) is operated by the Research Aircraft Facility (RAF) at the Pacific Northwest National Laboratory in the United States. The G-1 served as a medium range aircraft in REx, with sampling out to 800 km from the
coast. The aircraft is flown at an airspeed of approximately 100 m s−1 for boundary
15
layer sampling. Details of the instrumentation payload on the G-1 are given in Table 2. Details of the missions flown in REx are given in Table 8.
3.1.4 NERC Dornier-228 (Do-228)
The NERC Dornier-228 is operated by the Airborne Research and Survey Facility (ARSF) of the Natural Environment Research Council (NERC) in the United Kingdom.
20
Its main role in VOCALS-REx was remote sensing of clouds out to 76◦W, using lidar,
a hyperspectral imager and polarimeter. Details of the instrumentation payload on the Do-228 are given in Table 2. Details of the missions flown in REx are given in Table 9. Most flights took place at an altitude of 4–5 km, with the remainder profiling the free troposphere to measure in-situ aerosol concentration. Typically, the Dornier overflew
ACPD
10, 20769–20822, 2010VOCALS operations
R. Wood et al.
Title Page
Abstract Introduction
Conclusions References
Tables Figures
◭ ◮
◭ ◮
Back Close
Full Screen / Esc
Printer-friendly Version
Interactive Discussion
Discussion
P
a
per
|
Dis
cussion
P
a
per
|
Discussion
P
a
per
|
Discussio
n
P
a
per
|
the flight path of the FAAM BAe146 with a similar airspeed (∼100 m s−1) and/or C-130
especially during the 20◦S missions (see below).
3.1.5 CIRPAS Twin Otter
The Twin Otter operated by the Center for Interdisciplinary Remotely Piloted (CIRPAS) was instrumented to make turbulence, cloud microphysics, and aerosol measurements
5
(Table 2) in the near coastal region of the VOCALS domain at 20◦S, 72◦W (a location
termed here as Point Alpha). This relatively slow-moving aircraft (∼60 m s−1) made 5 hr
flights originating from Iquique Chile that allowed for 3 hrs of sampling at Point Alpha on 18 flights (Table 10).
3.2 Ship platforms
10
The two ships in VOCALS-REx sampled different locations at different times. The R/V
Ronald H. Brown was operational for two phases, the first from 25 October to 3 Novem-ber 2008 and the second from 10 NovemNovem-ber to 2 DecemNovem-ber 2008. The Peruvian R/V Jos ´e Olaya operated from 2–17 October 2008. Figure 3 provides a graphical repre-sentation of the ship sampling as a function of day and longitude. Figures describing
15
the specific ship sampling strategies are disussed below. The ship measurements are designed to critically address several of the VOCALS hypotheses (Table 1), particularly those related to the upper ocean, aerosol-cloud-drizzle interactions, the physical and chemical interactions between the upper ocean and the lower atmosphere, and those involving the sources and sinks of atmospheric aerosols.
20
3.2.1 NOAA R/V Ronald H. Brown
The R/V Ronald H. Brown is operated by the National Oceanographic and Atmo-spheric Administration (NOAA), and served as the primary shipborne sampling
ACPD
10, 20769–20822, 2010VOCALS operations
R. Wood et al.
Title Page
Abstract Introduction
Conclusions References
Tables Figures
◭ ◮
◭ ◮
Back Close
Full Screen / Esc
Printer-friendly Version
Interactive Discussion
Discussion
P
a
per
|
Dis
cussion
P
a
per
|
Discussion
P
a
per
|
Discussio
n
P
a
per
|
also provided the means to deploy and recover moorings, drifters, and profiling floats during VOCALS REx. The RHB payload was designed to sample both the upper ocean and the lower atmosphere during REx, and details are given in Table 3. The multi-week RHB cruises with 6 daily upper air soundings and continuous measurements by most sensors are able to capture details of the MBL diurnal variations and
aerosol-cloud-5
drizzle evolution in a way that the aircraft platforms cannot.
3.2.2 Peruvian R/V Jos ´e Olaya
The Jos ´e Olaya is operated by the Instituto del Mar del Per ´u (IMARPE) and operated in Peruvian near-coastal waters to provide extensive sampling of the upper ocean, with additional atmospheric measurements (Table 4). The sampling strategy (see
be-10
low) was designed to examine the coastal upwelling region off Pisco-San Juan and
extended from the Peruvian coast to 100–300 km offshore. The upper and lower
at-mosphere, the upper ocean property distribution and circulation, the biogeochemical characteristics, the plankton community structure as well as fishery responses were measured in a comprehensive, multidisciplinary basis. Details on the instrumentation
15
onboard the Olaya are provided in Table 4.
The NCAR Earth Observing Laboratory (EOL) deployed a GAUS (GPS Advanced Upper-air Sounding systems) radiosonde station on the Jos ´e Olaya during VOCALS with sondes launched by IMARPE and IGP (Instituto Geofsico del Per ´u) and IRD (In-stitut pour le R ´echerche et Dev ´eloppement) scientists. A total of 133 soundings were
20
launched at varying intervals from 30 September to 17 October 2008. The launch
sites were predominately within an area about 200 km offthe coast of the Ica region of
ACPD
10, 20769–20822, 2010VOCALS operations
R. Wood et al.
Title Page
Abstract Introduction
Conclusions References
Tables Figures
◭ ◮
◭ ◮
Back Close
Full Screen / Esc
Printer-friendly Version
Interactive Discussion
Discussion
P
a
per
|
Dis
cussion
P
a
per
|
Discussion
P
a
per
|
Discussio
n
P
a
per
|
3.3 Fixed location sites
3.3.1 Paposo
Extensive aerosol and meteorological measurements were made at two sites near
Pa-poso (25◦01′S, 70◦28′W) on the Northern Chilean coast (see map Figs. 2 and 4). In
terms of the flow in the MBL, Paposo sits upwind of the primary focus area along the
5
20◦S parallel and the measurements are designed to help constrain the physical and
aerosol properties of airmassess leaving the continent to be advected over the broader SE Pacific region. Two sites were used near Paposo (Table 5) on the Northern Chilean coast. In-situ aerosol physical and chemical measurements, and meteorological
sam-pling, were conducted at an elevated (upper) site (25◦00′22.55′′S, 70◦27′02.01′′W,
10
690 m a.s.l.) in the coastal range immediately adjacent to the ocean (1.7 km east of the shore). Lidar profiles and sounding launches were made from a lower site near
sea-level in the village of Paposo (25◦00′34.41′′S, 70◦27′53.64′′W, 20 m asl) situated
100 m from the shore and 1.5 km to the WSW of the elevated site.
The elevated Paposo site is close to the peak of the hill in the coastal range in which
15
it is situated (Fig. 4). Meteorological measurements from an automatic weather sta-tion at the upper Paposo site were started on 24 July 2008 and continued through the end of November 2008. During the period of intensive REx sampling at Paposo (17 October–15 November 2008), the upper site was almost continually within the ma-rine boundary layer (MBL), although earlier in the season the inversion was
occasion-20
ally lower which allowed sampling above the MBL. Table 5 details the measurements made at the upper Paposo site. Aerosol sampling was carried out using a custom-made multidirectional aerosol inlet and a multiport sampling configuration (see Fig. 4), with additional sampling lines for aerosols during 4–15 November. The sampling lines were used to connect with the scanning mobility particle spectrometer (SMPS),
opti-25
cal particle counter (OPC), nephelometers, aethalometer and ozone analyzer, and to
collect submicron (<1 µm diameter) aerosols on filters for chemical analysis. Aerosol
ACPD
10, 20769–20822, 2010VOCALS operations
R. Wood et al.
Title Page
Abstract Introduction
Conclusions References
Tables Figures
◭ ◮
◭ ◮
Back Close
Full Screen / Esc
Printer-friendly Version
Interactive Discussion
Discussion
P
a
per
|
Dis
cussion
P
a
per
|
Discussion
P
a
per
|
Discussio
n
P
a
per
|
radiation measurements at the upper site were made by the University of Chile, and these measurements are described further in (Munoz et al., 2010).
At the lower Paposo site, an eye-safe 1.574 µm lidar, a weather station, and a sound-ing system were installed at the Paposo foothill site near the coast (Table 5 and map Fig. 4). The lidar was primarily vertically-pointing but some slant path scans were also
5
performed. An identical set of meteorological parameters to that measured at the up-per site was measured at the lower site. Multiple soundings up-per day were made from the site (Table 5 provides details of the launch times).
3.3.2 Paranal
A suite of aerosol measurements (see Table 5) in the free-troposphere were also made
10
for just under three weeks (17 October to 4 November) at the high altitude European
Southern Observatory at Paranal (24◦37′39.00′′S, 70◦24′17.85′′W, 2625 m a.s.l.), see
map Fig. 4.
3.3.3 Iquique
The NCAR Earth Observing Laboratory (EOL) deployed a GAUS (GPS Advanced
15
Upper-air Sounding systems) radiosonde station located in Iquique at the
Universi-dad Arturo Prat Marine Sciences Campus (20◦16’15”S, 70◦07’52”W, 15 m asl). The
stations was operated with the assistance of staffand students (see map Fig. 4). The
launch site was on a steep slope, approximately 100 meters inland and 20 meters above the shoreline. A total of 192 radiosondes were launched at 4 hourly intervals
20
ACPD
10, 20769–20822, 2010VOCALS operations
R. Wood et al.
Title Page
Abstract Introduction
Conclusions References
Tables Figures
◭ ◮
◭ ◮
Back Close
Full Screen / Esc
Printer-friendly Version
Interactive Discussion
Discussion
P
a
per
|
Dis
cussion
P
a
per
|
Discussion
P
a
per
|
Discussio
n
P
a
per
|
3.4 IMET Buoy
The Improved Meteorology (IMET) moored buoy is situated at approximately 20◦S,
85◦W (see Table 5 for precise location) at the western end of the sampling
con-ducted during VOCALS-REx. The mooring has been operational since October 2000 and has provided an excellent intermediate-term record of both the surface
meteo-5
rology/radiation, and of the upper ocean thermodynamic and dynamic structure. The meteorological and radiation measurements (Table 5) on the IMET buoy are described and their performance evaluated in Colbo and Weller (2009). The upper ocean mea-surements include temperature profiles, sea-surface temperature, salinity and currents. Further details can be found on the Upper Ocean Processes group at WHOI website
10
(Table 5).
3.5 DART/SHOA Buoy
The Deep-ocean Assessment and Reporting of Tsunamis/Servicio Hidrogr ´afico y Oceanogr ´afico de la Armada de Chile (DART/SHOA) moored buoy at approximately
19.5◦S, 74◦W (see Table 5 for precise location) has been instrumented with
meteoro-15
logical and oceanographic measurements from October 2006 through January 2010. Meteorological measurements similar to those on the IMET buoy (Colbo and Weller, 2009) were made during much of this period. Upper ocean measurements of temper-ature and salinity at 14 depths were also made from 2006 onwards.
4 Sampling strategies
20
4.1 Matching sampling strategy to the VOCALS hypotheses
The REx sampling strategy was carefully designed and coordinated between platforms
to test key VOCALS hypotheses listed in Table 1. Briefly, the VOCALS
ACPD
10, 20769–20822, 2010VOCALS operations
R. Wood et al.
Title Page
Abstract Introduction
Conclusions References
Tables Figures
◭ ◮
◭ ◮
Back Close
Full Screen / Esc
Printer-friendly Version
Interactive Discussion
Discussion
P
a
per
|
Dis
cussion
P
a
per
|
Discussion
P
a
per
|
Discussio
n
P
a
per
|
– H1a: aerosol variations significantly affect drizzle formation.
– H1b/d: drizzle-induced aerosol scavenging is required for POC formation and
maintenance.
– H1c: cloud droplet radii are smaller near the coast due to anthropogenic aerosol
emissions from South America.
5
In the REx region, both repeated surveying and sampling of specific features are use-ful for testing these hypotheses. Repeated sampling of the persistent gradients in
aerosols, clouds and precipitation between nearshore and offshore regimes allows
ro-bust features of the gradient region to stand out and can be used to control for the covariability between aerosols, cloud macrostructure, and meteorology present on
in-10
dividual days. POCs present extreme examples (typically POCs are among the very cleanest and most strongly drizzling of airmasses in the SEP) that challenge our physi-cal understanding of cloud-aerosol-precipitation interaction. Thus, an aircraft sampling strategy mainly focused on repeated sampling across the aerosol gradient region (with
a few missions at the end parallel to the coast to characterize the offshore aerosol
dis-15
tribution upwind of the main REx study region), interspersed by opportunistic sampling of any POCs within range. Because of the desire for repeated sampling strategies, the aircraft favored particular times of day and did not attempt to characterize the diur-nal variability of the cloud-topped boundary layer. The ship, mooring, and land-based sampling was aimed at complementing the aircraft through a better characterization
20
of diurnal variability along 20◦S (particularly with the RHB and the Iquique sounding
site) and of the upstream anthropogenic aerosol sources (the Paposo and Paranal land sites).
The observational VOCALS coupled ocean-atmospherehypotheses in Table 1 can
be summarized:
25
– H2b/d: the offshore ocean mixed layer SST and salinity are decreased by ocean
mesoscale eddy transports and entrainment from below. Oceanic DMS affects
ACPD
10, 20769–20822, 2010VOCALS operations
R. Wood et al.
Title Page
Abstract Introduction
Conclusions References
Tables Figures
◭ ◮
◭ ◮
Back Close
Full Screen / Esc
Printer-friendly Version
Interactive Discussion
Discussion
P
a
per
|
Dis
cussion
P
a
per
|
Discussion
P
a
per
|
Discussio
n
P
a
per
|
– H2c: a subsidence wave driven by slope heating on the Andes measurably affects
the diurnal cycle of stratocumulus.
REx tackled these hypotheses mainly with a ship-based strategy (RHB and Jos ´e Olaya), through sampling of clouds and atmospheric profiles through the diurnal cy-cle for H2c and survey-style sampling for H2b/d.
5
For both sets of hypotheses, IMET/DART mooring observations, satellite observa-tions, and modeling on a range of scales are envisioned as vital complements to the in-situ observations.
4.2 Aircraft missions
The following aircraft mission strategies were used during REx:
10
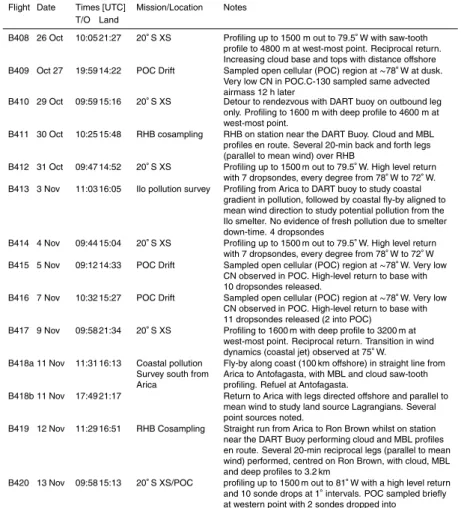
1. Cross-Section (XS) missionsalong 20◦S latitude (or other proximal latitudes) from
the coast to close to the IMET buoy at 85◦W (mission plan shown in Fig. 5) aimed
to sample longitudinal gradients in clouds, the MBL, and aerosols. A total of
12 Cross-Section missions were flown along 20◦S during REx (mission details
shown in Fig. 6), with more flown along nearby latitudes (especially by the G-1
15
aircraft, see Table 8).
2. POC-drift missions which target either existing pockets of open cells (POCs)
within overcast stratocumulus, or areas prone to POC development, and track these as they advect with the flow. A typical flight plan is shown in Fig. 7. On one occasion (27/28 October 2008) it was possible to sample the same advected
20
POC with two aircraft missions spaced approximately 12 h apart;
3. Stacked cloud and/or radiation missions in which one or two aircraft sample a
cloudy boundary layer airmass, typically using stacked legs 50–100 km in length. For two-aircraft missions, the upper aircraft primarily served as a radiation/remote sensing platform. All the aircraft other than the C-130 carried out missions of this
ACPD
10, 20769–20822, 2010VOCALS operations
R. Wood et al.
Title Page
Abstract Introduction
Conclusions References
Tables Figures
◭ ◮
◭ ◮
Back Close
Full Screen / Esc
Printer-friendly Version
Interactive Discussion
Discussion
P
a
per
|
Dis
cussion
P
a
per
|
Discussion
P
a
per
|
Discussio
n
P
a
per
|
type. All Twin Otter missions were of this type, and additionally were carried out
at the same location (at so-called “Point Alpha”, 20◦S, 72◦W);
4. Pollution Survey missionsin which aircraft sampled within a few hundred km of the
Peruvian and Chilean coasts, with the aim of characterizing the lower atmosphere in the vicinity of pollution source regions. Figure 2 shows the typical locations of
5
these flights;
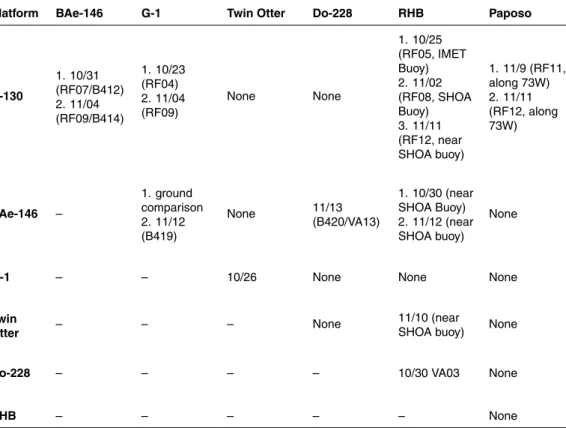
5. Intercomparison flights, either aircraft-aircraft or to compare aircraft and ship
mea-surements. The summary of intercomparisons is given in Table 11.
Tables 6, 7, 8, 9, and 10 present the specific missions flown by the C-130, BAe-146, G-1, Do228, and Twin Otter respectively.
10
4.3 Ship sampling
4.3.1 Peruvian R/V Jos ´e Olaya
Figure 8 shows the track of the R/V Jos ´e Olaya during the VOCALS REx cruise (2– 17 October 2008). A total of 133 radiosonde soundings were acquired at varying spatio-temporal intervals from 30 September to 17 October 2008. Launch sites were
15
predominately within the upwelling zone, about 200 km from the coast of the Pisco-San Juan upwelling region. Temperature, salinity and currents were measured to charac-terize the physical properties of the upwelling plume and the associated thermal front. A cluster of 8 surface drifters were deployed across the upwelling front in order to study
the advective and diffusive processes inside this feature. The glider (autonomous
un-20
derwater vehicle) mission was designed to examine the high-resolution structure and
dynamics of the upwelling plume and thermal front offPisco between 10 km and 100 km
from the coast. The distribution of biogeochemical and biological parameters as well as fish abundance were also sampled to study the feedback of ocean/atmosphere in-teractions on biological and fishery activity.
ACPD
10, 20769–20822, 2010VOCALS operations
R. Wood et al.
Title Page
Abstract Introduction
Conclusions References
Tables Figures
◭ ◮
◭ ◮
Back Close
Full Screen / Esc
Printer-friendly Version
Interactive Discussion
Discussion
P
a
per
|
Dis
cussion
P
a
per
|
Discussion
P
a
per
|
Discussio
n
P
a
per
|
4.3.2 NOAA R/V Ronald H. Brown
Figure 9 shows the track of the NOAA R/V Ronald H. Brown (RHB) during the VOCALS REx cruise (25 October to 2 December 2008). The cruise was planned and carried out as two legs: Leg 1 took place between 29 September to 3 November 2008 (arriving in the VOCALS-REx domain on 24 October 2008) and the RHB spent the majority of the
5
time stationed at the IMET and DART mooring where recovery and redeployment of the moorings took place; Leg 2 took place between 9 November and 2 December 2008) and involved mapping the structure of the upper ocean and observing the atmosphere exclusively in the VOCALS-REx domain. After the RHB arrived in the VOCALS-REx
domain, all of the sampling took place between 18◦S and 22◦S. Both Legs 1 and 2
10
involved studies of the ocean, the atmosphere, and their coupling as part of VOCALS-REx. Coordinated sampling with research aircraft working from Arica and Iquique took place during both cruises, with the majority of coordinated sampling taking place during Leg 2 (see Tables 6 to 9 for details of RHB-aircraft cosampling.
A total of 210 radiosondes were obtained at 4 hour intervals within the marine
stra-15
tocumulus region. The ship sampled multiple times across relatively sharp transitions of cloud coverage including clear to broken to overcast stratocumulus cloud condi-tions. It was overcast approximately 80% of the time. Drizzle was prevalent:
drizzle-containing cells with significant radar reflectivity (Z >0 dBZ) were observed within a
60 km radius of the ship roughly half the time. The RHB research cruise for
VOCALS-20
Rex was designed to address important aspects of both (1) aerosol-cloud-drizzle hy-potheses and (2) coupled ocean-atmosphere hyhy-potheses.
Aerosol-cloud-drizzle interactions vary in both space and time at a multitude of scales. The ship provided a platform to investigate in detail aerosol distributions and composition, including diurnal patterns during slow transects over much smaller
re-25
ACPD
10, 20769–20822, 2010VOCALS operations
R. Wood et al.
Title Page
Abstract Introduction
Conclusions References
Tables Figures
◭ ◮
◭ ◮
Back Close
Full Screen / Esc
Printer-friendly Version
Interactive Discussion
Discussion
P
a
per
|
Dis
cussion
P
a
per
|
Discussion
P
a
per
|
Discussio
n
P
a
per
|
groups, see Hawkins et al. (2010)), and highly accurate standards as references (such as ion chromatography) that are complementary to the aircraft-based data sets. In addition, the measurement of Radon on the RHB permits an assessment of the time that airmasses have spent over the ocean. The RHB studies of aerosol properties provide a comprehensive basis for addressing the variability in physicochemical
prop-5
erties. These measurements also serve as the basis for comparison of the sources and composition of the aerosol particles, providing comprehensive information with which to compare to satellite-retrieved properties.
The main objectives of the oceanographic field work conducted from the R/V Ron Brown (Legs 1 and 2) were: (i) to map the mean and eddy (mesoscale/submesoscale)
10
property distribution within the upper ocean during VOCALS-REx; (ii) to deploy La-grangian floats and drifters within the SEP; (iii) to recover and re-deploy the STRATUS and DART moorings. The synoptic survey across the SEP region included the collec-tion of 35 CTD (Conductivity, Temperature, Depth profiles) up to 2000 m, and of 438 UCTD (Underway CTD) profiles, ranging between 200 and 800 m, to map the
merid-15
ional distribution of properties across the SEP along three distinct latitude lines (Fig. 9). During the surveys, spatial and temporal sampling was increased to resolve a number of fronts and eddies, including 4 cyclones, 2 anticyclones, the current system and
up-welling front at 21.5◦S, and several fronts. Microstructure profiles to quantify mixing
rates were obtained using a Vertical Microstructure Profiler (VMP) at 15 different
loca-20
tions that included the centers and margins of several of the eddies/fronts. The velocity structure of the upper 300–500 m, along the ship track, was observed by the ship’s Acoustic Doppler Current Profiler (ADCP) – thus providing direct observations of the velocity field within the eddies, fronts and boundary currents to complement the prop-erty measurements. The ensemble of eddy measurements, in particular, is critical to
25
ACPD
10, 20769–20822, 2010VOCALS operations
R. Wood et al.
Title Page
Abstract Introduction
Conclusions References
Tables Figures
◭ ◮
◭ ◮
Back Close
Full Screen / Esc
Printer-friendly Version
Interactive Discussion
Discussion
P
a
per
|
Dis
cussion
P
a
per
|
Discussion
P
a
per
|
Discussio
n
P
a
per
|
provide long-term context to the synoptic measurements – together with the instru-ments recovered and re-deployed on the IMET/STRATUS and DART buoys.
5 Satellite datasets produced specifically for VOCALS-REx
5.1 Geostationary Operational Environmental Satellites, GOES-10
5.1.1 Visible Infrared Solar-Infrared Split Window Technique (VISST)
5
Cloud and radiation parameters at 4-km resolution were derived from the Tenth
Geosta-tionary Operational Environmental Satellite imager (GOES-10), located at 60◦W, using
techniques developed at NASA Langley Research Center (LaRC). The GOES-10 data
were analyzed every half hour for bounded by 10◦S, 30◦S, 65◦W, and 90◦W for the
period between 11 September and 1 December 2008 and provided in near-real time for
10
mission planning and analysis. Clouds were detected using the method of Minnis et al. (2008) and cloud properties were retrieved during the daytime using the Visible Infrared Shortwave-infrared Split-window Technique (VISST). At night, cloud properties were retrieved using the Shortwave-infrared Infrared Split-window Technique (SIST). The methods are described in detail for application to MODerate-resolution Imaging
Spec-15
troradiometer (MODIS) data by Minnis et al. (2009). The VISST uses the 0.65, 3.9, 10.8, and 12.0 µm channels, while the SIST uses the same channels minus the 0.65 µm data. The GOES-10 0.65 µm channel was calibrated against the Terra MODIS 0.64 µm channel using the technique of Minnis et al. (2002). The available derived parameters and means of accessing the data are similar to those described by (Palikonda et al.,
20
2006). Both pixel-level and 0.5×0.5◦ averages are available each hour in image and
digital form1. The VISST and SIST assume that only single-layer clouds are in a given
pixel. In addition to the standard approach described by Minnis et al. (2010), cloud-top height and pressure were also retrieved using the method described by Zuidema et al. (2009). One additional parameter, a multilayer cloud identifier was computed
25
1
ACPD
10, 20769–20822, 2010VOCALS operations
R. Wood et al.
Title Page
Abstract Introduction
Conclusions References
Tables Figures
◭ ◮
◭ ◮
Back Close
Full Screen / Esc
Printer-friendly Version
Interactive Discussion
Discussion
P
a
per
|
Dis
cussion
P
a
per
|
Discussion
P
a
per
|
Discussio
n
P
a
per
|
for each pixel using the approach of Pavolonis and Heidinger (2004). In addition to the cloud properties, spectral radiances and estimates of the top-of-atmosphere shortwave albedo and outgoing longwave radiation are included.
Figure 10 shows an example of three parameters for a GOES-10 image taken at 15:45 UTC, 27 October 2010. The pseudo-color RGB image (Fig. 10a) shows low
5
clouds in the orange and peach shades with high cirrus clouds appearing white, gray,
and magenta. The effective cloud temperatures Tc are displayed in Fig. 10b for an
abbreviated range of 273 K< Tc<300 K to better show variations in stratocumulus cloud
temperatures. Temperatures less than 273 K are indicated in the maroon shade. For
this case,Tc ranges from 274 K to 284 K for the marine stratocumulus clouds. Smaller
10
values are evident where thin cirrus clouds occur over the low clouds. Cloud optical depths (Fig. 10c) range from less than 1 at some cloud edges to more than 40 near
18◦S, 78◦W. The VISST-derived droplet e
ffective radius, re, (Fig. 10d) varies from
about 7 to 25µm across the scene with most of the largest values occurring around the edges of the POCs. The smallest droplets are mostly near the coast. The pixel-level
15
products, exemplified in Fig. 10a–d, are used to produce 0.5×0.5◦ regional means
at each half hour for many of the cloud and radiation parameters (Palikonda et al.,
2006). Examples of 0.5×0.5◦regionally-averaged cloud top-heightZtand liquid water
path (LWP) are shown in Fig. 10e, f. The Zt values estimated as in Minnis et al.
(2008) range from less than 1 km up to more than 3 km in the southwestern portion
20
of the domain. Higher clouds near the center of the domain correspond to the thin cirrus clouds over the stratocumulus deck. The heights based on the Zuidema et al. (2009) technique are generally lower (not shown). The cloud LWP ranges from less
than 50 g m−2 along the coast to over 200 g m−2 near the center of the domain. The
LaRC cloud properties are based on near-real time retrievals. A refined dataset using
25
ACPD
10, 20769–20822, 2010VOCALS operations
R. Wood et al.
Title Page
Abstract Introduction
Conclusions References
Tables Figures
◭ ◮
◭ ◮
Back Close
Full Screen / Esc
Printer-friendly Version
Interactive Discussion
Discussion
P
a
per
|
Dis
cussion
P
a
per
|
Discussion
P
a
per
|
Discussio
n
P
a
per
|
5.1.2 Gridded cloud cover product from the University of Manchester/Met Office
Thermal infrared data from GOES-10 (Channel 4, 10.7 µm), converted to netCDF for-mat and archived on the VOCALS data archive (see Sect. 8), have been used to gen-erate a dataset documenting the variability in cloud amount during the VOCALS-REx period. The GOES-10 data were analyzed between 1 October and 8 December 2008
5
in a region from 3.5–31.5◦S and 68.5–96.5◦W. Note that this is a more extensive
re-gion than for the VISST GOES-10 products described above. Cloud-classification is performed on all available GOES-10 scans (typically every 15 to 30 min) at a horizontal
resolution of 4 km, and cloud cover fractions are gridded at 0.25×0.25◦resolution.
Fur-ther details are given in Abel et al. (2010), and the dataset is available on the VOCALS
10
archive, described below.
6 MODIS subset
To browse available MODIS imagery from NASA’s Terra and Aqua satellites for the VOCALS-REx study region, there is a dedicated subset available on the MODIS
Rapid-fire website http://rapidRapid-fire.sci.gsfc.nasa.gov/subsets/?subset=VOCALS.
15
7 Other complementary products for VOCALS-REx
7.1 FLEXPART particle dispersion model
The FLEXPART Lagrangian particle dispersion model (Stohl et al., 2005) is used to
simulate pollution transport and back-trajectories in support of VOCALS2. FLEXPART
has been used successfully to study aerosol-cloud interactions (Avey et al., 2007;
20
Brioude et al., 2009). FLEXPART was driven by the Global Forecast System (GFS) 2
ACPD
10, 20769–20822, 2010VOCALS operations
R. Wood et al.
Title Page
Abstract Introduction
Conclusions References
Tables Figures
◭ ◮
◭ ◮
Back Close
Full Screen / Esc
Printer-friendly Version
Interactive Discussion
Discussion
P
a
per
|
Dis
cussion
P
a
per
|
Discussion
P
a
per
|
Discussio
n
P
a
per
|
data of the National Centers for Environmental Prediction (NCEP) with a horizontal
resolution of 0.5×0.5◦, with a temporal resolution of 3 h (analyses at 00:00, 06:00,
12:00, 18:00 UTC; 3 h forecasts at 03:00, 09:00, 15:00, 21:00 UTC), and 26 vertical levels. Millions of particles in FLEXPART were transported both by the resolved GFS winds and parameterized subgrid motions.
5
Forward simulations were performed to simulate air pollution transport from anthro-pogenic and biomass burning sources. A sulfur dioxide passive tracer (including direct emissions of sulfate) is released separately from each copper smelters and power plants and from the Lascar vocalno in Chile and South America, based on an inventory provided by Laura Gallardo. A sulfur dioxide passive tracer is also released from
an-10
thropogenic area sources in South America using the EDGAR 3.2 emission inventory. Emissions of a CO passive tracer from Southern Hemisphere biomass burning (south
of 15◦N) have been calculated using fire detection data, information on land use with
emission factors from Andreae and Merlet (2001). All species are transported in the model for a duration of up to 10 days, after which they are removed from the
simula-15
tion. Concentration fields were output every hour as 1 h averages at 1×1◦grid spacing
above the broader Pacific Ocean and South America, and 0.25×0.25◦grid spacing over
the VOCALS-REx domain. The FLEXPART tracers are only 10 days old and must be considered as mixing ratios above background.
In addition, backward simulations started along the DOE G-1 flight tracks were
cal-20
culated3. Back-trajectories are started from boxes along the flight track every time the
altitude of the aircraft varies by more than 100 m, or the difference in latitude or
longi-tude is larger than 0.1◦, or if 2 min of flight have elapsed. A total of 10 000 particles
were released randomly from each box. The so-called “retroplumes” are then calcu-lated backward in time over 8 days. The model output consists of the residence time
25
of the particles in a given volume weighted by the local atmospheric density. When convolved with gridded emission fluxes from an emission inventory, a model-calculated
3
ACPD
10, 20769–20822, 2010VOCALS operations
R. Wood et al.
Title Page
Abstract Introduction
Conclusions References
Tables Figures
◭ ◮
◭ ◮
Back Close
Full Screen / Esc
Printer-friendly Version
Interactive Discussion
Discussion
P
a
per
|
Dis
cussion
P
a
per
|
Discussion
P
a
per
|
Discussio
n
P
a
per
|
mixing ratio of the emitted species at the aircraft is obtained. The available products from each box include the surface residence time of the particles, the total column
residence time, the anthropogenic CO and SO2contribution using the EDGAR 3.2
in-ventory, the SO2 contribution from point sources and urban area using an emission
inventory provided by Scott Spak4. Similar products are also available for the Ronald
5
H. Brown (RHB). Specifically, backtrajectories are released every 3 h along the RHB track. EDGAR 3.2 inventory and the point source inventory provided by Laura Gallardo are used.
8 VOCALS data management
The NCAR/EOL provided data management support, coordination, and a long-term
10
archive for VOCALS datasets. Details regarding VOCALS Data Management can be
found on the VOCALS Project web page or directly5. This web page contains the
VOCALS data policy, instructions for data submission, relevant documentation, links to related projects data, and access to the distributed VOCALS long-term archive [i.e. Master List (ML) of VOCALS International Datasets]. The ML contains direct access to
15
all datasets organized by data category and data source site with associated dataset
documentation. In addition, the VOCALS-Rex Field Catalog6 used during the field
phase to provide operations and mission/scientific reports, operational and preliminary research imagery/products is available as “browse” tool for use by researchers in the post-field analysis phase and is included as part of the archive.
20
4
Available at http://www.cgrer.uiowa.edu/VOCA emis/
5
Available at http://www.eol.ucar.edu/projects/vocals/dm/index.html
6
ACPD
10, 20769–20822, 2010VOCALS operations
R. Wood et al.
Title Page
Abstract Introduction
Conclusions References
Tables Figures
◭ ◮
◭ ◮
Back Close
Full Screen / Esc
Printer-friendly Version
Interactive Discussion
Discussion
P
a
per
|
Dis
cussion
P
a
per
|
Discussion
P
a
per
|
Discussio
n
P
a
per
|
9 Conclusions
The VOCALS Regional Experiment (VOCALS-REx) was an international field experi-ment designed to examine critical aspects of the coupled climate system of the South-east Pacific region. VOCALS-REx took place during October and November 2008
in a domain 69–86◦W, 12–31◦S. Sampling with a variety of platforms including two
5
ship, five research aircraft, land sites and two instrument moorings will ensure that
researchers have a number of different observational angles with which to test the
VO-CALS hypotheses. The purpose of this paper is to bring together in one document the scientific goals, the platforms and instrumentation, and the sampling strategies em-ployed during the program. It is hoped that this will serve the VOCALS research
com-10
munity by providing a central location that describes the essence of the field program. Perhaps more importantly, we hope that it will help to provide an important legacy that will be available to researchers over the coming years.
Appendix A
15
Acronyms
Table A1 provides details of the common acronyms used in this manuscript.
Acknowledgements. It is practically impossible to acknowledge all the people who have con-tributed to VOCALS, but we can try to pay tribute to the various groups that have dedicated
their resources, efforts, sweat and tears to the planning and execution of the program. First,
20
we need to thank the teams led by Bob Weller at WHOI that deployed and maintained with an-nual cruises the IMET buoy which has provided almost a decade of high quality meteorological, radiation and oceanographic measurements. Thanks to Chris Fairall and coworkers at ESRL, and the scientists involved in the EPIC Stratocumulus cruise, these ship-borne data have led
to a wealth of scientific data. We are extremely grateful to the support staff, crew and scientists
25
ACPD
10, 20769–20822, 2010VOCALS operations
R. Wood et al.
Title Page
Abstract Introduction
Conclusions References
Tables Figures
◭ ◮
◭ ◮
Back Close
Full Screen / Esc
Printer-friendly Version
Interactive Discussion
Discussion
P
a
per
|
Dis
cussion
P
a
per
|
Discussion
P
a
per
|
Discussio
n
P
a
per
|
the CIRPAS Twin Otter, the UK NERC Dornier 228, and, in the 2010 CUpEx phase, the Chilean DGAC King Air), the two ships (the NOAA Ronald H. Brown, and the Peruvian IMARPE Jos ´e Olaya), and the land stations at Iquique and Paposo. The NCAR Earth Observing Laboratory is thanked for their dedication to coordinating and executing field logistics and data archive support for VOCALS Rex. The cooperation of hosts and collaborators in Chile and Peru who 5
provided various critical facilities and support during REx is gratefully acknowledged. These
include dedicated stafffrom the Chilean Weather Service (DMC), Ana Maria Cordova at
Uni-versidad de Valparaiso, Ricardo Mu ˜noz, Jos ´e Rutllant and fellow students at UniUni-versidad de
Chile, Rosalino Fuenzalida, and fellow staffand students at Universidad Arturo Prat, Iquique,
Chile; Yamina Silva and Boris Dewitte at Instituto Geof´ısico del Per ´u, Lima, Peru. Sounding
10
operations were led by Tim Lim and quality control by Kate Young, both of NCAR/EOL. We also thank the Natural Environment Research Council, UK, for supporting the UK University con-tribution to VOCALS through grant NE/F019874/1, and to FAAM, Directflight Ltd, Avalon Engi-neering Ltd, and ARSF, for providing the BAe146 and Dornier-228 aircraft respectively. Without
the untiring efforts of the staffof these Facilities the science objectives of VOCALS would not
15
have been met. The Swedish Research Council for Environment, Agricultural Sciences and Spatial Planning (FORMAS) provided support for Swedish participation in VOCALS-Rex. The European Souther Observatory (ESO) are thanked for their help and support for measure-ments at Paranal. The NASA Langley GOES-10 analyses were supported by the Department of Energy Atmospheric Radiation Measurement Program through Interagency Agreement DE-20
AI02-07ER64546.
It is also a great pleasure to acknowledge the program managers in the US, particularly Wal-ter Robinson from NSF and Jin Huang from NOAA whose support and guidance has been invaluable throughout.
References
25
Abel, S. J., Walters, D. N., and Allen, G.: Evaluation of stratocumulus cloud prediction in the
Met Office forecast model during VOCALS-REx, Atmos. Chem. Phys. Discuss., 10, 16797–
16835, doi:10.5194/acpd-10-16797-2010, 2010. 20791
ACPD
10, 20769–20822, 2010VOCALS operations
R. Wood et al.
Title Page
Abstract Introduction
Conclusions References
Tables Figures
◭ ◮
◭ ◮
Back Close
Full Screen / Esc
Printer-friendly Version
Interactive Discussion
Discussion
P
a
per
|
Dis
cussion
P
a
per
|
Discussion
P
a
per
|
Discussio
n
P
a
per
|
above stratiform clouds on indirect aerosol climate forcing, Nature, 432, 1014–1017, 2004. 20774
Andreae, M. O. and Merlet, P.: Emission of trace gases and aerosols from biomass burning, Global Biogeochem. Cy., 15, 955–966, 2001. 20792
Avey, L., Garrett, T., and Stohl, A.: Evaluation of the aerosol indirect effect using
satel-5
lite, tracer transport model, and aircraft data from the International Consortium for At-mospheric Research on Transport and Transformation, J. Geophys. Res., 112, D10S33, doi:10.1029/2006JD007581, 2007. 20791
Bennartz, R.: Global assessment of marine boundary layer cloud droplet number concentration from satellite, J. Geophys. Res., 112, D02201, doi:10.1029/2006JD007547, 2007. 20776 10
Brenguier, J.-L. and Wood, R.: Observational strategies from the micro to meso scale, in: Perturbed clouds in the climate system, MIT Press, 2009. 20773
Bretherton, C. S., Uttal, T., Fairall, C. W., Yuter, S. E., Weller, R. A., Baumgardner, D., Comstock, K., and Wood, R.: The EPIC 2001 stratocumulus study, B. Am. Meteor. Soc., 85, 967–977, 2004. 20772, 20773
15
Bretherton, C. S., Wood, R., George, R. C., Leon, D., Allen, G., and Zheng, X.: Southeast Pacific stratocumulus clouds, precipitation and boundary layer structure sampled along 20 S during VOCALS-REx, Atmos. Chem. Phys. Discuss., 10, 15921–15962, doi:10.5194/acpd-10-15921-2010, 2010. 20776
Brioude, J., Cooper, O. R., Feingold, G., Trainer, M., Freitas, S. R., Kowal, D., Ayers, J. K., 20
Prins, E., Minnis, P., McKeen, S. A., Frost, G. J., and Hsie, E.-Y.: Effect of biomass burning
on marine stratocumulus clouds offthe California coast, Atmos. Chem. Phys., 9, 8841–8856,
doi:10.5194/acp-9-8841-2009, 2009. 20791
Caldwell, P., Wood, R., and Bretherton, C. S.: Mixed-layer budget analysis of the diurnal cycle of entrainment in SE Pacific stratocumulus, J. Atmos. Sci., 62, 3775–3791, 2005. 20772 25
Chand, D., Hegg, D. A., Wood, R., Shaw, G. E., Wallace, D., and Covert, D. S.: Source attribu-tion of climatically important aerosol properties measured at Paposo (Chile) during VOCALS, Atmos. Chem. Phys. Discuss., 10, 17853–17887, doi:10.5194/acpd-10-17853-2010, 2010. 20781
Colbo, K. and Weller, R.: The variability and heat budget of the upper ocean under the Chile-30
Peru stratus, J. Marine. Res., 65, 607–637, 2007. 20774, 20776