Allometric equations for estimating tree biomass in restored mixed-species Atlantic
Forest stands
Lauro Rodrigues Nogueira Junior1,5, Vera Lex Engel2, John A. Parrotta3, Antonio Carlos Galva˜o de Melo4
& Danilo Scorzoni Re´2
1Empresa Brasileira de Pesquisa Agropecua´ria (Embrapa), Caixa Postal 44, CEP 49025-040, Aracaju, SE,
Brasil.www.cpatc.embrapa.br 2
Universidade Estadual Paulista ‘‘Julio de Mesquita Filho’’ (UNESP), Faculdade de Cieˆncias Agronoˆmicas, Departamento de Cieˆncias Florestais, Caixa Postal 237, CEP 18610-307, Botucatu, SP,
Brasil.www.fca.unesp.br 3
USDA Forest Service, Research & Development, 1601 N. Kent Street, Arlington VA 22209, USA. www.fs.fed.us/research/
4Instituto Florestal de Sa˜o Paulo (IF-SP), Floresta Estadual de Assis, Caixa Postal 104, CEP 19802-300,
Assis, SP, Brasil.www.iflorestal.sp.gov.br 5
Corresponding author: e-mail:[email protected]
NOGUEIRA JUNIOR, L.R., ENGEL, V.L., PARROTTA, J.A., MELO, A.C.G., RE´ , D.S.Allometric equations for estimating tree biomass in restored mixed-species Atlantic Forest stands. Biota Neotropica. 14(2): 1––9.http://dx.doi.org/10.1590/1676-06032013008413
Abstract: Restoration of Atlantic Forests is receiving increasing attention because of its role in both biodiversity conservation and carbon sequestration for global climate change mitigation. This study was carried out in an Atlantic Forest restoration project in the south-central region of Sa˜o Paulo State –– Brazil to develop allometric equations to estimate tree biomass of indigenous tree species in mixed plantations. Above and below-ground biomass (AGB and BGB, respectively), stem diameter (DBH: diameter at 1.3 m height), tree height (H: total height) and specific wood density (WD) were measured for 60 trees of 19 species. Different biomass equations (linear and nonlinear-transformed) were adjusted to estimate AGB and BGB as a function of DBH, H and WD. For estimating AGB and BGB, the linear biomass equation models were the least accurate. The transformed nonlinear biomass equation that used log DBH2, log H and log WD as predictor variables were the most accurate for AGB and the transformed nonlinear biomass equations that used log DBH2*WD as predictor variables were the most accurate for BGB. It is concluded that these adjusted equations can be used to estimate the AGB and BGB in areas of the studied project. The adjusted equations can be recommended for use elsewhere in the region for forest stands of similar age, tree size ranges, species composition and site characteristics.
Keywords: Above-ground biomass, Below-ground biomass, Biomass equation, Tree allometry, Atlantic Forest, Restoration.
NOGUEIRA JUNIOR, L.R., ENGEL, V.L., PARROTTA, J.A., MELO, A.C.G., RE´ , D.S.Equac¸o˜es alome´tricas para estimativa da biomassa arbo´rea em plantios mistos com espe´cies nativas na restaurac¸a˜o da Mata Atlaˆntica.Biota Neotropica. 14(2): 1––9.http://dx.doi.org/10.1590/1676-06032013008413
Resumo:A restaurac¸a˜o da Mata Atlaˆntica vem recebendo aumento na atenc¸a˜o por causa do papel na conservac¸a˜o da biodiversidade e sequestro de carbono para a mitigac¸a˜o da mudanc¸a global do clima. Este estudo foi conduzido em um projeto de restaurac¸a˜o da Mata Atlaˆntica na regia˜o centro-sul do Estado de Sa˜o Paulo –– Brasil e buscou desenvolver equac¸o˜es alome´tricas para estimar a biomassa arbo´rea de espe´cies nativas em plantios mistos. Em 60 a´rvores de 19 espe´cies foram medidas a biomassa acima e abaixo do solo, o diaˆmetro do tronco (DAP: diaˆmetro a 1,3 m de altura), altura (H) e densidade especı´fica da madeira (Ds). Diferentes equac¸o˜es de biomassa (linear e na˜o linear) foram ajustadas para estimar a biomassa acima e abaixo do solo, utilizando DAP, H e Ds como varia´veis preditoras. As equac¸o˜es de biomassa lineares foram as menos acuradas para a estimativa da biomassa acima e abaixo do solo. As equac¸o˜es de biomassa na˜o lineares que usaram log DAP2, log H e log Ds como varia´veis preditoras foram mais acuradas para a estimativa da biomassa acima do solo e as na˜o lineares que usaram log DBH2*WD como varia´veis preditoras foram as mais acuradas para a estimativa da biomassa abaixo do solo. Conclui-se que estas equac¸o˜es ajustadas podem ser usadas na estimativa da biomassa acima e abaixo do solo nas a´reas do projeto estudado. Tambe´m pode ser considerado o uso destas
equac¸o˜es ajustadas em outras a´reas restauradas da Mata Atlaˆntica com idade do povoamento, classes de tamanho das a´rvores, composic¸a˜o de espe´cies e caracterı´sticas das a´reas similares ao deste estudo, desde que a´rvores sejam avaliadas para verificar a efica´cia da equac¸a˜o a ser usada.
Palavras-chave:Biomassa acima do solo, Biomassa abaixo do solo, Equac¸a˜o de biomassa, Alometria, Mata Atlaˆntica, Restaurac¸a˜o.
Introduction
The restoration of Brazil’s Atlantic Forest on degraded lands and riparian areas is receiving increasing attention in the development of public policies for biodiversity conservation and climate change mitigation purposes, with increasing funds available for this purpose through public and private programs and international cooperation (Rodrigues et al. 2009, Rodrigues et al. 2011, Calmon et al. 2011). An area of particular interest is the capacity of these restored forests to absorb atmospheric carbon dioxide and thereby enhance their role as a carbon sink. Accurate estimates of carbon sequestra-tion in these restored forests require development of equasequestra-tions for accurately estimating tree biomass in mixed native species stands.
Tree biomass is an important characteristic of forest ecosystems, reflecting the accumulation of organic carbon and ecosystem productivity (Dixon et al. 1994, Clark et al. 2001, Masera et al. 2003, Grace 2004, Lal 2005) and it can be an important indicator for monitoring the developmentof restored ecosystems (Naeem et al. 2009). Moreover, accurate tree biomass estimates permit comparisons between restored and reference sites and estimates of nutrient stocks in tree compartments of the ecosystem.
There are several indirect methods for tree biomass estimates, such as allometric equations, most of which use a combination of predictor variables such as tree stem diameter, total height and wood density (Saldarriaga et al. 1988, Brown et al. 1989, Overman et al. 1994, Brown 1997, Nelson et al. 1999, Chave et al. 2005, Cole & Ewel 2006). According to Chave et al. (2005), the most important variables for predicting above-ground biomass are, in decreasing order of importance, tree stem diameter, woody specific density, tree height, and forest type. To select biomass equations models, the Akaike Information Criterion (AIC) provides a simple, effective and direct way to select the variables that will produce the best fitting model (Burnham & Anderson 2010).
Multi-species biomass equations are usually based on tree data from primary forests, which usually have different tree architectures than those found in planted (restoration) forests, and typically do not estimate root biomass (Brown et al. 1989, Brown 1997, Nelson et al. 1999, Chave et al. 2005). Miranda et al. (2011) developed and fitted allometric models to estimate dry biomass in trees (including both Cerrado and Atlantic forest species) planted in forest restoration areas ranging in age between 5 and 36 years. In their work, the best results were obtained by stepwise procedures with stratification of species by growth rates. However, equations models for estimating tree biomass in multispecies restoration projects are scarce; equa-tions obtained from trees in natural mature forests are usually used for biomass and carbon estimations in restoration projects (Melo e Durigan 2006), in spite of the differences between tree structural patterns in these two different conditions. Here, we aimed at refining allometric equations for estimating biomass of trees planted in an Atlantic Forest restoration project in Brazil, to be used to assess the role of different plantations
systems as carbon sinks.
Materials and Methods
The study sites were located at the Sa˜o Paulo State University (UNESP) Experimental Farm, Botucatu, south-central region of Sa˜o Paulo State, Brazil (22o52’32’’S and 48o26’46’’W). According to Ko¨eppen’s classification the climate is Cfa. Annual rainfall averages 1,494 mm with the rainy season lasting from October to March. Annual mean temperature is 20.56C, with the minimum average occurring in July and maximum in February. The natural vegetation is a semi-deciduous tropical moist forest within the Atlantic Forest biome range.
The experiment was undertaken at two sites with Ultisol (22o49’39’’S and 48o25’55’’W) and Alfisol (22o48’54’’S and 48o24’56’’W) soils, respectively. At each site an experiment with 5 treatments and three replicates (random blocks design) was established from 1997 to1998, with each plot measuring 50 x 50 m. Treatments ranged from passive restoration (control plots) to a high-diversity native tree species mixture, and included a direct seeding system, an agroforestry system and a commercial species mixture (Engel & Parrotta 2001, Siddique et al. 2008, Nogueira Jr et al. 2011).
In 2009 we sampled 19 of the native tree species (Table 1) included in the experimental treatments (Control, Direct Seeding and High-Diversity Seedling Planting). These species represent more than 95% of the basal area in the restoration plots, based on previous inventories. They included two ecological groups (fast growing pioneer and slower growing secondary species. All selected individuals were located inside the restoration plots at least 10 m from the edge boundaries. Three individuals of each species, representing the range of tree sizes for each species, were sampled in the restoration treatments, by measuring diameter at breast height (DBH) and total height (H). Only for Psidium guajava six individuals were sampled, three in understory of Direct Seeding and High-Diversity Seedling Planting treatment and three in open area of Control treatment. For trees with more than one stem, we calculated the equivalent DBH:
equivalent DBH~pffiffiffiffiffiffiffiffiffiffiffiffiffiffiffiffiffiffiffiffiffiffiffiffiffiffiffiffiffiffiffiffiffiffiffiffiffiffiffiffiffiffiffiffiffiffiffiffiffiffiffiffiffiffiffiffiffiffiffiffiffiffiffiffiffiffiffiffiffiffidbh12zdbh22zdbh32. . . dbhn2
where, dbh = diameter at breast height of each stem
Among the trees sampled, tree heights ranged from 2.7 to 15.8 m and stem diameters ranged from 2 to 33 cm (Table 1). After being measured, each tree was felled and tree biomass was quantified by the direct method. For above-ground biomass (AGB) three compartments were considered: 1)leaves- leaves and twigs with diameters up to 1 cm; 2)twigs/branches- woody material of crown of the tree up to a minimum diameter of 1 cm; 3)stem- the main wooden axis of a tree, located between the base and the crown of the tree. For below-ground biomass (BGB) only roots with diameters.1 cm were considered. Roots were excavated manually for small trees and with the aid of a retro bulldozer for medium and large trees.
for 200 kg and precision of 50 g. To determine the dry weight of each tree we first estimated the moisture content of each compartment by taking around 2 kg (fresh weight) of leaves, twigs/branches and roots, and five 3-5 cm thick disks (one near the base and the others at 25, 50, 75 and 95% of the stem height) for each stem. Two wedges were taken from each disk, one for determining the moisture content and the other for specific wood density (WD). In the laboratory the fresh samples of leaves, twigs/branches, stems and roots were weighed, oven-dried at 706C to constant weight - approximately seven days. The dry weight of individual tree compartments were calculated using fresh weight ratios obtained from these samples. Wood density was analyzed by the Maximum Moisture Content method (Foelkel et al. 1971). The WD for each tree was computed as the arithmetic average of the five discs.
Above and belowground biomass (AGB and BGB) data were subjected to regression analyses, considering as predictor vari-ables the DBH (cm), DBH2(cm2), H (m) and WD (g cm-3). For assessment of goodness of fit of biomass equations four indicators are reported: 1) standard error of parameter estimate of the predictor variables; 2) P. |t|, the probability that at statistic would have a greater absolute value than observed one, given that the true parameter is zero; 3) coefficient of variation, computed percent ratio between the standard deviation of the error term divided by sample mean of the dependent variable; and 4) Akaike Information Criterion (AIC; Burnham & Anderson 2010), based on likelihood and complexity of equation models. Biomass equations having atvalue probability.0.05 for any predictor
variable (DBH, DBH2, H and WD) or intercept and biomass equations having coefficient of variation.70% were rejected. The equations models were compared using AIC, choosing the best model the one with smaller AIC. AIC’s differences less than 10 indicate similarity among models, and AIC’s difference greater than 10 indicate difference among models. Graphical analysis of the error of estimated biomass in relation to the observed biomass was used. The correlation of the predictor variables DBH2, WD and H with the dependent variables AGB and BGB were assessed. All analysis were conducted using SAS version 9.2 (SAS Institute 2009) except the AIC that was conducted using R (R Development Core Team 2011).
Results
The partitioning of dry biomass between the compartments of the 19 tree species evaluated was highly variable, did not show any pattern among species (Figure 1), and was probably due simply to different sizes of the trees (Table 1). From the aggregate data from the 60 trees measured, twigs/branches represented 38%, stems 33%, roots 20% and leaves only 8% of total tree biomass (4,260 kg). The average biomass per tree was 71 Kg (twigs/branches 27 Kg, stem 24 Kg, roots 14 Kg and leaves 6 Kg).
The correlation of the predictor variables DBH2, WD and H with the dependent variables AGB and BGB (Figure 2) were higher in the logarithmic models (Figure 2g, 2h, 2i, 2j, 2k and 2l) than in the arithmetic ones (Figure 2a, 2b, 2c, 2d, 2e and 2f). Table 1. Diameter at breast height (DBH), height and specific wood density (WD) of each sampled tree (large (L), medium (M) and small (S)), for 19 native tree species (60 harvested trees) assessed by the direct method to quantify biomass.
Botanical Family Species DBH Height WD
L M S L M S L M S
_______ cm _______ _______m_______ _____g cm-3_____ Fab. Mimosoideae Piptadenia gonoacanthaJ.F.
Macbr.
33.3 14.0 4.0 13.6 9.1 5.0 0.54 0.51 0.46
Fab. Faboideae Schizolobium parahybaS.F. Blake 26.1 19.3 13.1 15.8 12.1 11.7 0.29 0.29 0.25 Fab. Mimosoideae Parapiptadenia rigidaBrenan 25.8 13.1 7.0 7.1 7.2 5.9 0.60 0.43 0.61 Euphorbiaceae Croton floribundusSpreng. 24.7 19.7 11.0 12.9 9.6 7.0 0.38 0.39 0.35 Anacardiaceae Schinus terebinthifoliusRaddi 22.9 17.4 11.5 7.1 7.2 5.9 0.49 0.51 0.47 Verbenaceae Citharexylum myrianthumCham. 21.7 15.0 11.4 10.7 11.0 8.7 0.40 0.35 0.38 Fab. Mimosoideae Enterolobium contorstisiliquum
Morong
19.7 12.8 6.7 10.1 5.2 4.9 0.31 0.28 0.23
Tiliaceae Luehea divaricataMart. 16.4 11.5 7.2 7.5 6.0 5.8 0.47 0.38 0.42
Boraginaceae Cordia superbaCham. 14.9 9.7 4.9 7.2 6.8 5.5 0.35 0.33 0.29
Cecropiaceae CecropiapachystachiaTre´cul 14.4 12.5 9.7 13.0 10.0 8.1 0.41 0.39 0.35 Fab. Faboideae *Lonchocarpus cultratusVell. 13.8 7.1 2.0 8.5 5.8 2.7 0.49 0.42 0.32 Fab. Faboideae Machaerium stipitatumVogel 11.2 7.3 4.4 9.8 6.9 4.8 0.35 0.36 0.31 Fab. Faboideae Centrolobium tomentosum
Guillemin ex Benth
10.9 8.6 6.4 9.9 9.5 9.7 0.54 0.52 0.39
Fab. Faboideae Pterogyne nitensTul. 9.9 6.9 3.2 8.9 5.9 4.3 0.54 0.52 0.37
Verbenaceae *Aloysia virgataPers. 8.6 7.4 3.9 9.0 8.0 4.7 0.59 0.61 0.61
Fab.
Caesalpinoideae
Hymenea courbarilY.T.
Lee&Langenh
8.0 5.7 2.6 8.0 5.4 3.3 0.54 0.53 0.54
Apocynaceae *Peschiera fuchsiaefoliaMiers 6.8 5.0 3.1 7.0 4.6 4.1 0.38 0.39 0.35
Fab. Faboideae Dipteryx alataVogel 6.8 4.7 4.1 6.3 5.4 4.0 0.55 0.45 0.45
Myrtaceae *1Psidium guajavaL. 6.0 4.7 3.4 7.0 4.6 4.9 0.53 0.50 0.48
Myrtaceae *2Psidium guajavaL. 5.9 5.5 4.5 3.4 4.1 3.0 0.54 0.51 0.46
* Naturally regeneration (not planted) trees.
Among the predictor variables (DBH2, H and WD) the DBH2 had the highest correlation with biomass (AGB and BGB). However, biomass equations using only DBH did not meet the required conditions to be accepted, regarding the arbitrated values of indicators.
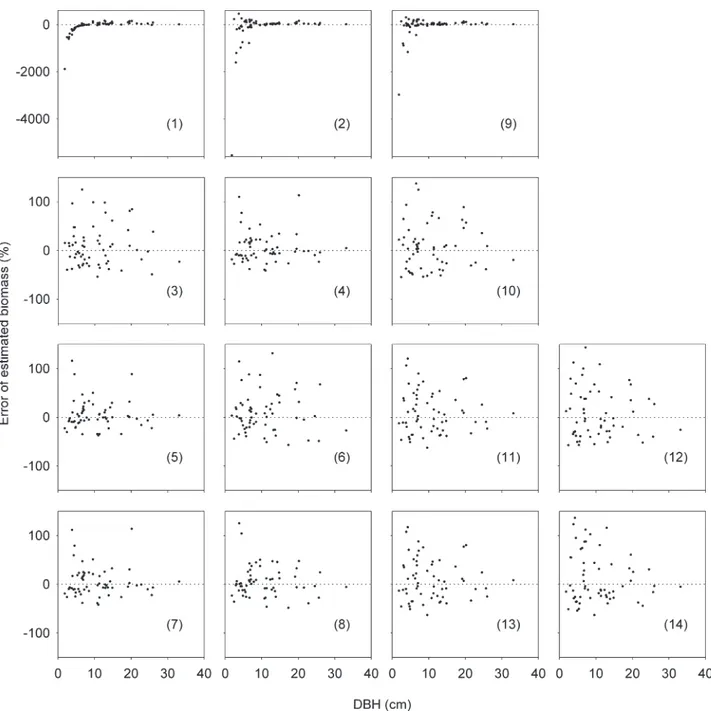
For aboveground biomass (AGB) estimates, eight equations models (Table 2) were selected. Equations 4, 5 and 7 were the best fitted, with lower coefficient of variation and AIC. Equations 1 and 2 showed the lowest goodness of fit, with residues not uniformly distributed along the x-axis (Figure 3), mainly for trees , 10 cm DBH. However, log-transformed equations showed a higher goodness of fit and lower error of estimated biomass. By AIC the best models to AGB were the models 5, 7 and 4, respectively.
For belowground biomass (BGB) estimates, six equation models were selected (Table 2). The log-transformed equations 11 and 13 were the best fitted regarding their lower coefficient of variation, lower error of estimated biomass and lower AIC. Similar to AGB, the untransformed equation (equation 9) led to the lowest goodness of fit, with higher coefficient of variation and AIC value (Table 2). By AIC the best models to BGB were the models 13 and 11, respectively.
Discussion
In general, most trees had a higher proportion of twigs/ branch biomass than stem biomass, when compared to other studies undertaken in natural forests that involved a wider range of tree sizes (Chave et al. 2005). Only few species (M. stipitatum, C. tomentosum, C. pachystachia, S. parahyba, C. floribundus, H. courbarilandD. alata) had a higher proportion of biomass in stem than in other aboveground biomass components. In this experiment, trees were still young, around 11-12 years old, and therefore their architectural development was not completed yet, with poor stem development. Stem
biomass will probably increase over time, when the tree individuals increase their DBH as well as WD. Furthermore, since the stands not yet completely stocked, higher availability of light stimulates greater branch development, in contrast to what occurs in more dense natural forests, where stronger light competition reduces branch formation and a higher investment in stem growth. This can be observed by the contrasting biomass allocation ofPsidum guajava where trees growing in the understory had a higher proportion of stem than tress growing in full sunlight.
Since average root biomass was 20%, the BGB compart-ment represents an important component of total stand biomass. Fonseca et al. (2012) found a percentage of 22% of coarse roots in total tree biomass of native forest plantations in the humid tropical lowlands of Costa Rica. In a New Zealand beech (Nothofagus) forest ecosystem, roots represented 22% of total live tree biomass (Hart et al.2003). Root biomass or BGB is often expressed as a proportion to AGB, such as a root-shoot ratio (R/S ratio). The R/S ratio was 0.25, similar to forests in tropical zones (0.24, Cairns et al. 1997), montane moist forests (0.22, Sanford & Cuevas 1996) and New Zealand beech forest ecosystems (0.28, Hart et al. 2003). This indicates that studies focusing only in above ground biomass will be considerably underestimating the capacity of forest to stock carbon in projects that aim at climate change mitigation.
biomass estimate because of low goodness of fit.
Only WD correlated [?] with DBH2(equations 4 and 7 for AGB and equations 11 and 13 for BGB) provided good predictions of biomass. This may be attributed to the influence of WD in the variation of dry biomass between species and individuals of different sizes. For example, if only DBH2and H are used as predictor variables an underestimation of biomass for small trees having high WD such as A virgata and P. guajava and an overestimation of the biomass for large trees having low WD likeS. parahybaare expected.
Estimates of forest biomass using different equations have led to very contrasting results. In the Brazilian Atlantic Forest, different models produced considerably different biomass
Biomass equation models Parameter Estimate Standard error P.|t| Coefficient of variation AIC
Symbol Value
AGB
1)AGB~azb(DBH2) a -13.127 6.4131 0.0452 68.76 614.3
b 0.428 0.0242 ,0.0001
2)AGB~azb1(DBH2)zb2(WD) a -100.353 20.1404 ,0.0001 59.56 598.0
b1 0.430 0.0209 ,0.0001
b2 200.402 44.4777 ,0.0001
3)log AGBð Þ~azblog(DBH2) a -1.890 0.1718 ,0.0001 12.41 419.9
b 1.127 0.0378 ,0.0001
4)log AGBð Þ~azb1log(DBH2)zb2log(WD) a -1.027 0.1710 ,0.0001 8.97 382.4
b1 1.144 0.0274 ,0.0001
b2 1.085 0.1477 ,0.0001
5)log AGBð Þ~azb1log(DBH2)zb2log(H)zb3log(WD) a -1.305 0.2067 ,0.0001 8.67 379.4
b1 1.055 0.0479 ,0.0001
b2 0.340 0.1519 0.0292
b3 1.077 0.1428 ,0.0001
6)log AGBð Þ~azblog(DBH2H) a -2.541 0.1987 ,0.0001 12.76 422.9
b 0.883 0.0305 ,0.0001
7)log AGBð Þ~azblog(DBH2WD) a -0.970 0.1015 ,0.0001 8.96 380.6
b 1.142 0.0272 ,0.0001
8)log AGBð Þ~azblog(DBH2HWD) a -1.853 0.1312 ,0.0001 9.66 389.5
b 0.896 0.0231 ,0.0001
BGB
9)BGB~azb1(DBH2)zb2log(WD) a -17.381 4.2857 0.0002 51.18 412.3
b1 0.097 0.0045 ,0.0001
b2 35.903 9.4645 0.0004
10)log BGBð Þ~azblog(DBH2) a -2.960 0.2177 ,0.0001 27.78 290.9
b 1.072 0.0479 ,0.0001
11)log BGBð Þ~azb1log(DBH2)zb2log(WD) a -2.134 0.2570 ,0.0001 23.83 273.6
b1 1.088 0.0412 ,0.0001
b2 1.038 0.2221 ,0.0001
12)log BGBð Þ~azblog(DBH2H) a -3.535 0.2655 ,0.0001 30.12 300.5
b 0.832 0.0408 ,0.0001
13)log BGBð Þ~azblog(DBH2WD) a -2.086 0.1518 ,0.0001 23.68 271.7
b 1.086 0.0407 ,0.0001
14)log BGBð Þ~azblog(DBH2HWD) a -2.887 0.2051 ,0.0001 26.65 285.9
b 0.845 0.0361 ,0.0001
DBH = diameter at breast height (1.3 m) height; H = total height; WD = specific wood density.
Biota
N
eotr
op
.,
14(2):
1–
–
9,
2014
Nogueira
Junior,
L.R.
et
al
.br/bn
h
ttp://dx.doi.or
g
/10.1590/1676-060
of tree architectural types found in the forest where such equations will be applied.
The sampling error in forest inventory estimates has two main components (Parresol 1999). The first is the component related to random selection of sample units and the second component is associated with the error of the regression model itself. In the present study, the 19 tree species sampled represent more than 95% of the restoration plots basal area, be in the Control, Direct Seeding and High-Diversity Seedling Plantings. The three harvested individuals of each species represent the range of sizes which were found in the planting sites. Regarding the regression errors they were high for equations 1, 2 (for
aboveground biomass) and 9 (for belowground biomass), suggesting that the use of untransformed log equations is inadequate to estimate tree biomass in forest plantations.
To reduce the error of estimated biomass the use of log-transformed biomass equations was more appropriated, such as the equation 5 for AGB and the equation 13 to BGB which had a better goodness of fit. Finally, we concluded that in decrease order the better equations for above- and belowground biomass estimate in restored areas are:
log (AGB)~{1:305z1:055 log (DBH
2) z0:34 log (H)z1:077 log (WD)
Figure 3.Residual analysis (error plots of estimated biomass (%) by the observed biomass) for14 equation models trees of 19 Atlantic Forest species. Biomass equation models for above- and belowground biomass (AGB and BGB):(1)AGB~azb(DBH2); (2)AGB~azb1(DBH2)zb2(WD); (3) log(AGB)~azblog(DBH2); ( 4 ) log(AGB)~azb
1log(DBH2)zb2log(WD); ( 5 ) log(AGB)~azb1log(DBH2)zb2log(H)zb3log(WD); ( 6 ) log(AGB)~azblog(DBH2H); (7) log(AGB)~azblog(DBH2WD); (8) log(AGB)~azblog(DBH2HWD);(9) BGB~azb1(DBH2)zb2(WD);
log (AGB)~{0:970z1:1421 log (DBH
2 WD)
log (AGB)~{1:027z1:144 log (DBH
2)z1
:085 log (WD)
and
log (BGB)~{2:086z1:086 log (DBH
2 WD)
log (BGB)~{2:134z1:088 log (DBH
2
)z1:038 log (WD)
However, log-transformed biomass equations may be only applicable to mixed plantations with tree DBH, H and WD ranges similar to the ones showed in Table 1. Provided that there are similarities in species composition, the biomass equations presented here may be useful for application on a local and regional scale. Although these biomass equations may be applied in the context of the Atlantic Forest restoration, for projects focusing on environmental services like carbon sequestration, it is suggested that some tree individuals be evaluated by direct (destructive) method to verify whether the equation to be used overestimates or underestimates tree biomass (Brown 1997).
Conclusions
The logarithmically-transformed equation that use diameter at breast height, total height and specific wood density as predictor variables are the most accurate equation for estimat-ing above-ground biomass. Furthermore, the logarithmically-transformed equations that use diameter at breast height and specific wood density as predictor variables showed good accuracy for estimating above- and below-ground biomass. These biomass equations may be recommended for estimating tree biomass in Atlantic Forest restoration projects, providing some similarity in species composition, age or structural development, and site characteristics.
Acknowledgements
The project received grants from Sa˜o Paulo Research Foundation (FAPESP) and National Council of Research and Technology (CNPq). The first author received a Ph.D. Scholarship from FAPESP, Process 2006/06315-0. The second author thanks also to CNPq for the Research Productivity Fellowship. We thank all the students and staff members of the Laboratory of Ecology and Forest Restoration of Sa˜o Paulo State University (LERF/UNESP) and employees of the Agronomic Sciences College (FCA/UNESP) for field assis-tance, and in particular Aparecido Agostinho Arruda and Elder Candido Mattos. We also thank A.V. Teodoro (Brazilian Agricultural Research Corporation –– Embrapa) for comments on previous versions of the manuscript.
References
BROWN, S., GILLESPIE, A. & LUGO A. 1989. Biomass estimation methods for tropical forests with applications to forest inventory data. Forest Science 35: 881-902.
BROWN, S. 1997. Estimating biomass and biomass change of tropical forest: a primer. FAO Forestry Paper - 134, Rome.
BURNHAM, K.P. & ANDERSON, D.R. 2010. Information and likelihood theory: A basis for model selection and inference.In Model selection and multimodel inference: A practical information-theoretic approach (K.P. Burnham & D.R. Anderson, eds). Springer Science, New York, 2nded, chap 2, pp 49-97.
C A I R N S , M . A . , B R O W N , S . , H E L M E R , E . H . & BAUMGARDNER, G.A. 1997. Root biomass allocation in the world’s upland forests. Oecologia 111: 1-11.
CALMON, M., BRANCALION, P., PAESE, A., ARONSON, J., CASTRO, P., DA SILVA, S & RODRIGUES, R. 2011. Emerging Threats and Opportunities for Large-Scale Ecological Restoration in the Atlantic Forest of Brazil. Restoration Ecology 19: 154-158. CHAVE, J., ANDALO, C., BROWN, S., CAIRNS, M., CHAMBERS, J., EAMUS, D., FOLSTER, H., FROMARD, F., HIGUCHI, N., KIRA, T., LESCURE, J., NELSON, B., OGAWA, H., PUIG, H., RIERA, B. & YAMAKURA, T. 2005. Tree allometry and improved estimation of carbon stocks and balance in tropical forests. Oecologia 145: 87-99.
CLARK, D., BROWN, S., KICKLIGHTER, D., CHAMBERS, J., THOMLINSON, J. & NI, J. 2001. Measuring net primary production in forests: Concepts and field methods. Ecological Applications 11: 356-370.
COLE, T. & EWEL, J. 2006. Allometric equations for four valuable tropical tree species. Forest Ecology and Management 229: 351-360. DIXON, R., BROWN, S., HOUGHTON, R., SOLOMON, A., TREXLER, M. & WISNIEWSKI, J. 1994. Carbon pools and flux of global forest ecosystems. Science 263: 185-190.
ENGEL, V. & PARROTTA, J. 2001. An evaluation of direct seeding for reforestation of degraded lands in central Sao Paulo state, Brazil. Forest Ecology and Management 152: 169-181.
FOELKEL, C., BRASIL, M. & BARRICHELO, L. 1971. Me´todos para determinac¸a˜o da densidade ba´sica de cavacos para conı´feras e folhosas. IPEF 2/3:65-74.
FONSECA, W., ALICE, F.E. & REY-BENAYAS,J. 2012. Carbon accumulation in aboveground and belowground biomass and soil of different age native forest plantations in the humid tropical lowlands of Costa Rica. New Forests 43: 197-211.
GRACE, J. 2004. Understanding and managing the global carbon cycle. Journal of Ecology 92: 189-202.
HART, P., CLINTON, P., ALLEN, R., NORDMEYER, A. &, EVANS, G. 2003. Biomass and macro-nutrients (above- and below-ground) in a New Zealand beech (Nothofagus) forest ecosystem: implications for carbon storage and sustainable forest management. Forest Ecology and Management 174: 281-294. LAL, R. 2005. Forest soils and carbon sequestration. Forest Ecology
and Management 220: 242-258.
LINDNER, A. & SATTLER, D. 2012. Biomass estimations in forests of different disturbance history in the Atlantic Forest of Rio de Janeiro, Brazil. New Forests 43: 287-301.
MASERA, O., GARZA-CALIGARIS, J., KANNINEN, M., KARJALAINEN, T., LISKI, J., NABUURS, G., PUSSINEN, A., DE JONG, B & MOHREN, G. 2003. Modeling carbon sequestration in afforestation, agroforestry and forest management projects: the CO2FIX V.2 approach. Ecological Modelling 164: 177-199.
MELO, A. &DURIGAN, G. 2006. Fixac¸a˜o de carbono em reflor-estamentos de matas ciliares no Vale do Paranapanema, SP, Brasil. Scientia Forestalis 71: 149-154.
MIRANDA, D.,MELO, A. &SANQUETTA, C. 2011. Equac¸o˜es alome´tricas para estimativa de biomassa e carbono em a´rvores de reflorestamentos de restaurac¸a˜o. Revista A´ rvore 35: 679-689. NAEEM, S., BUNKER, D., HECTOR, A., LOREAU, M. &
PERRINGS, C. 2009. Biodiversity, ecosystem functioning and human wellbeing: An ecological and economic perspective. Oxford: Oxford University Press, 384p.
NELSON, B., MESQUITA, R., PEREIRA, J., DE SOUZA, S, BATISTA, G & COUTO, L. 1999. Allometric regressions for improved estimate of secondary forest biomass in the central Amazon. Forest Ecology and Management 117: 149-167. NOGUEIRA JR, L, GONC¸ ALVES, J, ENGEL, V & PARROTTA, J.
OVERMAN, J., WITTE, H. & SALDARRIAGA, J. 1994. Evaluation of regression models for above-ground biomass determination in Amazon rainforest. Journal of Tropical Ecology 10:207-218. PARRESOL, B. 1999. Assessing tree and stand biomass: A review with
examples and critical comparisons. Forest Science 45: 573-593. RODRIGUES, R., GANDOLFI, S., NAVE, A., ARONSON, J.,
BARRETO, T., VIDAL, C. & BRANCALION, P. 2011. Large-scale ecological restoration of high-diversity tropical forests in SE Brazil. Forest Ecology and Management 261: 1605-1613. RODRIGUES, R., LIMA, R., GANDOLFI, S. & NAVE, A. 2009. On
the restoration of high diversity forests: 30 years of experience in the Brazilian Atlantic Forest. Biological Conservation 142: 1242-1251. SALDARRIAGA, J., WEST, D., THARP, M. & UHL, C. 1988.
Long-term chronosequence of forest succession in the upper Rio Negro of Colombia and Venezuela. Journal of Ecology 76: 938-958. SANFORD JR, R & CUEVAS, E. 1996. Root growth and rhizosphere
interactions in tropical forests.In Tropical forest plant ecophysiology(S. Mulkey, R. Chazdon & A. Smith, eds). Chapman and Hall, New York, pp 268-300.
SAS INSTITUTE. 2009. SASH 9.2: qualification tools users guide.
Cary.
SIDDIQUE, I., ENGEL, V., PARROTTA, J., LAMB, D., NARDOTO, G., OMETTO, J., MARTINELLI, L. & SCHMIDT, S. 2008. Dominance of legume trees alters nutrient relations in mixed species forest restoration plantings within seven years. Biogeochemistry 88: 89-101.
SILVEIRA, P., KOEHLER, H., SANQUETTA, C. & ARCE, J. 2008. O estado da arte na estimativa de biomassa e carbono em formac¸o˜es florestais. Floresta 38: 185-205.
TESHOMEA, T. & PETTY, J. 2000. Site index equation for Cupressus lusitanica stands in Munessa forest, Ethiopia. Forest Ecology and Management126: 339-347.
VIEIRA, S., ALVES, L., AIDAR, M., ARAU´ JO, L., BAKER, T., BATISTA, J., CAMPOS, M., CAMARGO, P., CHAVE, J., DELITTI, W., HIGUCHI, N., HONO´ RIO, E., JOLY, C., KELLER, M., MARTINELLI, L., MATTOS, E., METZKER, T., PHILLIPS, O., SANTOS, F., SHIMABUKURO, M., SILVEIRA, M., & TRUMBORE, S. 2008. Estimation of biomass and carbon stocks: the case of the Atlantic Forest. Biota Neotropica 8(2): 21-29.