Vol.51, n. 1 : pp.11-18, January-February 2008
ISSN 1516-8913 Printed in Brazil BRAZILIAN ARCHIVES OF
BIOLOGY AND TECHNOLOGY
A N I N T E R N A T I O N A L J O U R N A L
Temporal Stability for Unpredictable Annual Climatic
Variability for
Hevea
Genotype Selection
Paulo de Souza Gonçalves1*, Mário Luiz Teixeira de Moraes2, Lígia Regina Lima Gouvêa1, Adriano Tosoni da Eira Aguiar1 and Erivaldo José Scallopi Júnior3
1
Apta/IAC; Programa Seringueira; C.P. 28; 13.001-970; Campinas - SP - Brasil. 2UNESP/FEIS; Departamento de Fitotecnia, Tecnologia de Alimentos e Sócio Economia; C.P. 31; 15385-000; Ilha Solteira - SP - Brasil. 3Apta Regional Noroeste Paulista; C.P. 61; 15500-000; Votuporanga - SP - Brasil
ABSTRACT
The objective of this study was to assess genotype-year interaction and determine temporal stable genotypes across six years of rubber yield evaluation. Stability analyses were performed by Eberhart and Russell method for rubber yield. Twenty-five genotypes were analyzed in a randomized complete block design with three replications. The best genotype in one year was not same always in the other year. The genotype components were partitioned into linear (genotypes within year) and nonlinear (pooled deviations) components. Significant mean square for linear components was predictable. This indicated that the performance of genotypes across the years for rubber yield could be predicted. Among the analyzed genotypes the IAC 40 also was considered highly productive and vigorous, with suitable adaptation.
Key words: Hevea brasiliensis, genotype x year interaction, rubber tree, rubber yield, stability parameters
*
Author for correspondence INTRODUCTION
In rubber tree [Hevea brasiliensis (Willd. ex Adr. de Juss.) Muell.-Arg.], productivity performance consists mainly of girth growth and yield stability. Breeders search for genotypes that show a stable, high yield across the years and locations. Results of genotype evaluation trials can be used to select and recommend a clone adapted to a particular agro-climatic condition if the agro-climatic differences can be defined according to environmental factors (Gonçalves et al., 2003). No extensive studies have been performed on the temporal stability for rubber yield. In general, a large amount of variation across years in rubber yield is observed.
Genotype-year interaction in perennial crops such as rubber tree represents the differential response of genotypes to changing annual conditions. In the presence of genotype x year interaction, the relative performance of genotypes varies with the year.
Braz. arch. biol. technol. v.51 n.1: pp.11-18, Jan./Feb. 2008 environmental conditions (Stringfield and Salter,
1934) while the mean squares deviations (
ˆ
2 i dS
)from linear regression actually measure yield stability (Yates and Cochran, 1938; Eberhart and Russell, 1966). Kalil Filho (1982) was the first one to employ the methodology of Eberhart and Russell (1966) to study the temporal yield variation in 25 clones. Later, Gonçalves et al. (1992), using the same stability method, examined the magnitude of the genotype x environment interaction for rubber yield of 19 Hevea mother trees at the same age.
The objectives of this study were to assess genotype-year interaction and to determine temporally stable genotypes across six annual yield evaluations for future recommendations.
MATERIAL AND METHODS
One Malaysian (RRIM), eight Amazonic (IAN, Fx, RO) and 16 local (IAC) genotypes (clones) were used in this study (Table 1). The Amazonic clones comprised Fx 985 and Fx 3899 developed by Ford Motor Company by crossing primary selections of South American leaf blight (SALB) resistant materials with high yielding oriental clones to produce Fx clones. The IAN clones (IAN 3156, IAN 3703, IAN 4493, IAN 6323 and IAN 6721) were developed by the breeding program of the former Instituto Agronômico do Norte, nowadays Embrapa Western Amazon. One-year-old rootstock seedlings raised in nurseries were used to budgraft the genotypes (clone materials). Budgrafting was made in December 1988. The successful budgrafts were uprooted and planted in the polyethylene bags. After the first flush of leaves developed, the plants were established in the field.
The experiment was conductive at the Votuporanga Experimental Station located in Northwestern region of São Paulo State (Brazil) at 20º25’S latitude, 49º50’W longitude and 450m elevation. Annual mean temperatures varied from 22.3ºC to 24.1ºC. Annual rainfall ranged from 1,480 to 1,600mm. Winter drought varied from three to four months, with an average rain deficit of 180mm. The experiment was laid out in a randomized complete block design with three replicates, using eight trees per plot and 7.0 m x 3.0 m spacing. Missing plants were replaced with spares during the first two years after planting to
maintain plantation density, but they were not scored.
One row of the commercial clone RRIM 600, acquired from a commercial nursery, was planted around the plot. Annual fertilizations consisted of 400 g of 10-10-10 NPK formula per plant, according to Bataglia and Gonçalves (2003). At the end of the sixth year, all the trees that reached a girth of 45.0 cm or more were opened for tapping at a height of 1.20 m above the highest point of the bud union, for annual rubber yield. Attempts were made to record six annual rubber yields. The latex extracted from the panel followed a half-spiral four-daily tapping system (seven tapping/month) for 11 months/year. Yield was recorded on the days when normal tapping, which started around 7:30 AM, was possible. After tapping, latex was allowed to collect in plastic cups provided for each useable tree. Upon stoppage of the latex flow, rubber was coagulated in the cup itself by adding 2% of acetic acid solution and stirring it well. The coagulated rubber in each cup was then made into a “biscuit,” which was dried, hung by a wire tied in each tree for about 30 days, then weighed and the dry rubber content for each tree was recorded.
All the analyses were performed using “Genes” computer program, Windows version, 2001 (Cruz, 2001). The method of Eberhart and Russell (1966) was used to characterize genotypic stability in different years. For the temporal stability study, various environments were represented by the six different annual rubber yields through an environmental index, i.e., mean performance of all the selections in each year. The following linear model was used:
,
ij ij j i
ij
m
I
E
Y
=
+
β
+
δ
+
where Yij is the mean of the genotype ith at the year j; m is general mean of all i genotypes over all years;
β
iis the regression coefficient of the ith genotype on the annual index which measures the response of this genotype to varying years; Ij is the annual index which is defined as the mean deviation of all genotypes at a given year from the overall mean ;δ
ij is the deviation from regression of the ith genotype in the jth year and Eijis the mean of experimental error.Genotypes Parentals 1st year 2nd year 3nd year 4th year 5th year 6th year
Mean Rank Mean Rank Mean Rank Mean Rank Mean Rank Mean Rank Fx 985 F 315 x AVROS 183 17.87 7 42.61 9 35.27 17 34.84 23 41.09 14 46.63 14 Fx 3899 F 4542 x AVROS 363 18.63 6 42.91 8 51.75 8 48.32 13 33.04 23 35.25 22
IAC 40 RRIM 608 x AVROS 25.61 2 69.97 1 72.69 2 76.09 2 75.27 1 80.80 2
IAC 56 RRIM 608 x F 3810 15.33 9 50.69 6 70.93 4 78.32 1 54.85 3 56.28 7
IAC 300 RRIM 605 x AVROS 22.32 3 62.42 2 53.56 7 66.36 4 49.93 8 61.73 4
IAC 301 RRIM 501 X AVROS 20.52 4 57.12 3 77.22 1 68.30 3 51.63 5 56.56 5 IAC 302 RRIM 501 x AVROS 19.13 5 37.99 11 41.08 13 47.55 14 49.26 9 53.64 9 IAC 303 RRIM 511 x AVROS 15.05 10 41.37 10 48.27 11 61.27 7 63.33 2 86.26 1 IAC 306 AVROS 49 x RRIM 14.80 12 33.27 17 34.55 18 36.22 22 26.77 25 26.08 25 IAC 307 AVROS 1328 x PR 13.77 13 36.97 13 47.07 12 53.28 10 50.35 7 54.33 8
IAC 308 AVROS 49 x PR 107 12.19 17 35.65 14 38.27 15 53.13 11 50.62 6 48.75 12 IAC 309 RRIM 626 x Fx 25 11.64 18 33.28 16 31.96 21 40.85 17 39.73 15 48.83 11 IAC 310 AVROS 1328 x PB 86 12.50 16 31.39 19 33.08 20 36.87 20 36.29 19 39.00 20 IAC 311 AVROS 509 x Fx 25 8.99 24 27.81 21 28.03 24 40.38 18 38.86 17 46.15 15 IAC 312 RRIM 600 x Fx 25 10.64 19 29.48 20 23.62 25 32.47 25 36.29 20 41.53 18
IAC 313 RRIM 626 x FX 25 10.53 20 34.17 15 48.56 10 45.78 15 46.80 10 50.78 10 IAC 314 AVROS 1328 x Fx 25 9.48 23 25.63 23 30.08 22 34.70 24 30.55 24 28.63 24 IAC 316 AVROS 1328 x RRIM 13.50 14 25.78 22 28.43 23 36.24 21 37.34 18 44.22 16 IAN 3156 IAN 4493 x PB 86 38.67 1 54.52 5 56.63 5 65.93 5 44.63 12 31.94 23 IAN 3703 Fx 4371 x PB 86 9.51 22 37.70 12 51.31 9 57.21 9 39.28 16 36.79 21
IAN 4493 Fx 4421 x Tjir 1 13.35 15 31.77 18 35.72 16 43.31 16 34.00 22 41.25 19 IAN 6323 Tjir 1 x Fx 3810 9.97 21 25.15 24 34.25 19 39.50 19 34.28 21 48.67 13 IAN 6721 Fx 43-655 x PB 86 6.93 25 23.83 25 39.25 14 48.38 12 42.38 13 41.74 17
RO 45 Primary clone 14.92 11 56.09 4 71.62 3 65.00 6 44.78 11 56.55 6
RRIM 600 Tjir 1 x PB 86 17.26 8 48.08 7 56.25 6 58.43 8 51.90 4 68.47 3
Overall 15.32±6.63 39.83±12.61 45.58±15.38 50.75±13.70 44.13±10.76 49.23±14.48
of the performance of each genotype under different years, means across all the genotypes; (b) mean square deviation (
ˆ
2i d
S ) from linear
regression for each genotype. They were estimated according to Cruz and Carneiro (2003) as follows: a) Computation of regression coefficient (
β
ˆ
i) for each genotype 2 / ˆ j j j ij ji =ΣY I ΣI
β
where ij j jY I
Σ is the sum of products of
environmental index (Ij) with the corresponding mean (m) of the genotype in each year. These values were obtained by the following manner:
[m] [Ij] = [ ij j jY I
Σ ] = [S] , where: [m] is the
matrix of means; [Ij] is the vector for environmental index and [S] is the vector for sum
of products , i.e. ij j jY I
Σ ; 2j
j I
Σ is the sum of
environmental index squares for each genotype;
j
I is the environmental index defined as the deviation of the mean of all genotypes at a year from the overall mean:
j I =
ta
Y
t
Y
ij j i ij i−
Σ
Σ
Σ
, where: ij iY
Σ is the total of all
the genotypes at
j
thyear; ij j i ΣY
Σ is the
grand total; t = number of genotypes and a = number of years.
b) Computation of mean square deviations ( 2
i
d S )
from linear regression for each genotype
2 i d S = r S s e ij j 2 2 ) 2 ( − − Σ
δ
where ij2 jδ
Σ is the variance
due to deviations from regression:
∑ − − Σ = Σ Σ j j j ij j i ij j ij j I I t Y Y Y 2 2 2 2 2 ) (
.
δ
, where:t Yi ij jY
2 2 −
.
Σ is the variance due to dependent
variable; ( )2/( i2) j j ij
jY I ΣI
Σ is the variance due to
regression and Se2 is the mean square for pooled error.
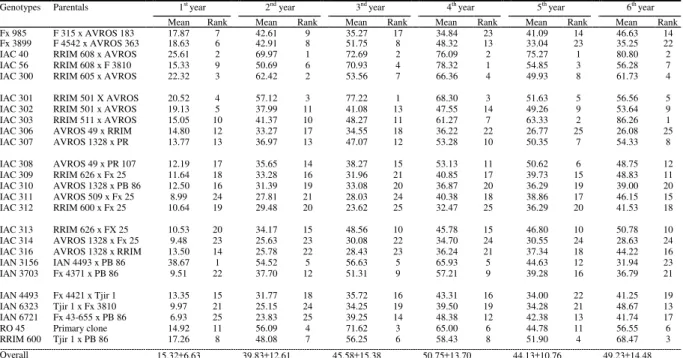
Table 1 - Parentals and annual means for 25 genotypes (clones) of rubber yield in grams/tree/tapping evaluated
Braz. arch. biol. technol. v.51 n.1: pp.11-18, Jan./Feb. 2008 RESULTS AND DISCUSSION
The average rubber yields, their ranks and differences among averages for the 25 genotypes tested across six years are presented in Table 1. Except for IAC 40 and IAC 301 genotypes, yield ranks of the genotypes across the years changed. Similarly, a study (Gonçalves et al., 1992) undertaken on rubber yield stability across five years also revealed very high fluctuations in one growing trial of the Experimental Station of Pindorama, of São Paulo State. This showed the difficulties encountered by the breeders in selecting new clones for release. These difficulties arose mainly from the masking effects of variable annual yield. Thus, would be important to study in depth the yield and vigor levels, adaptation patterns and stability of genotypes across several years (Romagosa and Fox, 1993). Pham and Kang (1988) indicated that genotype x environment interactions minimized the usefulness of genotypes by confounding their yield performance. The highest rubber yield of 86.26 dry rubber grams per tree/tapping was obtained from IAC 303 in the sixth year, while the lowest was from IAN 6721 in the first year. Across the years, however, IAC 40 and IAC 301 surpassed all other genotypes with an average rubber yield of 66.74 g and 55.22 g, respectively. Their average rubber yield exceeded that of IAC 314 by about 150%, indicating their high yield and good adaptability to the Hevea-producing years in Votuporanga Experimental Station. Genotype IAC 40 was particularly outstanding, ranking first during two of six years. The sixth year was the most productive with a mean yield of 80.80 g of rubber, nearly 55 g higher than that for the first year.
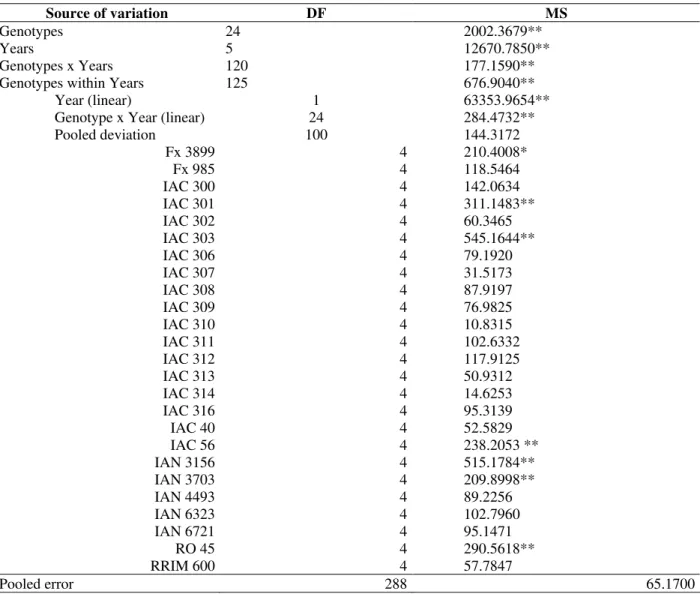
The partitioning of variance components revealed that unpredictable environment (years) was an important source of variation (Table 2). When the genotype x year interaction was due to variation in predictable environment factors, Hevea breeders would have the alternatives of either developing specific genotypes for different environments (locations, soil types, management systems, etc.) or broadly adapted genotypes that could perform well under annual variable conditions. However, when genotype x environment interaction resulted from variation in unpredictable environmental factors, such as year-to-year variation in rainfall distribution, as was the case of this study, the
breeder would need to develop stable genotypes that could perform reasonably well under a range of conditions. Such breeding strategies could assist the rubber producer in risk avoidance. Ceccarelli (1994) and Piepho (1998) indicated that producers perceived the yield stability as the most important economic aim to minimize crop failure, especially in marginal environments.
The stability analysis conducted for six-year rubber yield in Votuporanga is presented in Table 2 it revealed that the genotypes (clones) differed significantly. The genotypes x year interaction component were further partitioned into linear (genotypes within years effects) and non-linear (pooled deviations) components. Mean squares for both these components were tested against pooled error mean squares. The linear component was highly significant, indicating that the unpredictable components were shared in the genotype x year interaction. Preponderance of linear genotype x year interaction was of great practical importance, implying that there wose differences among linear regression coefficients for each genotype.
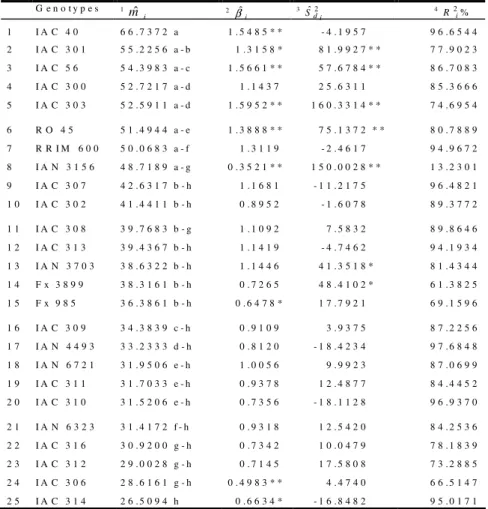
The stability parameters for all genotypes are given in Table 3. Eberhart and Russell (1966) emphasized the need for considering both linear (βˆ ) and non-linear (i Sˆdi) components of genotype-environment interactions in judging the stability of a genotype. A highly stable genotype was defined as one with (Sˆdi= 0) and an unstable as one with Sˆdi>1. In addition, a widely adapted genotype was defined as one with
β
ˆ
i= 1; specifically adapted to favorable environments as one withβ
ˆi>1, and specifically adapted to unfavorable environments as one withβ
ˆi<1. In this study, values for the regression coefficient (β
ˆ
i) ranged from 0.3521 (IAN 3156) to 1.5952 (IAC 303) for rubber yield. The regression coefficients of genotypes IAC 302, IAC 307, IAC 310, IAC 313, IAN 4493 and RRIM 600 were non-significantly different from unity (β
ˆi=1.0) and had a small deviation from regression (S
ˆ
di) and thus possessed fair stability.equal to unity (
β
ˆi=1) and deviation from regression as small as possible (S
ˆ
di= 0).Accordingly, IAC 302, IAC 307 and IAC 313 were the most widely adapted genotypes for rubber production, because their regression
coefficients were almost equal to the unity (
β
ˆi=1) and they had the lowest deviations from regression and high mean yields.Table 2 - Mean squares (MS) of theanalysis of variance for temporal stability parameter for 25 Hevea genotypes
(clones) evaluated over six years rubber yield in Votuporanga, Experimental Station in Northwestern region of São Paulo State, Brazil.
Source of variation DF MS
Genotypes 24 2002.3679**
Years 5 12670.7850**
Genotypes x Years 120 177.1590**
Genotypes within Years 125 676.9040**
Year (linear) 1 63353.9654**
Genotype x Year (linear) 24 284.4732**
Pooled deviation 100 144.3172
Fx 3899 4 210.4008*
Fx 985 4 118.5464
IAC 300 4 142.0634
IAC 301 4 311.1483**
IAC 302 4 60.3465
IAC 303 4 545.1644**
IAC 306 4 79.1920
IAC 307 4 31.5173
IAC 308 4 87.9197
IAC 309 4 76.9825
IAC 310 4 10.8315
IAC 311 4 102.6332
IAC 312 4 117.9125
IAC 313 4 50.9312
IAC 314 4 14.6253
IAC 316 4 95.3139
IAC 40 4 52.5829
IAC 56 4 238.2053 **
IAN 3156 4 515.1784**
IAN 3703 4 209.8998**
IAN 4493 4 89.2256
IAN 6323 4 102.7960
IAN 6721 4 95.1471
RO 45 4 290.5618**
RRIM 600 4 57.7847
Pooled error 288 65.1700
Braz. arch. biol. technol. v.51 n.1: pp.11-18, Jan./Feb. 2008
1 i
mˆ = m e a n o f t h e g e n o t y p e s ( c l o n e s ) , t e s t e d a c c o r d i n g t o T u k e y ’ s t e s t (P < 0 . 0 5 ) , 2
i
βˆ = m e a n r e g r e s s i o n c o e f f i c i e n t , * a n d * * s i g n i f i c a n t f o r P < 0 . 0 5 a n d P < 0 . 0 1 r e s p e c t i v e l y ( t - t e s t ) ; 3 ˆ2
i
d
S = d e v i a t i o n f r o m r e g r e s s i o n , * a n d * * s i g n i f i c a n t f o r P < 0 . 0 5 a n d P < 0 . 0 1 r e s p e c t i v e l y ( F - t e s t ) ;
4 2%
i
R = c o e f f i c i e n t o f d e t e r m i n a t i o n G e n o t y p e s 1
i
mˆ 2
i
βˆ 3 ˆ2
i d
S 4 2%
i
R
1 I A C 4 0 6 6 . 7 3 7 2 a 1 . 5 4 8 5 * * - 4 . 1 9 5 7 9 6 . 6 5 4 4
2 I A C 3 0 1 5 5 . 2 2 5 6 a - b 1 . 3 1 5 8 * 8 1 . 9 9 2 7 * * 7 7 . 9 0 2 3
3 I A C 5 6 5 4 . 3 9 8 3 a - c 1 . 5 6 6 1 * * 5 7 . 6 7 8 4 * * 8 6 . 7 0 8 3
4 I A C 3 0 0 5 2 . 7 2 1 7 a - d 1 . 1 4 3 7 2 5 . 6 3 1 1 8 5 . 3 6 6 6
5 I A C 3 0 3 5 2 . 5 9 1 1 a - d 1 . 5 9 5 2 * * 1 6 0 . 3 3 1 4 * * 7 4 . 6 9 5 4
6 R O 4 5 5 1 . 4 9 4 4 a - e 1 . 3 8 8 8 * * 7 5 . 1 3 7 2 * * 8 0 . 7 8 8 9
7 R R I M 6 0 0 5 0 . 0 6 8 3 a - f 1 . 3 1 1 9 - 2 . 4 6 1 7 9 4 . 9 6 7 2
8 I A N 3 1 5 6 4 8 . 7 1 8 9 a - g 0 . 3 5 2 1 * * 1 5 0 . 0 0 2 8 * * 1 3 . 2 3 0 1
9 I A C 3 0 7 4 2 . 6 3 1 7 b - h 1 . 1 6 8 1 - 1 1 . 2 1 7 5 9 6 . 4 8 2 1
1 0 I A C 3 0 2 4 1 . 4 4 1 1 b - h 0 . 8 9 5 2 - 1 . 6 0 7 8 8 9 . 3 7 7 2
1 1 I A C 3 0 8 3 9 . 7 6 8 3 b - g 1 . 1 0 9 2 7 . 5 8 3 2 8 9 . 8 6 4 6
1 2 I A C 3 1 3 3 9 . 4 3 6 7 b - h 1 . 1 4 1 9 - 4 . 7 4 6 2 9 4 . 1 9 3 4
1 3 I A N 3 7 0 3 3 8 . 6 3 2 2 b - h 1 . 1 4 4 6 4 1 . 3 5 1 8 * 8 1 . 4 3 4 4
1 4 F x 3 8 9 9 3 8 . 3 1 6 1 b - h 0 . 7 2 6 5 4 8 . 4 1 0 2 * 6 1 . 3 8 2 5
1 5 F x 9 8 5 3 6 . 3 8 6 1 b - h 0 . 6 4 7 8 * 1 7 . 7 9 2 1 6 9 . 1 5 9 6
1 6 I A C 3 0 9 3 4 . 3 8 3 9 c - h 0 . 9 1 0 9 3 . 9 3 7 5 8 7 . 2 2 5 6
1 7 I A N 4 4 9 3 3 3 . 2 3 3 3 d - h 0 . 8 1 2 0 - 1 8 . 4 2 3 4 9 7 . 6 8 4 8
1 8 I A N 6 7 2 1 3 1 . 9 5 0 6 e - h 1 . 0 0 5 6 9 . 9 9 2 3 8 7 . 0 6 9 9
1 9 I A C 3 1 1 3 1 . 7 0 3 3 e - h 0 . 9 3 7 8 1 2 . 4 8 7 7 8 4 . 4 4 5 2
2 0 I A C 3 1 0 3 1 . 5 2 0 6 e - h 0 . 7 3 5 6 - 1 8 . 1 1 2 8 9 6 . 9 3 7 0
2 1 I A N 6 3 2 3 3 1 . 4 1 7 2 f - h 0 . 9 3 1 8 1 2 . 5 4 2 0 8 4 . 2 5 3 6
2 2 I A C 3 1 6 3 0 . 9 2 0 0 g - h 0 . 7 3 4 2 1 0 . 0 4 7 9 7 8 . 1 8 3 9
2 3 I A C 3 1 2 2 9 . 0 0 2 8 g - h 0 . 7 1 4 5 1 7 . 5 8 0 8 7 3 . 2 8 8 5
2 4 I A C 3 0 6 2 8 . 6 1 6 1 g - h 0 . 4 9 8 3 * * 4 . 4 7 4 0 6 6 . 5 1 4 7
2 5 I A C 3 1 4 2 6 . 5 0 9 4 h 0 . 6 6 3 4 * - 1 6 . 8 4 8 2 9 5 . 0 1 7 1
1 1
mˆ = mean of the genotypes (clones), tested according to Tukey’s test (p<0.05), 2βˆ1= mean regression coefficient, * and ** significant for p <0.05 and
p<0.01 respectively (t-test); 3 2 di
Sˆ = deviation from regression coefficient, * and ** significant for p<0.05 and p<0.01 (F-test); 4R2i%
= coefficient of
determination
Table 3 - Estimates of temporal stability and adaptability parameters for rubber yield in grams/tree/tapping for 25
genotypes evaluated over six years in Votuporanga Experimental Station, Northwestern region of São Paulo State, Brazil.
Figure 1 - A representation of the genotype regression coefficients (βˆ ) plotted against rubber
Their coefficient of determination, R2, (Pinthus, 1973) were as high as 89.38, 96.48 and 94.19%, confirming their importance. In contrast, genotypes IAC 301, IAC 303, IAC 40, IAC 56 and RO 45 with regression coefficients greater than one, were regarded as adaptable to annual changes. Fig. 1 represents genotype regression coefficients plotted against the rubber yield clonal means. The genotype IAC 40 (βˆ =1.55) had a regression coefficient greater than unity and was highly vigorous and high yielding, hence it could characterized as suitable for the specific adaptation in favorable and unfavorable years. In addition, even the second place, the IAC 301, being less previsible with significant deviation from regression, should be selected because it presented low rank in all the annual evaluations. The locally adapted cultivars had regression coefficients close to unity, had above average yields and could, therefore, be characterized as well adapted to temporal changes. These genotypes also had smallest deviations from regression and, hence, could be regarded as stable genotypes. The genotypes IAN 6721, IAC 311 and IAC 316 that had regression coefficients smaller than unity and below average rubber yields, indicated that they offered a greater resistance to temporal changes. The regression coefficient measures the “relative” performance of the genotype. Clair and Kleinschmit (1986) emphasized that in forest tree breeding, this information was useful to distinguish genotypes for specific environments, but if all environments tested was in one planting zone, and each one represented the same proportion of area to be planted, then this information was irrelevant. Selection based on the overall mean was all that was necessary to assure the largest overall gains (Dias et al., 2003). Therefore the genotypes IAN 6721, IAC 313 and IAC 308 could be considered superior in future breeding programs in order to incorporate stability for rubber yield. According to Singh and Gupta (1988), it was possible that stable genotypes carried genes for the stability, useful in breeding programs because it facilitated economic production.
Finally, the following major findings could be summarized from this study. (1) Genotypes IAC 302, IAC 307 and IAC 313 were widely adaptable for rubber yield, and were thus, recommended for commercial release in Votuporanga. (2) The
significant genotype-year interaction and the change in ranks of genotypes across the years suggested a breeding strategy of specifically adapted genotypes in homogenously grouped environments. (3) Whenever new genotypes are proposed for commercial release, information on genotype-year interaction and stability clearly indicating their specific and or general adaptations needs to be available to the user. (4) The genotype IAC 40 was high yielding and vigorous, hence it could be considered as having suitable adaptation for favorable and unfavorable years.
ACKNOWLEDGEMENTS
The authors thank the State of São Paulo Research Foundation (FAPESP) and National Council for Scientific and Technological Development (CNPq) for their financial support for this study.
RESUMO
Braz. arch. biol. technol. v.51 n.1: pp.11-18, Jan./Feb. 2008 REFERENCES
Bataglia, O.C. and Gonçalves, P. de S. (2003), Tecnologia da adubação da seringueira, Informativo Apabor, 9, 3-4.
Becker, H.C. and Leon, J. (1988), Stability analysis in plant breeding. Plant Breeding,101: 1-23.
Ceccarelli, S. (1994), Specific adaptation and breeding for marginal conditions. Euphytica, 101, 105-109. Clair St., J.B. and Kleinschmit, J. (1986),
Genotype-environment interaction and stability in ten-year height growth of Norway Spruce clones (Picea abies Karst.). Silvae Genetica, 77, 177-186.
Cruz, C.D. and Carneiro, P.C.S. (2003), Modelos biométricos aplicados ao melhoramento genético. Viçosa: UFV, 584p.
Cruz, C.D. (2001), Programa Genes: versão Windows aplicativo computacional em genética e estatística. Viçosa: UFV, 641p.
Dias, L.A. dos S.; Manta, J.; Cruz, C.D., Barros, E.G. de and Salomão, T.M.F. (2003), Genetic distance and its association with heterosis cacao. Brazilian Archives of Biology and Technology, 46, 339-348. Eberhart, S.A. and Russell, W.A. (1966), Stability
parameters for comparing varieties. Crop Science, 6, 36-40.
Gonçalves, P. de S.; Cardoso, M.; Santos, I.C.I. dos; Martins, A.L.M.; Ortolani A.A. and Colombo, C.A. (1992), Selection of Hevea mother tree adapted to unpredictable annual climatic variability. Brazilian Journal of Genetics, 15, 137-147.
Gonçalves, P. de S.; Bortoletto, N.; Martins, A.L.M.; Costa, R.B. da and Gallo, P.B. (2003), Genotype-environment interaction and stability for girth growth and rubber yield of Hevea clones in São Paulo State, Brazil. Genetic and Molecular Biology, 36, 441-448. Kalil Filho, A.N. (1982), Potencial de produtividade e
estabilidade fenotípica na caracterização de clones de seringueira (Hevea spp.). MSc Thesis, University of São Paulo, Brazil.
Lin C.S.; Binns, M.R. and Lefkovitch, L.P. (1986), Stability analysis: Where do we stand? Crop Science,
26, 894-900.
Okuyama, L.A.; Federizzi, L.C. and Barbosa Neto, J.F. (2005), Gain yield stability of wheat genotypes under irrigated and non-irrigated conditions. Brazilian Archives of Biology and Technology, 48, 697-704. Pham, H.N.; Kang, M.S. (1988), Interrelationships
among respectability of several stability statistics estimated from international maize trials. Crop Science, 28, 925-928.
Piepho, H.P. (1998), Methods for comparing the yield stability of cropping systems: a review. Journal of Agronomy and Crop Science, 190, 193-221.
Pinthus, J.M. (1973), Estimate of genotype value: a proposed method, Euphytica, 22, 121-123.
Romagosa, I. and Fox, P.N. (1993), Genotype-Environment Interaction and Adaptation. In: Hayward, M.D.; Bosemark, N.O and Romagosa, I. (Eds.) Plant breeding: principles and prospects, New York: Chapman and Hall, p.373-390.
Singh, S.V. and Gupta, P.K. (1988), Phenotypic stability for tuber yield in potato (Solanum tuberosum L.). Indian Journal of Genetics, 48, 9-12.
Stringfield, G.H. and Salter, R.M. (1934), Differential response of corn varieties to fertility levels and to seasons. Journal of Agricultural Research, 49, 991-1000.
Truberg, M. and Huehn, H.G. (2000), Contributions of the analysis of genotype-environment interactions: comparison of different parametric and non-parametric tests for interaction. Journal of Agronomy and Crop Science, 185, 267-274.
Yates, F. and Cochran, W.G. (1938), Analysis groups of experiments. Journal of Agricultural Science, 28, 556-580.