INTRODUCTION
The rubber tree [Hevea brasiliensis (Willd ex Adr. de Juss.) Muell Arg] is a valuable market species because the rubber that it produces is widely used in industry. The main cultivation sites in Brazil, known as “escape areas”, are located in areas free of South American leaf blight, caused by Microcyclus ulei (P. Henn.) v. Arx. The plateau region of the State of São Paulo is the most important rubber-producing area in the country (Boock et al., 1995).
Genotype x environment interactions in perennial species have received considerable attention recently through the use of progeny tests set up in different loca-tions. Depending on whether they are controlled or not such interactions can lead to gains or losses in breeding programs (Zobel and Talbert, 1984).
The assessment of genotype x environment interac-tion is important in plant breeding since, depending on the degree of plant adaptation, the expression of a new ele-ment of the phenotypic trait may occur. This eleele-ment arises from the interaction between a given genotype and an environmental condition (Vencovsky and Barriga, 1992). If the interaction exists, the best genotype in one environment may not be the best in another (Cruz and Regazzi, 1994). This interaction influences the gain ob-tained in selection and hinders the recommendation of
cultivars with a wide ability to adapt. The effects of the genotype x environment interaction in the rubber tree have been recognized and widely used in Malaysia (Tan, 1995), Sri Lanka (Jayasekera, 1983; Jayasekera et al. 1977, 1984 a,b), Indonesia (Daslin et al., 1986), Nigeria (Onokpise et al., 1986), India (Menattoor et al., 1991) and, more re-cently, in Brazil (Gonçalves et al., 1990, 1991, 1998 a,b,c).
One of the main practical uses for genotype x envi-ronment interaction studies is the determination of an adequate number of experimental locations. The choice of the number of locations needed to evaluate the geno-types depends on the magnitude of this interaction (Resende, 1998). Generally, the practical relevance of the interaction has been inferred by considering the rela-tive magnitude of the genotype x environment interac-tion in relainterac-tion to the genetic variance obtained from the joint analysis of variance in several environments, and from the genetic correlation among materials in the en-vironments studied (Ramalho et al., 1993; Resende, 1998).
The present study quantified the genotype x environ-ment interaction effect for several traits, and also deter-mined the ideal number of experimental locations based on estimates of the genetic correlation among progenies in the different locations and on estimates of the genetic gain from indirect selection.
Genotype-environment interaction and the number of test sites for the genetic
improvement of rubber trees (
Hevea
) in São Paulo State, Brazil
Reginaldo Brito da Costa1, Marcos Deon Vilela de Resende2, Antonio José de Araujo3,
Paulo de Souza Gonçalves4 and Antonio Lúcio Mello Martins5
Abstract
The present study quantifies the possible genotype-environment interactions and determines the ideal number of test sites for rubber trees
[Hevea brasiliensis (Willd ex Adr. de Juss.) Muell Arg] in the plateau region of São Paulo State. The study was based on the genetic
correlation among progenies at three different sites and on estimates of genetic gains with indirect selection of rubber trees. Twenty-two half-sib progenies were planted at the Jaú, Pindorama and Votuporanga experimental stations using random blocks with five replications and 10 plants per plot. At three years of age, the plants were evaluated for their total number of latex ring vessels (NR), rubber production (RP), bark thickness (BT) and girth (SG). There was significant genetic variability in the characters RP, SG and BT, mainly among progenies from Pindorama and Votuporanga. The effects of genotype-site interactions were significant for RP and SG. The finding of significant interactions was not a complicating factor because of the large genetic correlation detected. These results indicate that the use of two sites is more profitable when the gains in efficiency of selection are greater than 10%. Thus, Pindorama and Votuporanga will satisfactorily attend the studied region.
1Curso de Biologia - NUTEMA, Universidade Católica Dom Bosco (UCDB), Av. Tamandaré, 6000, Jardim Seminário,
Caixa Postal 100, 79117-100 Campo Grande, MS, Brasil. E-mail: [email protected]
2Embrapa - Centro Nacional de Pesquisa de Florestas (CNPF), Caixa Postal 319, 83411-000 Colombo, PR, Brasil. 3Departamento de Silvicultura e Manejo, Universidade Federal do Paraná (UFPR), Caixa Postal 886, 80001-970 Curitiba, PR, Brasil.
4Programa Seringueira, Centro de Café e Plantas Tropicais, Instituto Agronômico de Campinas (IAC). Caixa Postal 28, 13001-970
Campinas, SP, Brasil. Send correspondence to P.S.G. E-mail: [email protected]
MATERIAL AND METHODS
Genetic material
The genetic material consisted of 22 half-sib prog-enies from open-pollinated seeds obtained from 22 paren-tal clones phenotypically selected from an H. brasiliensis population of Asian origin. The following parental clones were selected: AVROS 49, AVROS 255, AVROS 352, AVROS 363, AVROS 1328, AVROS 1126, C 22, C 256, C290, C 297, C 318, GT 127, GT 711, PB 49, PB 86, PB 5/ 63, PR 107, RRIM 513, RRIM 600, Tjir 1 and Tjir 16.
Experimental sites
The progeny tests were set up at three experimental stations belonging to the Instituto Agronômico de Cam-pinas (IAC), located in different rubber tree cultivation regions in São Paulo State:
a) Jaú experimental station: latitude 22º17’S, longi-tude 48º34’W, altilongi-tude 580 m. The soil is dark red latosoil, alico, clay texture, deep and flat with a well-drained to-pography. An Aw (Köppen) climate predominates in this region, with a defined dry season, annual mean tempera-ture of 21.6ºC, average humidity of around 70% with ex-tremes of 77% in February and 59% in August. The mean annual rainfall is around 1,344 mm.
b) Pindorama experimental station: latitude 21º13’S, longitude 48º56’W, altitude 560 m, with red-yellow pod-zolic soil TB eutrophic, medium texture, deep, abrupt and well drained (Lepsch and Valadares, 1976). The climate is tropical, with a wet summer and a dry winter period. Mean monthly temperatures vary from 16.6 to 28.9ºC, and an-nual mean rainfall is 1,390.3 mm. The period from Octo-ber to April usually has favorable precipitation for growth and production. Precipitation deficiencies and low tem-peratures occur from May to September.
c) Votuporanga experimental station: latitude 20º25’S, longitude 49º50’W, altitude 450 m. The soil is podzolic sandy phase type and the climate, tropical, with a hot wet summer and a dry winter, with low temperatures and rainfall. Mean monthly temperatures varies from 20 to 25ºC and annual mean rainfall ranges from 1,087 to 1,537 mm. The winter drought varies from four to six dry months, with an average water deficiency of 180 mm.
The seeds were collected at the IAC Experimental Center in Campinas, germinated in polyethylene bags at the three experimental stations and taken to the definitive locations with two leaf whorls.
Statistical design and measurements
The seedlings were set out in a randomized complete block design with 22 treatments, five replications and 10 plants per plot spaced at 1.5 x 1.5 m in single rows. The progenies were assessed when they were three years old.
Yield determination in dry rubber (RP) was done us-ing the Hamker-Morris-Mann test (HMM) (Tan and Subramaniam, 1976), as follows: thirty tappings were done with a half-spiral alternate daily (1/2 S d/2) tapping sys-tem at a height of 20 cm from the ground. The yield was recorded by cup coagulation. The “coagula” were air dried for two months until they gave a constant weight. The re-sults were expressed in grams per tapping.
Virgin bark samples were removed from the trunk as plugs at 20 cm high on the opposite side of the tapping panel. Bark thickness (BT) was measured using the sample for each progeny.
The total number of latex vessel rings (NR) in lon-gitudinal and transverse sections of the bark sample was determined. Details of the procedure are described by Gonçalves et al. (1996). Girth was measured using a steel measuring tape at 0.50 m from the ground.
Biostatistical analysis
Joint analysis of variance
The mathematical model used considered locations and genotypes as random effects and was equivalent to the following equation described by Cruz and Regazzi (1994):
Yijk= µ + Gi + Aj + GAij + B/Ajk + εijk
where Yijk = observed value of the ith progeny of the jth environment in the kth replications, µ = general mean, G i = effect of the ith genotype (i = 1,2, ...22), Aj: effect of the jth environment (j = 1,2,...3), GAij = effects of the interaction of the ith progeny with the jth environment, B/ Ajk= effect of the kth block within the jth environment, and εijk = random error.
The expected mean squares (Table I) were determined using the randomized complete block design for the joint analysis based on Cruz and Regazzi (1994). The genetic correlation among the pairs of locations for each trait un-der study was obtained as suggested by Yamada (1962), us-ing the followus-ing expression:
rg =
where rg = coefficient of correlation between the two loca-tions for a certain trait, σ2
g1 = genetic variance at location 1, σ2
g2 = genetic variance at location 2, σ2g = joint genetic variance of the joint analysis, and σ2
ge = variation of the prog-enies x environment interaction.
Number of experimental locations needed
The most adequate number of experimental locations was obtained from the genetic correlation estimate. This
[σ2
g + σ2ge - 0.5(σg1- σg2)2]
was calculated using the estimators obtained by Resende (1998) from F-values of the joint analysis involving the three locations for the sources of variation (genetic ma-terial and genotype x environment interaction).
σ2 ge/σ2g =
rgg =
where rgg = genetic correlation between the material in the environment, l = number of environments or locations in-cluded in the joint analysis of variance, F = F obtained for the genotype effect and F* = F obtained for the genotype x environment interaction. Once the results rgg had been ob-tained, the values tabulated by Resende (1989) were used to determine the ideal number of experimental locations.
Heritability estimates
Narrrow sense heritabilities determined on an indi-vidual basis for each site were calculated according to Resende and Higa (1994), using the following equation:
h2 ib=
where, σ 2
p = variance due to differences among prog-enies = ¼ σ 2
A .(σ 2A = additive genetic variance); σ 2e = variance due to interaction of progenies and replication;
σ 2
w = variance due to differences among plants within plots.
Expected progress with selection
The expected progress with selection among half-sib progeny means for each trait, in each of the situations de-scribed below, was calculated using the expression dede-scribed by Resende (1989). The following situations were considered:
a) Direct progress - Selection and progress in a single envi-ronment:
Gs(i/i) =
where K =standardized selection differential, σ Fi = esti-mate of phenotypic deviation among progeny means in the ith environment, σ 2
gi = estimate of the genetic variance among progenies in the ith environment.
b) Indirect progress - selection in one environment (jth) and progress in another (ith):
Gs(i/j)=
where σ 2
gij = estimate of genetic covariance among prog-eny means in the ith and jth environments, and σ Fj = esti-mate of the standard phenotypic deviation among progeny means in the jth environment.
c) Selection based on the mean of the ith, jth and kth envi-ronments and progress in individual envienvi-ronments:
Gs(j/ijk)=
where σFijk = estimate of the standard phenotypic devia-tion among progeny means in the ith, jth and kth environ-ments obtained from the joint analysis of variance, and
σ2
gkj = estimate of genetic covariance among progeny means in the kth and jth environments.
d) Selection based on the means of the ith and jth environ-ments and progress in the ith environment.
Gs(j/ij)=
The other environment combinations were considered (1 - 1/F*)
F - 1 l
σ2 g
+ σ2
ge
σ2 g
(F - 1) + l(1 - 1/F*) (F - 1) + (l - l/F*)
= F - 1 = F - 1
σ 2
p + σ 2e + σ 2w
4σ 2 p
σ 2 gij K
σ Fj
σ 2 gi K
σ Fi
K [σ2
gj + σ2gij + σ2gkj]
3σ Fijk
[σ2 gi + σ2gij] K
2σ Fj
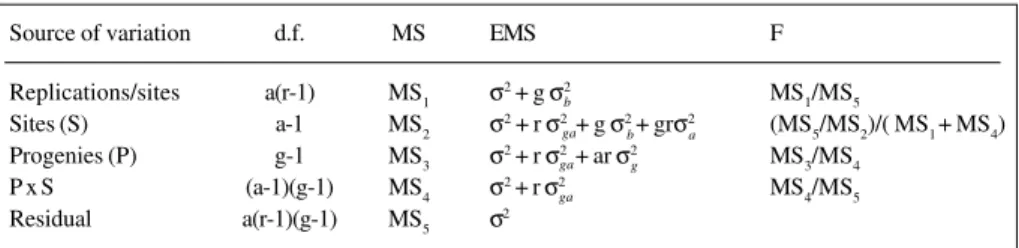
Table I - Degrees of freedom (d.f.) and expected mean squares (EMS) of joint analyses for estimating the components of variance.
Source of variation d.f. MS EMS F
Replications/sites a(r-1) MS1 σ
2 + g σ2 MS
1/MS5
Sites (S) a-1 MS2 σ
2 + r σ2 + g σ2 + grσ2 (MS
5/MS2)/( MS1+ MS4)
Progenies (P) g-1 MS3 σ
2 + r σ2 + ar σ2 MS 3/MS4
P x S (a-1)(g-1) MS4 σ2 + r σ2 MS
4/MS5
Residual a(r-1)(g-1) MS5 σ 2
σ2 : Variance due to differences among progeny variance; σ2 : variance due to differences among sites; σ2 :
variance among replications; σ2
: variance due to interaction of progenies and sites; r: number of replica-tions within each site; a: number of sites; g: number of progenies; b: number of replicareplica-tions.
b ga ga ga
b g
a
g a b
in the calculations of the expected progress in each of the above items. The mean progress in the three environments was obtained using the following expressions (Resende, 1989):
a) Selection in each environment and average progress in the three locations:
Gs(ijk/k) = [Gs(k/k) + Gs(i/k) + Gs(j/k)]
Gs(ijk/j)= [Gs(j/j) + Gs(i/j) + Gs(k/j)]
Gs(ijk/i) = [Gs(i/i) + Gs(j/i) + Gs(k/i)]
b) Selection using the mean of two locations and progress in the mean of the three locations:
Gs(ijk/ij) = [Gs(i/ij)) + Gs(j/ij) + Gs(k/ij)]
Gs(ijk/ik) = [Gs(i/ik) + Gs(j/ik) + Gs(k/ik)]
Gs(ijk/jk) = [Gs(i/jk) + Gs(j/jk) + Gs(k/jk)]
c) Selection using the mean of the three locations and the average progress in the three locations.
Gs(ijk/ijk) = [Gs(i/ijk) + Gs(j/ijk) + Gs(k/ijk)]
RESULTS AND DISCUSSION
Joint analysis of variance
Joint analysis of variance for all the locations
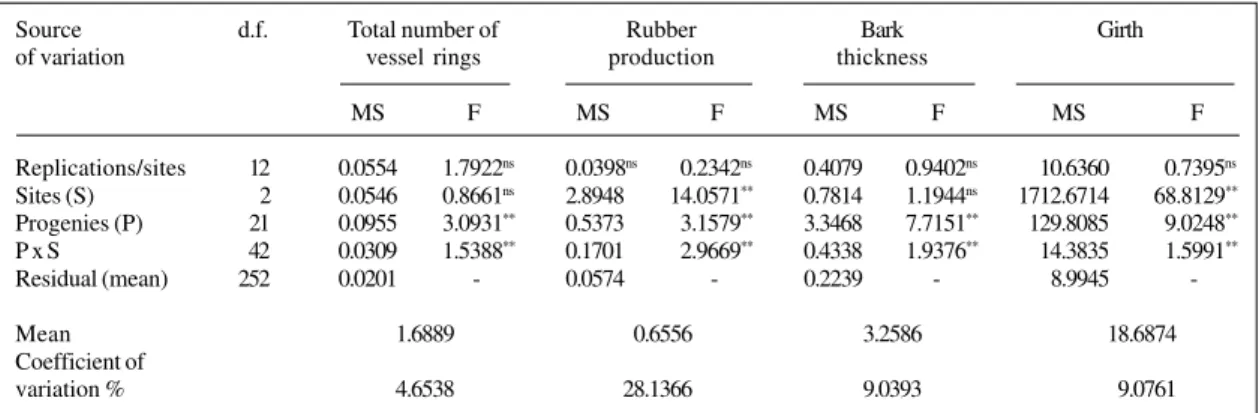
The four traits studied showed significant genetic variation among progenies based on the F-values from the joint analy-ses of variance (Table II). These variations indicate good prospects for selection among progenies and for continu-ity in the genetic breeding program.
In the joint analysis of variance for locations, the experimental coefficients of variation (CV%) showed higher values for dry rubber production and lower values for girth, bark thickness and total number of latex vessel rings. These values express intrinsic properties of the traits. The values were of low to medium magnitude for field experiments (Pimentel Gomes, 1982) and were therefore accurate in the experiments.
The effect of location, expressed by F-values in the joint analysis of variance, was significant for dry rubber production and girth, but not for the total number of latex vessel rings and bark thickness, indicating that these traits were less affected by local variation under the conditions of the present study. The effect of progeny x location in-teraction was significant for all the traits studied. Signifi-cant results for progeny x year interaction for this spe-cies were reported by Gonçalves et al. (1991) for rubber production, and by Gonçalves et al. (1998b) for girth. According to Vencovsky (1978), the progeny x location interaction reflects the difference in the variability among progenies and the lack of correlation among materials from different locations. Kageyama (1980) pointed out that for selection purposes, the second component of interaction would be the most important as it allows inferences about the efficiency of indirect selection, i.e., selection in one location and genetic gain in another.
Although the three experimental locations were lo-cated at similar latitudes, longitudes and altitudes in the plateau region of São Paulo State, the performance of the genotypes was very variable. This suggests that other en-vironmental factors such as soil fertility, as well as soil type and structure may interfere with performance (Pinheiro et al., 1980; Pushparajah, 1983; Huang and Zheng, 1983).
Joint analysis of variance for two locations (Pindorama and Votuporanga)
Joint analyses of variance for all the traits studied at Pindorama and Votuporanga (Table III) showed the same trend in genetic variation as the joint analyses of all the locations. Exceptions were NR (among progenies) and SG (locations and locations x progeny interaction effects), which had nonsignificant F-values, suggesting that these traits were less affected by the site conditions.
As with the joint analysis for all the traits, the ex-perimental coefficients of variation were greater for dry rubber production and lower for girth, bark thickness and the number of latex vessel rings. The progenies x location interaction effects were also similar to that obtained by the joint analysis of all the locations, with higher and more significant values for the RP traits. However, the interac-tions for NR and BT were not significant. These results may reflect high affinity for the soil-climate conditions of the locations analyzed.
A high genetic correlation between the two locations was found for materials in the environments for BT, SG and RP but there was a low correlation for NR. The high correlation of the genetic material in the environments indicated that a single breeding program could satisfacto-rily serve both locations. This assertion is valid for RP, BT and SG, which can be better characterized using the con-cept of genetic correlation among locations (Vencovsky and Barriga, 1992).
1 3
1 3
1 3
1 3
1 3
1 3
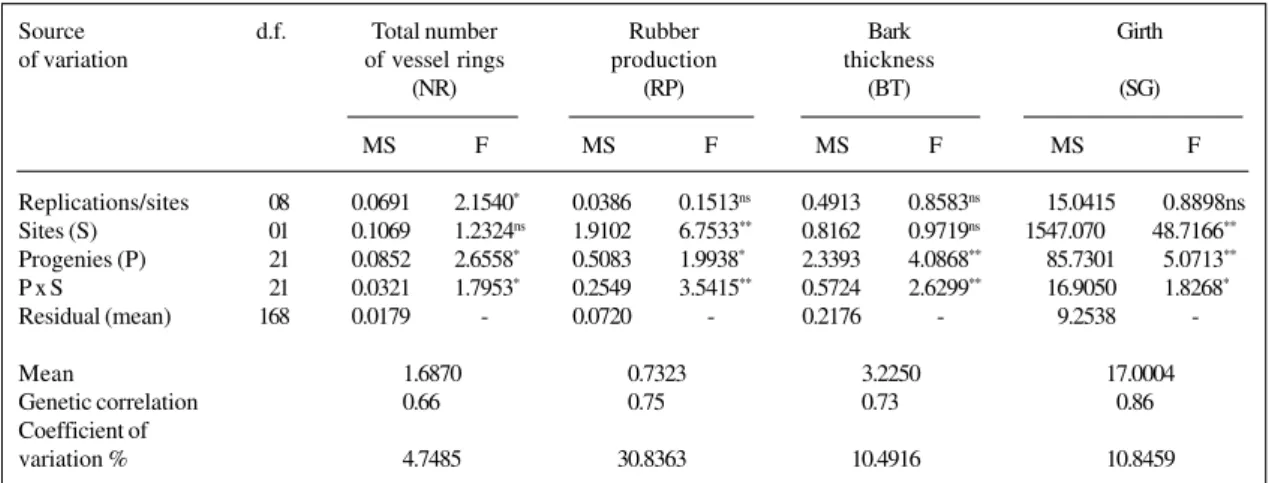
Joint analysis of variance for two locations (Pindorama and Jaú)
The results of the joint analysis involving Pindorama and Jaú (Table IV) showed greater genetic variability among progenies than those for Pindorama and Votuporanga. The analyses were based on significant F-values for all the traits studied, although the observed values were less expressive for RP, BT and SG. The experimental coefficients of varia-tion had the same tendency as those obtained in the previ-ous joint analyses, with a greater value for RP and lower values for SG, BT and NR.
As with the joint analysis for Pindorama and Votupo-ranga, the location effect showed less expressive or signifi-cant values for RP and SG. Less expressive and nonsignifisignifi-cant values were obtained for NR and BT, indicating that these traits were less affected by environmental variations at the test sites. The effect of the progenies x location interaction gave significant F-results for all the traits as in the joint analysis of all locations, again with more expressive and
significant results for RP and BT. This finding agrees with the results obtained by Gonçalves et al. (1991, 1998a).
Generally, there was a tendency for greater variability in the genotype performance when compared to the results obtained for Pindorama and Votuporanga. Although the envi-ronmental conditions were not very different, other factors, mainly the soil (fertility, structure and type), may have in-terfered with genotype performance (Pinheiro et al., 1980). The genetic correlation obtained for Pindorama and Jaú was high for RP, BT, SG and medium for NR. The highest val-ues, however, were smaller than those from the analysis of Pindorama and Votuporanga. As in the previous analysis, these results characterize the interaction for RP, BT and SG. This indicates that only one breeding program for these charac-ters will attend satisfactorily the region of the envolved places.
Joint analysis of variance for two locations (Votuporanga and Jaú)
The joint analyses of variance for all traits at the above
Table II - Mean squares (MS) and F-values from ANOVA of the total number of vessel rings (NR), rubber production (RP), bark thickness (BT) and girth (SG) for 22 Hevea progenies established at three sites. São Paulo State, Brazil.
Source d.f. Total number of Rubber Bark Girth
of variation vessel rings production thickness
MS F MS F MS F MS F
Replications/sites 12 0.0554 1.7922ns 0.0398ns 0.2342ns 0.4079 0.9402ns 10.6360 0.7395ns
Sites (S) 2 0.0546 0.8661ns 2.8948 14.0571** 0.7814 1.1944ns 1712.6714 68.8129**
Progenies (P) 21 0.0955 3.0931** 0.5373 3.1579** 3.3468 7.7151** 129.8085 9.0248**
P x S 42 0.0309 1.5388** 0.1701 2.9669** 0.4338 1.9376** 14.3835 1.5991**
Residual (mean) 252 0.0201 - 0.0574 - 0.2239 - 8.9945
-Mean 1.6889 0.6556 3.2586 18.6874
Coefficient of
variation % 4.6538 28.1366 9.0393 9.0761
1Total number of NR, RP, BT and SG are expressed in unit, g, mm, and cm, respectively. * P < 0.05, ** P < 0.01, ns = nonsignificant.
Table III - Mean squares (MS) and F-values from ANOVA of the Pindorama and Votuporanga sites for four traits of 22 three-year-old open pollinated progenies of Hevea. São Paulo State, Brazil.
Source d.f. Total number Rubber Bark Girth
of variation of vessel rings production thickness
(NR) (RP) (BT) (SG)
MS F MS F MS F MS F
Replications/sites 08 0.0321 0.7548ns 0.0404 0.1889ns 0.2437 0.9179ns 6.5307 0.3762ns
Sites (S) 1 0.0147 0.4902ns 5.7445 22.8349** 0.0880 0.6202ns 319.2045 13.7914**
Progenies (P) 21 0.0641 1.5047ns 0.5666 2.6491* 2.7623 10.4041** 105.2553 6.0638*
P x S 21 0.0426 1.9456** 0.2139 3.4301** 0.2655 1.1655ns 17.3579 1.6931*
Residual (mean) 168 0.0219 - 0.0624 - 0.2278 - 10.2520
-Mean 1.7009 0.6639 3.3059 20.8568
Genetic correlation 0.39 0.79 0.98 0.86
Coefficient of
variation % 5.4257 31.1570 6.9701 8.9334
two locations (Table V) showed significant genetic varia-tion among progenies. A small variavaria-tion in magnitude among the values was obtained for NR, RP and BT, but this was greater for SG. These variations still indicated good perspectives for the selection of progenies and for conti-nuity in the genetic breeding program at Votuporanga and Jaú. As with the previous joint analyses, the experimental coefficients of variation were higher for RP and lower for BT, SG and NR. This analysis showed the lowest coeffi-cient of variation for the RP trait, suggesting greater ac-curacy in the field trails.
The location effect yielded significant values for RP and SG. Less expressive (nonsignificant) values were ob-tained for NR and BT, again showing that these traits were less affected by environmental variation. The effect of the progeny x location interaction was significant only for the BT trait. Values of less extent were obtained for NR, RP
and SG, showing that these traits were less affected by variation between the locations involved.
The genetic correlation was higher for SG, RP and BT and lower for NR. These results characterized small interactions for RP, BT and SG, and indicated that a single breeding program could satisfactorily serve the region covering these two locations.
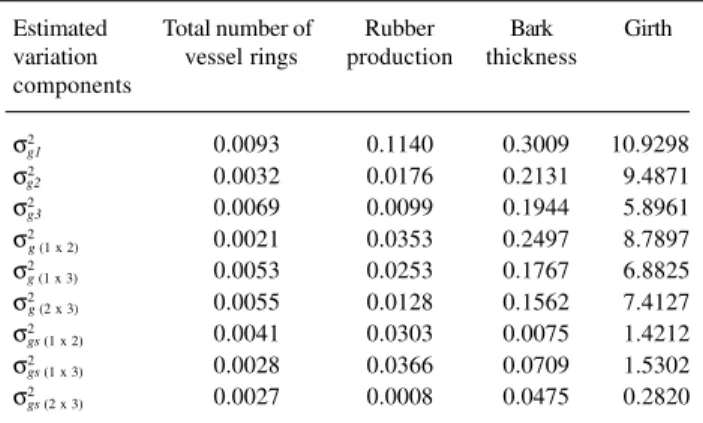
Adequate number of experimental locations
Using the estimated values (Tables VI and VII) and uti-lizing the table of estimators presented by Resende (1998) it was possible to determine the ideal number of experi-mental locations as follows:
a) Total number of latex vessel rings: considering the val-ues of (σ2
ge / σ2g ) = 0.501 and rgg= 0.666, the efficiency of selection based on the mean of two and three locations for
Table V - Mean squares (MS) and F-values from ANOVA of the Votuporanga and Jaú sites for four traits of 22 three-year-old open pollinated progenies of Hevea. São Paulo State, Brazil.
Source d.f. Total number Rubber Bark Girth
of variation of vessel rings production thickness
(NR) (RP) (BT) (SG)
MS F MS F MS F MS F
Replications/sites 08 0.0648 3.6017** 0.0461 0.9762ns 0.4886 1.0541ns 10.3358 1.1629ns
Sites (S) 01 0.0423 0.0758ns 1.0295 13.4154** 1.4402 1.7502ns 3271.7389 170.5837**
Progenies (P) 21 0.0726 4.0361** 0.1697 4.0854** 2.0258 4.3702** 83.0150 9.3405**
P x S 21 0.0180 0.8798ns 0.0415 1.1007ns 0.4635 2.0490** 8.8876 1.1885ns
Residual (mean) 168 0.0205 - 0.0377 - 0.2262 - 7.4778
-Mean 1.6789 0.5707 3.2450 18.2050
Genetic correlation 0.59 0.98 0.77 0.99
Coefficient of
variation % 3.5737 15.9750 9.3833 7.3235
1Total number of NR, RP, BT and SG are expressed in unit, g, mm, and cm, respectively. * P < 0.05, ** P < 0.01, ns = nonsignificant.
Table IV - Mean squares (MS) and F-values from ANOVA of the Pindorama and Jaú sites for four traits of 22 three-year-old open pollinated progenies of Hevea. São Paulo State, Brazil.
Source d.f. Total number Rubber Bark Girth
of variation of vessel rings production thickness
(NR) (RP) (BT) (SG)
MS F MS F MS F MS F
Replications/sites 08 0.0691 2.1540* 0.0386 0.1513ns 0.4913 0.8583ns 15.0415 0.8898ns
Sites (S) 01 0.1069 1.2324ns 1.9102 6.7533** 0.8162 0.9719ns 1547.070 48.7166**
Progenies (P) 21 0.0852 2.6558* 0.5083 1.9938* 2.3393 4.0868** 85.7301 5.0713**
P x S 21 0.0321 1.7953* 0.2549 3.5415** 0.5724 2.6299** 16.9050 1.8268*
Residual (mean) 168 0.0179 - 0.0720 - 0.2176 - 9.2538
-Mean 1.6870 0.7323 3.2250 17.0004
Genetic correlation 0.66 0.75 0.73 0.86
Coefficient of
variation % 4.7485 30.8363 10.4916 10.8459
selection at a single location was 10, 13 and 15%, respec-tively. Thus, the use of only two experimental locations was considered adequate since it would be advantageous to use a further location only if the efficiency gain were greater than 10%.
b) Rubber production: considering the values of (σ2 ge /σ2g) = 0.922 and rgg= 0.520, the efficiency of selection based on the mean of two, three and four locations in relation to selection at a single location was 14, 21 and 25%, respec-tively. Again, the use of only two experimental locations would be suitable.
c) Bark thickness: considering the values of (σ2
ge / σ2g) = 0.216 and rgg = 0.822, the efficiency of selection based on the mean of two and three locations, compared with selection at a single location, was 4 and 6%, respectively. Thus, the use of a single experimental location would be adequate.
d) Girth: considering the values of (σ2
ge / σ2g) = 0.140 and rgg= 0.877, the efficiency of selection based on the mean of two and three locations in relation to selection at a single location was 2 and 3%, respectively. As with the previous item, the use of only one experimental location would be adequate.
Expected progress with selection
Narrow sense heritabilities estimated for total num-ber of vessel rings, rubnum-ber production, bark thickness and girth (Table VIII) varied among sites, showing higher values for rubber production in Pindorama, suggesting great pos-sibilities of genetic gain for this character at this site. The predictions of expected progress with selection (Table IX) assumed a selection intensity of 10% for all the traits. The values varied considerably among traits, with greater gains for RP. These values were within the limits obtained by Paiva (1980), Vasconcellos (1982), Moreti et al. (1994) and Boock et al. (1995). The results showed a tendency for greater gains, except for NR, when the selection took place in Pindorama and Votuporanga.
Based on the mean indirect gain for RP from
Pindo-Table VII - Estimated variance components of the interaction progenies x sites relative to genetic variance (σ2
/σ
2) and genetic correlation (r )
between the sites, in São Paulo State, Brazil.
Parameters Total number of Rubber Bark Girth vessel rings production thickness σ2
/σ2 0.501 0.922 0.216 0.140
r 0.666 0.520 0.822 0.877
ge g gg
ge g
gg
Table VI - Estimated variance components for Pindorama (σ2 ),
Votuporanga (σ2
), Jaú (σ
2
) joint analysis (σ
2) and progenies x sites
interaction (σ2
) for four traits used to estimate the correlations (r ) and
genetic gains in São Paulo State, Brazil.
Estimated Total number of Rubber Bark Girth variation vessel rings production thickness components
σ2 0.0093 0.1140 0.3009 10.9298
σ2 0.0032 0.0176 0.2131 9.4871
σ2 0.0069 0.0099 0.1944 5.8961
σ2 0.0021 0.0353 0.2497 8.7897
σ2 0.0053 0.0253 0.1767 6.8825
σ2 0.0055 0.0128 0.1562 7.4127
σ2 0.0041 0.0303 0.0075 1.4212
σ2 0.0028 0.0366 0.0709 1.5302
σ2 0.0027 0.0008 0.0475 0.2820
σ2
, σ
2
, σ
2
= Genetic variance of the joint analysis for Pindo-rama x Votuporanga, PindoPindo-rama x Jaú and Votuporanga x Jaú, respec-tively. σ2
, σ
2
, σ
2
= Variance of the interaction of Pindorama x Votuporanga x Jaú, respectively.
g1
g2 g3 g
g1 gg
g1 g2 g3 g (1 x 2)
g (1 x 3)
g (2 x 3)
gs (1 x 2)
gs (1 x 3)
gs (2 x 3)
g (1 x 2) g (1 x 3) g (2 x 3)
gs (1 x 2) gs (1 x 3) gs (2 x 3)
Table IX - Estimates of genetic gain in three-year-old open pollinated rubber tree progenies at the Pindorama, Votuporanga and Jaú sites in São Paulo State, Brazil.
Expected gain (%) Parameters
Gs(ijk/i) Gs(ijk/j) Gs(ijk/k) Gs(ijk/ij) Gs(ijk/ik) Gs(ijk/jk) Gs(ijk/ijk) Total number of vessel rings (NR) 5.06 4.16 6.06 5.96 6.46 5.79 6.54 Rubber production (RP) 42.66 38.47 30.78 45.04 44.00 34.68 45.32 Bark thickness (BT) 22.24 21.78 19.42 22.99 23.80 22.85 23.74
Girth (SG) 22.80 24.05 23.57 25.23 25.01 24.93 25.71
Gs(ijk/i)= Selection in Pindorama and expected gain at the three sites. Gs(ijk/j)= Selection in Votuporanga and expected gain at the three sites. Gs(ijk/k)= Selection in Jaú, and expected gain at the three sites. Gs(ijk/ij)= Selection based in Pindorama (i) and Votuporanga (j) means and expected gain at the three sites. Gs(ijk/ik)= Selection based in Pindo-rama (i) and Jaú (k) means and expected gain at the three sites. Gs(ijk/jk) =Selection based in Votuporanga (j) and Jaú (k) means and expected gain at the three sites. Gs(ijk/ijk)= Selection based in Pindorama (i), Votuporanga (j) and Jaú (k) means and expected gain at the three sites.
Table VIII - Narrow sense heritability coefficients based on individuals within the block (h2 ) for total number of vessel rings (NR), rubber
production (RP), bark thickness (BT) and girth (SG) for a population of 22
Hevea progenies determined at three sites in São Paulo State, Brazil. Heritabilities
Sites NR RP BT SG
Pindorama 0.17 0.61 0.51 0.36
Votuporanga 0.06 0.24 0.35 0.32
Jaú 0.11 0.11 0.30 0.33
rama and Votuporanga, which was almost the same as the mean gain with selection for the three locations, the use of the three locations is not justified. This conclusion agrees with the genetic correlation of the materials according to location and may also be explained by the genetic correla-tion of 0.98 (Table V) between Votuporanga and Jaú, which shows that when Votuporanga was used as an experimental location, the inclusion of Jaú did not add substantial infor-mation for the breeder. The two locations have the same discrimination power for the genetic materials.
The use of only the Pindorama site should lead to a mean gain of 42.7% in the three locations. The inclusion of Votuporanga increased this gain to 45.04%, providing an additional 6% efficiency. The efficiency was lower than the mean efficiency of 10%, probably because of the hetero-geneity of the genetic variances observed at these locations. Thus, the breeder must judge whether this small increment is worthwhile. Based on these results, the use of the Pindorama and Votuporanga sites is suggested for continu-ing the breedcontinu-ing program, since together they satisfacto-rily serve the region covered by this study.
ACKNOWLEDGMENTS
The authors are grateful to Mr. Ari de Camargo, Mr. Isaac de Jesus and Mr. Edison Bernardes de Freitas, agricultural tech-nicians from Campinas, Votuporanga and Pindorama, respec-tively, for the field work; Mrs. Lígia Regina Lima Gouvêa and Mrs. Rosimeire Moreira Boschini, laboratory technicians from Rubber Tree Program of the Instituto Agronômico de Campinas for the laboratory work. R.B.C. is the recipient of a CAPES fellowship. Research and publication supported by the Fundação de Amparo à Pesquisa do Estado de São Paulo (FAPESP).
RESUMO
O presente estudo objetivou quantificar possíveis interações de progênie x local, bem como determinar o número ideal de locais de experimentação com base em estimativas de correlação genética entre progênies nos diferentes locais e estimativa de ganhos genéticos com seleção indireta em seringueira [Hevea brasiliensis (Willd ex Adr. de Juss.) Müell. Arg.]. Vinte e duas progênies de meio-irmãos foram plantadas nas Estações Experimentais de Jaú, Pindorama e Votuporanga, todas em SP, no delineamento de blocos ao acaso, com cinco repetições e dez plantas por parcela. Aos três anos de idade foram avaliados os caracteres: número total de anéis de vasos laticíferos, produção de borracha seca, espessura da casca e perímetro do caule. Os resultados demonstraram haver variabilidade genética significativa entre progênies para os caracteres produção, perímetro do caule e espessura da casca, evidenciados em Pindorama e Votuporanga. O efeito da interação genótipo x locais significativos, especialmente para os caracteres produção de borracha e perímetro do caule, não é um fator complicador para o melhorista devido às altas correlações genéticas detectadas. Considerando ser vantajoso o uso de um local a mais apenas quando o ganho em eficiência for superior a 10%, no presente caso a utilização de dois locais de experimentação é a mais adequada. O uso dos locais Pindorama e Votuporanga atenderá satisfatoriamente a região de abrangência do estudo.
REFERENCES
Boock, M.V., Gonçalves, P. de S., Bortoletto, N. and Martins, A.L.M. (1995). Herdabilidade, variabilidade genética e ganhos genéticos para produção e caracters morfológicos em progênies jovens de seringueira.
Pesqui. Agropecu. Bras. 30: 673-681.
Cruz, C.D. and Regazzi, A.J. (1994). Modelos Biométricos Aplicados ao Melhoramento Genético. Universidade Federal de Viçosa, Viçosa.
Daslin, A., Baihaki, A., Danakusuma, T.M. and Haeruman, M.S. (1986). Genotypes x environment interaction in rubber and their implications in clonal selection. Bull. Perkaretan 4: 23-28.
Gonçalves, P. de S., Cardoso, M., Colombo, C.A., Ortolani, A.A., Martins, A.L.M. and Santos, I.C.I. (1990). Variabilidade genética da produção anual da seringueira: estimativas de parâmetros genéticos e estudo de interação genótipo x ambiente. Bragantia 49: 305-320.
Gonçalves, P. de S., Cardoso, M.A.M., Colombo, C.A. and Ortolani, A.
(1991). Clones de Hevea: influência dos fatores ambientais na produção e recomendação para o plantio. Boletim Técnico, 138, Instituto Agronô-mico de Campinas, Campinas.
Gonçalves, P. de S., Martins, A.L.M., Bortoletto, N. and Tanzini, M.R.
(1996). Estimates of genetic parameters and correlation of juvenile characters based on open pollinated progenies of Hevea.Braz. J. Genet.19: 105-111.
Gonçalves, P. de S., Bataglia, O.C., Santos, W.P. dos, Ortolani, A.A., Segnini Jr., I. and Shikasho, E.H. (1998a).Growth trends, genotype-environment interaction and genetic gains in six-year-old rubber tree clones (Hevea) in São Paulo State, Brazil. Genet. Mol. Biol. 21: 115-122.
Gonçalves, P. de S., Segnini Junior, I., Ortolani, A.A., Brioschi, A.P., Landell, M.G. and Souza, S.R. (1998b). Components of variance and genotype x environment interaction for annual girth increment in rub-ber tree. Pesqui. Agropecu. Bras. 33: 1329-1337.
Gonçalves, P. de S., Bortoletto, N., Fonsêca, F. da S., Bataglia, O.C. and
Ortolani, A.A. (1998c). Early selection for growth vigor in rubber tree genotypes in northwestern São Paulo State (Brazil). Genet. Mol. Biol. 21: 515-521.
Huang, Z. and Zheng, X. (1983). Rubber cultivation in China. In: Proceed-ings of the Rubber Research Institute of Malaysia Planters’ Confer-ence. Rubber Research Institute of Malaysia, Kuala Lumpur, pp. 31-47.
Jayasekera, N.E.M. (1983). A basis for selecting Hevea clones stable to unpredictable agroclimatic variability. Silvae Genet. 32: 181-185.
Jayasekera, N.E.M. and Karunasekera, K.B. (1984a). Effect of environment on clonal performance with respect to early vigour and yield in Hevea brasiliensis. In: Proceedings of the IRRDB Meeting on Hevea Physiol-ogy Explotation and Breeding. IRRDB, Montpellier, pp. 250-255.
Jayasekera, N.E.M., Samaranayake, P. and Karunasekera, K.B. (1977). Initial studies on the nature of genotype environment interaction in some Hevea cultivars.J. Rubber Res. Inst. Sri Lanka, 54: 33-39.
Jayasekera, N.E.M., Karunasekera, K.B. and Kearsey, M.J. (1984b.) Ge-netics of production traits in Hevea brasiliensis (rubber). I. Changes in genetic control with age. Heredity 73: 650-656.
Kageyama, P.Y. (1980). Variação genética em progênies de uma população de Eucalyptus grandis (Hill) Maiden. Doctoral thesis ESALQ, USP, Piracicaba.
Lepsch, I.F. and Valadares, J.M.A. (1976). Levantamento pedológico detalhado da Estação Experimental de Pindorama, SP. Bragantia 35: 13-40.
Menattoor, R.J., Vinod, K.K., Krushnakumar, A.K., Seturaj, M.R., Potty, S.N. and Sinha, R.R. (1991). Clone x environment interaction during early growth phase of Hevea brasiliensis. I. Clonal stability on girth.
Indian J. Nat. Rubb. Res. 4: 51-58.
Moreti, D., Gonçalves, P. de S., Gorgulho, E.P., Martins, A.L.M. and
Bortoletto, N. (1994). Estimativas de parâmetros genéticos e ganhos esperados com a seleção de caracteres juvenis em progênies de serin-gueira. Pesqui. Agropecu. Bras. 29: 1099-1109.
Onokpise, O.U., Olapade, O. and Mekako, H.U. (1986). Genotype x envi-ronment interaction in Hevea brasiliensis (Müell. Arg.). Indian J. Genet. 46: 506-511.
Pimentel Gomes, F. (1982). Curso de Estatística Experimental. Livraria Nobel S/A, São Paulo.
Pinheiro, E., Pinheiro, F.S.V. and Alves, R.M. (1980). Comportamento de alguns clones de Hevea em Açailândia, na região, pré-amazônica, maranhense. In: Anais do TerceiroSeminário Nacional da Serin-gueira. Sudhevea, ed., Brasília, pp. 101-129.
Pushparajah, E. (1983). Problems and potentials for establishing Hevea
under difficult environment conditions. Planter 59: 242-251.
Ramalho, M.A.P., Santos, J.B. and Zimmerman, M.J. (1993). Genética Quantitativa no Melhoramento de Plantas Autógamas com Aplicação ao Feijoeiro. UFGO, Goiânia.
Resende, M.D.V. (1989). Seleção de genótipos de milho(Zea mays L.)em solos contrastantes. Master’s thesis, ESALQ, Piracicaba.
Resende, M.D.V. (1998). Interação genótipo x ambiente e número adequado de locais de experimentação com base na estatística F de Snedecor da análise de variância conjunta. Bol. Pesqui. Florestal 37: 55-66.
Resende, M.D.V. de and Higa, A.R. (1994).Estimação de valores genéticos no melhoramento de Eucalyptus:Seleção de um caráter com base em informações do indivíduo e de seus parentes. Bol. Pesqui. Florestal 28/29:37-56.
Tan, H. (1995). Genotype x environment interaction studies in rubber (Hevea)clones. J. Nat. Rubb. Res.10:63-76.
Tan, H. and Subramaniam, S. (1976). A five-parent diallel cross analysis for certain characters of young Hevea seedlings. In: Proceedings of the International Rubber Conference. RRIM, ed., Kuala Lumpur, pp.13-16.
Vasconcellos, M.E.C. (1982). Análise do coeficiente de caminhamento (“path coefficient”) e estimativas de parâmetros genéticos em clones de seringueira(Hevea spp.). Master’s thesis, ESALQ, USP, Piracicaba.
Vencovsky, R. (1978). Herança quantitativa. In: Melhoramento de Milho no Brasil (Paterniani, E., ed.). Fundação Cargil, Campinas, pp.122-199.
Vencovsky, R. and Barriga, P. (1992). Genética Biométrica no Fito-melhoramento. Sociedade Brasileira de Genética, Ribeirão Preto.
Yamada, J. (1962). Genotype vs. environment interaction and genetic cor-relation of the same trait under different environment. Jpn. J. Genet. 37: 498-509.
Zobel, B.J. and Talbert, J. (1984). Applied Forest Tree Improvement. John Wiley & Sons, New York.