IN SIX-YEAR GIRTH GROWTH OF HEVEA CLONES
PAULO DE SOUZA GONÇALVES2, ALBERTO KAZUTOSHI FUJIHARA3, ALTINO ALDO ORTOLANI4, ONDINO CLEANTE BATAGLIA5,
NELSON BORTOLETTO6 and IVO SEGNINI JUNIOR7
ABSTRACT - Rubber tree [Hevea brasiliensis (Willd. ex Adr. de Juss.) Müell. Arg.] budgrafts of seven clones were evaluated on five contrasting sites in the plateau region of the São Paulo State, Brazil. The objective of this work was to study the phenotypic stability for girth growth. The experimental design was a randomized block design with three replications and seven treatments. Analysis of variance of girth at six-year plant growth indicated a highly significant clone x site interaction. Only linear sites and clone x site components of clone x year interaction were significant, indicating that the performance of clones over sites for this trait could be predicted. The clones GT 1 and PB 235 showed the greatest stability in relation to girth growth, with foreseen responses to change, introduced in the sites. The clones PB 235 and IAN 873 showed significative difference in relation to regression coefficient, representing clones with specific adaptability on favorable and unfavorable sites respectively. The clone GT 1 became the most promissory one in the study of stability and adaptability even showing low girth growth. Expected genetic gains from planting sites, along with estimates of clonal variance and repeatability of clonal means are generally greatest or close to the greatest when selection is done at the same site.
Index terms: rubber tree, Hevea brasiliensis, heritability, repeatability.
ESTABILIDADE FENOTÍPICA E GANHOS GENÉTICOS DE SEIS ANOS DE AVALIAÇÃO DO PERÍMETRO DO CAULE EM CLONES DE SERINGUEIRA
RESUMO - Enxertos de sete clones de seringueira [Hevea brasiliensis (Willd. ex Adr. de Juss.) Muell. Arg.] foram plantados em cinco diferentes locais da região do Planalto do Estado de São Paulo, objetivando o estudo da estabilidade do perímetro do caule. O delineamento experimental foi o de blocos casualizados, com três repetições e sete tratamentos. A análise de variância mostrou que a interação genótipos x locais foi altamente significativa. A maior parte da variação que se refletiu na estabilidade deveu-se à regressão linear das médias dos ambientes. Os clones GT 1 e PB 235 se apresentaram como os mais estáveis em relação ao perímetro do caule, com respostas previsíveis às mudanças introduzidas nos locais. Os clones PB 235 e IAN 873 mostraram diferenças significativas em relação ao coeficiente de regressão, correspondendo a clones de adaptabilidade específica para locais favoráveis e desfavoráveis, respectivamente. O clone GT 1 foi o mais promissor em termos de adaptabilidade e estabilidade, devido ao baixo desvio da regressão. Ganhos genéticos esperados nos locais, junto com as estimativas de variância clonal e repetibilidade, foram geralmente maiores quando a seleção foi feita no mesmo local.
Termos para indexação: Hevea brasiliensis, herdabilidade, repetibilidade.
1Accepted for publication on July 7, 1998.
Partially supported by FAPESP and Secretaria de Agricultu-ra e Abastecimento do Estado de São Paulo.
2Agronomist, Dr., Embrapa/Programa Integrado de São
Paulo, Programa Seringueira, Centro de Café e Plantas Tropicais, Instituto Agronômico de Campinas (IAC), Caixa Postal 28, CEP 13020-970 Campinas, SP. E-mail: [email protected]
3Forestry Engineer. Fellowship of the CNPq.
4Agronomist, Dr., Centro de Ecofisiologia e Biofisica, IAC.
5Agronomist, Dr., Centro de Solos e Recursos
Agroam-bientais, IAC.
6Agronomist, Núcleo de Agronomia do Noroeste, IAC,
Votu-poranga, SP.
7Agronomist, Gerente de Divisão Seringueira/Cambuhy
INTRODUCTION
Rubber tree [ Hevea brasiliensis ( Willd. ex Adr. de Juss.) Müell. Arg.] is one of the indigenous species from the tropical rain forest in the Amazon Basin. Their high commercial importance is well known for their latex production from which rubber is coagulated and processed and as a consequence the dry rubber yield determines the level of output. Traditionally, rubber in Brazil has been cultivated in the equatorial region, in a zone lying between 10ºN and 10ºS of the Equator. Cultivation was concentrated in this location as these areas provided the ideal environmental conditions, i.e. mean annual temperature of 26ºC ± 2ºC and high rainfall (1,800 to 3,000 mm) distributed throughout the year with 120 - 240 rainy days per year. Therefore, regions outside conventional zones are beginning to establish rubber due to an increasing world demand for the commodity. In the São Paulo State, Brazil, the rubber growing region, considered as an area well recognized as hospitable for the crop, lies between 20ºS and 21ºS, far beyond the normal limits.
Girth is an economically important character and is considered to be a measure of vigour. It determi-nes the age at which a clone can be exploited and defines the shortening of the uneconomic, immature period. Trees with large trunks have high timber values.
Therefore, one of the main tasks in Hevea breeding is the comparative evaluation of clones, either of those bred locally or imported from other countries, over a wide range of environments in the plateau region of São Paulo rubber planting areas. The testing of these planting materials in different environments is necessary due to the environmental influence on girth performance of rubber trees. In addition, it has also been observed that a particular clone which performs well in one environment may not perform as well in a different environment concerning a given set of clones. This phenomenon of clone genotype - environment (GE) interaction can therefore make conclusive assessment on the value of individual clones for final clonal recommendation to the planting industry.
No extensive studies have been performed on the phenotypic stability of vigour. In general, a large
amount of variation in girth is observed. According to Pushparajah (1980), many agroclimatic elements, such as dryness, temperature and rainfall, that affect several components of the growth of Hevea, contribute to a large variability.
Clones with various degrees of adaptability/ stability were identified in Malaysia (Tan, 1995), as a supplementary guide for Hevea clonal selection. In Sri Lanka, Jayasekera et al. (1977) estimated regression coefficients for first height, second height and survival rate of ten clones on eight sites. In Indonesia, Suhendi (1989) obtained regression estimates of sixteen clones tested in three locations. These authors illustrated the use of information as a guide in clonal planting recommendation .
Several methods have been proposed to analyze genotype x environment interactions (Freeman, 1973), but joining regression technique has been widely applied to agronomic stability (Finlay & Wilkinson, 1963; Eberhart & Russell, 1966; Perkins & Jinks, 1968). Although girth stability is one of the most important breeding objectives, a statistical measure of this trait is very seldom considered in a breeding programme of perennial crops like Hevea. The regression coefficient (bi) can be used to describe the general response to environmental conditions (Stringfield & Satter, 1934) and the mean squares deviations (S2
di) from linear regression
actually measure the vigour stability (Yates & Cochran, 1938; Eberhart & Russell, 1966).
In Brazil, Kalil Filho (1982) and Gonçalves et al. (1992) employed the method of Eberhart & Russell (1966) to study temporal yielding, where the environments were represented by different months and years through an environmental index obtained by the medium performance of all the genotype in each month and year.
The present study was conducted to examine the magnitude of the genotype - environment interaction on girth growth of rubber tree at the age of six-years, searching for clone stability and genetic gains.
MATERIAL AND METHODS
available at the establishing of the experiments. They were budgrafted onto one and a half-year-old rootstock seedlings (Tjir 1 x Tjir 16) raised in nurseries. The successful budgrafts were uprooted and planted in polyethylene bags. After the emission of the first flush of leaves, the experiments were established in the field. The budgraftings were planted at five contrasting sites in the plateau region of the State of São Paulo (Table 1). These sites represent the most important non traditional area of continental climate of rubber production.
The experiment at each site was set in a randomized complete block design with three replications. In all locations, except Matão, thirty plants were used in each plot. At Matão, a larger plot size of forty plants was used, due to the local facilities. Each plot consisted of five rows of six or eight plants. In all sites the girth of each tree was measured at 1.20 m above the highest point of the bud union.
Data from the sixth year girth for all sites combined were submitted to analysis of variance (ANOVA) using the following statistical model:
where
Yijk is the observed value of the ith clone of jth site in
the kth replication; m is the general mean;
Ci is the fixed effect of the ith clone (i= 1, 2 ... c, c = 7);
Sj is the effects of the jth site (j = 1,2...s, s = 5);
(CS) ijis the interaction between ith clone with the jth site;
R k(j) is the effect of kth randomized block with the jth site;
Eijkis the experimental error associated with ijkth observation.
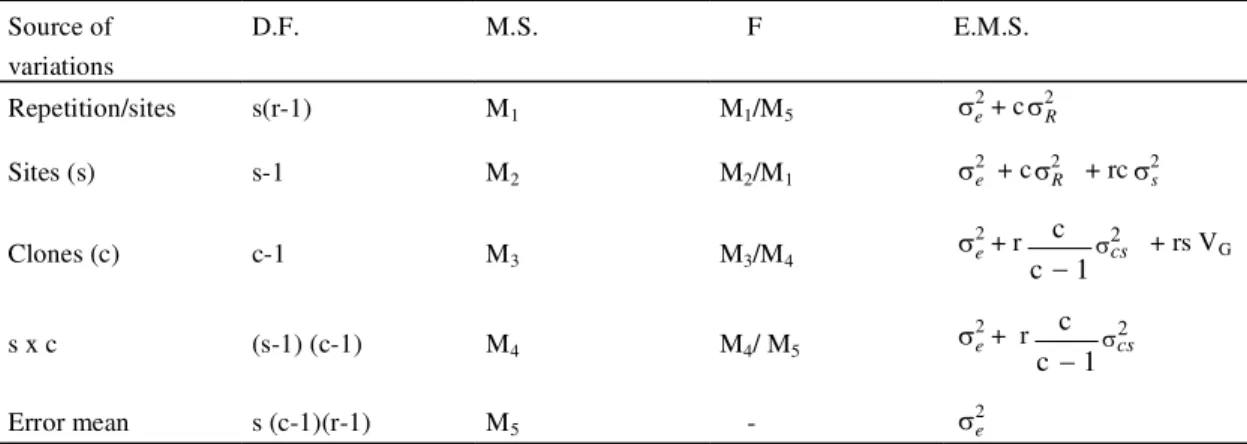
All effects were calculated through “Expected Mean Square” components given on the right side of the ANOVA (Table 2). Tukey’s test was applied to find out entries different from each other.
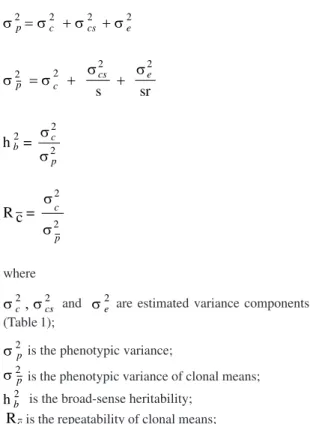
Estimated variance components were used to calculate phenotypic variance, broad-sense heritability, repeatability of clonal means; and genetic gain was estimated from algebric manipulation of the mean square (Vencovsky & Barriga, 1992), worked out as follows:
where
sc 2
, scs 2 and
se
2 are estimated variance components (Table 1);
s2p is the phenotypic variance;
s2p is the phenotypic variance of clonal means;
hb2 is the broad-sense heritability; c
R is the repeatability of clonal means; s is the number of sites;
r is the number of replications per site.
sp 2
= sc 2
+ scs 2
+ se 2
sp 2
= sc2 + scs
2
s +
se2 sr
hb
2= s
s
c
p 2 2
1The climatic data are in accordance with Centro de Ecofisiologia e Biofísica, IAC - arquivos Instituto Agronômico. TABLE 1. Geographic, climatic and edaphic characteristic of the five tested sites1.
Site Lat. Lon. Elev. Mean temp. (ºC) Mean rainfall (mm) Soil Physical Soil type S EE (m) Annual Growing
season Annual Growingseason nutrientstatus structuresoil
Matão 21º 25 48º 25 551 21.0 22.9 1,430 1,190 Medium Very good Podzolized soil of Lins Mococa 21º 28 47º 01 665 21.8 23.3 1,500 1,205 Good Good Red Yelow Latosol Indiana 22º 21 51º 30 467 21.5 23.4 1,265 926 Medium Medium Podzolized soil of Lins Ribeirão Preto 22º 11 47º 48 621 21.9 23.5 1,534 1,256 Good Poor Terra roxa extruturada Votuporanga 20º 25 49º 59 450 22.3 24.0 1,420 1,140 Medium Poor Podzolized soil Marília
Yijk = m + Ci+ Sj + (CS)ij + Rk(j) + Eijk,
R c = s
s
c
Genetic gain was calculated as
Ä
G= ip ó
c
R
(Falconer, 1981), where i is the intensity of selection and
s2p is the phenotypic standard deviation. In this study, i was assumed to be 0.82, which corresponds to selection of three clones out of seven (Becker, 1984). As the clone x site variance component increases relative clonal variance, the repeatability of clonal means decreases, and thus, genetic gains are reduced. One solution is to select clones with high stability. The technique of Eberhart & Russell (1966) was used in this study to characterize genotypic stability. The following linear regression model was used:
Yij = m + bi Ij + dij +
e
ij, where Yij is the mean of the clone ith at the site j;m is the general mean of clone i;
bi is the regression coefficient of the ith clone at the site
index which measures the response of this clone to varying sites;
Ij is the environmental index which is defined as the mean
deviation of all clones at a given site from the overall mean;
dij is the deviation from regression of the ith clone in the jth
site;
ij
e is the mean of experimental error.
With this methodology two parameters of stability were estimated: a) the regression coefficient, which is the regression of the performance of each clone under different site on the annual mean over all the clones, and b) the variance of the deviation (Sd2
i) from the regression line.
The contribution of sites in generating interactions was studied using a method developed by Burdon (1977). It considers growth in different sites as separate traits and calculates the genetic correlations between pairs of sites. In this evaluation, girth was used instead of height. Gain for selection at one site with planting at another is determined from the formula for correlated response to selection (Falconer, 1981). Estimated correlations can then be used to indicate which sites are the most similar to one another ( in terms of showing least interaction) and a matrix of expected gains can indicate which sites are best for testing.
The formula for expected gain at site y based on clonal selection at site x can be written as:
DGy.x = i Rcx rxy , where
i is the intensity of selection;
x c
R is the repeatibility of clonal means at site x; 2
ó
cyis the clonal component of variance at site y;
rxy is the correlation between clonal means at sites x and y.
Variance components and heritability of clonal means were estimated from analyses of variance performed separately for each site. The statistical model considered effects due to clone, repetition and error.
TABLE 2. Degree of freedom (D.F.), mean square (M.S.) and expected mean squares (E.M.S.) for analysis of variance (ANOVA)1.
Source of variations
D.F. M.S. F E.M.S.
Repetition/sites s(r-1) M1 M1/M5 s2e+ c
2
R s
Sites (s) s-1 M2 M2/M1 se
2 + c 2
R s + rcs2s
Clones (c) c-1 M3 M3/M4 se
2+ r
1 c
c
-2
scs + rs VG
s x c (s-1) (c-1) M4 M4/ M5 se
2+ r
1 c
c
-2
scs
Error mean s (c-1)(r-1) M5 - se
2
1 s = number of sites ( 5); c = number of clones (7); r = number of repetition (3); s2
s = variance due to sites differences; s
2
c = variance due to clonal
differences; s2e= variance due to clonal x site interaction;s2e = environmental variance among plots.
2
RESULTS AND DISCUSSION
Overall means and analyses of variance
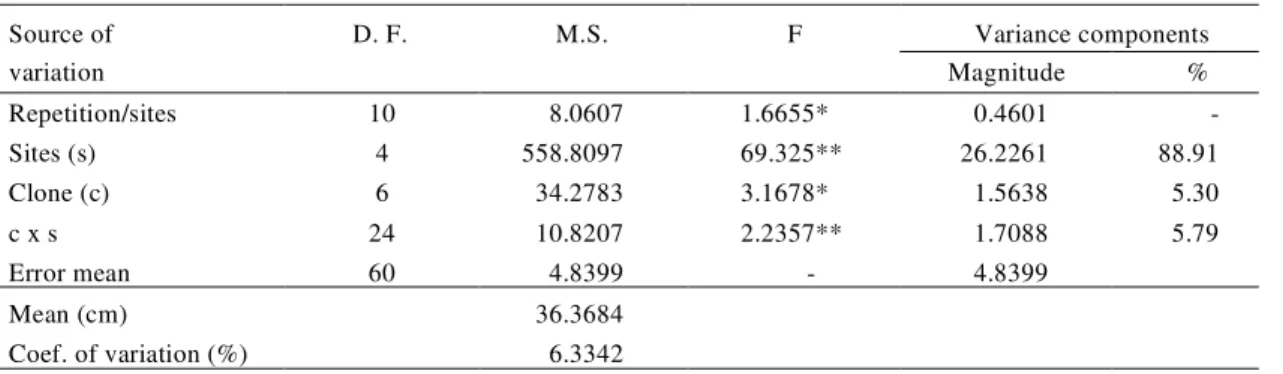
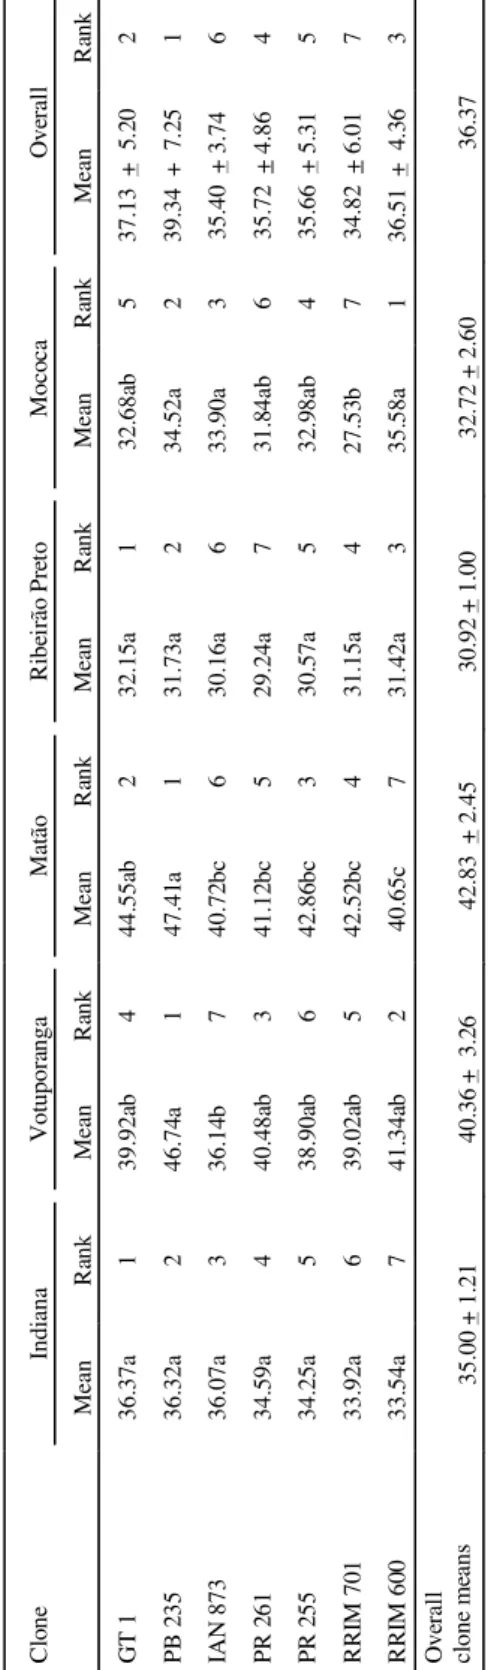
All effects, including clone x site interaction, were highly statistically significant (p < 0.01) in the overall analyses of variance (Table 3). There were significant differences among test sites for six-year girths. The significant clone x site interaction indicates that clones perform differently between sites. Of greater interest other than statistical significance is the importance of the interaction in reducing gains. The magnitude of the interaction component was almost the same to the clonal variance component (Table 3). Site means are given in Table 4. Matão was the top-ranked site with a mean of nearly 43.00 centimeters, 38% better than the bottom-ranked site of Ribeirão Preto. The facilities of a more hard budgrafts selection conducted in Matão before setting the experiment in the field was one of the reasons of higher growth. Overall clonal means ranged from 34.82 cm for clone RRIM 701 to 39.34 cm for clone PB 235. Clone PB 235 was particularly outstanding, ranking first at two sites and second at the other three sites (Table 4).
Broad sense heritability ( h2
b) overall for six-year girth growth was 0.23, which is relatively low. However, repeatability of clonal means (Rc) overall
was 0.79. The genetic gain based on a selection intensity of i= 0.82 was 5.55 cm, a gain of 15.26 percent above the overall mean. If the three top clones are selected and genetic gain is calculated based on the
observed selection differential, the genetic gain is 14.40 cm, 40% above de overall mean. The difference between the two gain estimates results from the outstanding girth of clones PB 235 and GT 1. These gain estimates represent gains to be achieved from further clonal selection, and do not include gains to be achieved from past selection.
Stability
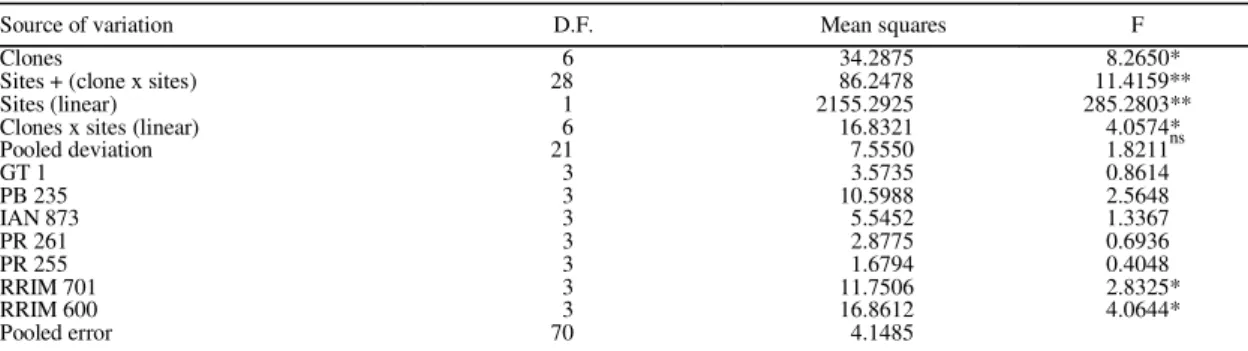
The combined analysis of variance conducted for six-year girth growth at five sites of the study are presented in Table 5, and revealed that the clones differ significantly. The clone x site interaction components were further partitioned into linear (sites and clone x sites) and non-linear (pooled deviations) components. Mean square for both these components were tested against pooled error mean square. Only the linear component was significant, indicating that the predictable components shared clone x site interactions. Preponderance of linear clone x site interaction is of great practical importance, implying that there are differences among the linear regression coefficient for each clone.
The stability parameters for all clones are given in Table 6. Eberhart & Russell (1966) emphasized the need of considering both linear (bi) and non-linear (S2di) components of genotype-environment
TABLE 3. Results of analysis of variance and magnitude of variance components for six-year girth growth for seven Hevea clones at five sites.
Source of D. F. M.S. F Variance components
variation Magnitude %
Repetition/sites 10 8.0607 1.6655* 0.4601
-Sites (s) 4 558.8097 69.325** 26.2261 88.91
Clone (c) 6 34.2783 3.1678* 1.5638 5.30
c x s 24 10.8207 2.2357** 1.7088 5.79
Error mean 60 4.8399 - 4.8399
Mean (cm) 36.3684
Coef. of variation (%) 6.3342
TABLE
4.
Means and rank of six-year girth growth for seven
Hevea
clones at five sites (in centimeters)
1.
1Test sites with de same letter in a given mean are not significantly dif
ferent from each other at the 5% probability level by T
ukey teste.
interactions in judging the stability of a genotype. A wide adaptability genotype was defined as one with
bi = 1.0 and high stability as one with Sd2i= 0. Values
for the regression coefficient (bi) range from 0.6868
(IAN 873) to 1.4121 (PB 235). The plot clonal means against site means with the corresponding regression lines for seven clones illustrates the differential reactions of clones to changing environments (Fig. 1). As defined by Eberhart & Russell (1966), clone GT 1, PR 255 and RRIM 701 represent clones of wide adaptability (bi= 1.0). Its performance is relatively equal on poor and good sites. Clone PB 235 represents a clone of specific adaptability (bi=1.4). It performs relatively better on favorable sites while clone IAN 873 represents one of specific adaptability to unfavorable sites (bi= 0.69).
The point is that regression coefficient measures “relative” performance of the clone (Clair & Kleinschmit, 1986). In rubber trees breeding, this information is useful to distinguish clones for specific environments, but if all environments tested are in one planting zone, and each one represents the same proportion of area to be planted, then this information is not important. Selection on the overall mean is all that is necessary to assure the largest overall gains. Therefore clone GT 1 could be considered superior in future breeding programmes in order to incorporate stability. According to Singh & Gupta (1988), it is possible that stable genotypes carry genes for stability, useful in breeding programmes because it facilitates economic production.
More important to rubber tree breeding is the predictability of clone vigor in various environments. This concept of stability may be measured by the mean deviations from regression line, 2
di
S (Breeze, 1969; Becker, 1981). Clone RRIM 600 performs well overall, but is very unstable as measured by
2 di
S = 2.15 (Table 6). On the other hand, clone PB 235 also performs well but is very stable as measured by
2 di
S = 0.08. This is apparent from the deviations of the individual points from the regression line in Fig.1. A plot of the stability parameter against the clonal means is useful as an aid to selection (Figs. 2 and 3).
C lo ne Indi ana V ot upor anga Mat ão R ibe ir ão Pr et o Moco ca Ov er al l Mean R ank Mean R ank Mean R ank Mean R ank Mean R ank Mean R ank G T 1 36. 37a 1 39. 92a b 4 44. 55a b 2 32. 15a 1 32. 68a b 5 37.
13 +
5. 20 2 PB 2 35 36. 32a 2 46. 74 a 1 47. 41 a 1 31. 73a 2 34. 52a 2 39.
34 +
7. 25 1 IA N 873 36. 07a 3 36. 14 b 7 40. 72 bc 6 30. 16a 6 33. 90a 3 35.
40 + 3.
74 6 PR 2 61 34. 59a 4 40. 48a b 3 41. 12 bc 5 29. 24a 7 31. 84ab 6 35.
72 + 4.
86 4 PR 2 55 34. 25a 5 38. 90a b 6 42. 86 bc 3 30. 57a 5 32. 98ab 4 35.
66 + 5.
31 5 R R IM 70 1 33. 92a 6 39. 02a b 5 42. 52 bc 4 31. 15a 4 27. 53 b 7 34. 82 + 6. 01 7 R R IM 60 0 33. 54a 7 41. 34a b 2 40. 65c 7 31. 42a 3 35. 58a 1 36. 51 + 4 .3 6 3 Ov er al l cl one m eans 35.
00 + 1.
21 40. 36 + 3. 26 42.
83 +
2. 45 30. 92 + 1. 00 32.
72 + 2.
60
36.
Source of variation D.F. Mean squares F
Clones 6 34.2875 8.2650*
Sites + (clone x sites) 28 86.2478 11.4159**
Sites (linear) 1 2155.2925 285.2803**
Clones x sites (linear) 6 16.8321 4.0574*
Pooled deviation 21 7.5550 1.8211ns
GT 1 3 3.5735 0.8614
PB 235 3 10.5988 2.5648
IAN 873 3 5.5452 1.3367
PR 261 3 2.8775 0.6936
PR 255 3 1.6794 0.4048
RRIM 701 3 11.7506 2.8325*
RRIM 600 3 16.8612 4.0644*
Pooled error 70 4.1485
ns, * and ** No-significant and significant for p< 0.05 and p< 0.01, respectively.
FIG. 2. Plot of deviation from regression (Sdi), against girth clonal means in a stability study of seven
Hevea clones.
RRIM 600
GT 1 IAN 873
PB 235
PR 255 PR 261 RRIM 701
-2 -1 0 1 2 3 4 5
34 35 36 37 38 39 40
Girth clonal mean (cm)
Deviation from regression (S
2 di
) Overall
clonal mean
TABLE 5. Analysis of variance for stability parameter of six-year girth growth over four sites.
TABLE 6. Estimates of six-year girth growth in cm/plant means (xi ) and stability parameters (regression coefficient (bi) standart error of regression coefficient (SEb) and deviation from regression (Sd2i)) in four sites.
Genotype Girth
xi bi SEb S
d2i
GT 1 37.1346 1.0091 0.1079 -0.5755
IAN 873 35.3998 0.6868* 0.1843 1.7662
PB 235 39.3434 1.4121** 0.1336 0.0814
PR 255 35.6472 1.0344 0.0972 -0.8075
PR 261 35.7176 0.9520 0.0730 -1.2069
RRIM 600 36.5078 0.7916 0.1933 2.1502*
RRIM 701 34.8280 1.1144 0.2317 3.8537*
Average 36.3683 1.000
* and ** Significant for p< 0.05 and p< 0.01, respectively.
FIG. 1. Plot of girth clonal means for seven clones against site means with corresponding regression lines in Hevea brasiliensis.
Clones falling in the lower right-hand side are preferred. Clone GT 1 is the best clone no matter which stability parameter is used. Selection of
28 33 38 43 48
30 32 34 36 38 40 42 44
Site mean (cm)
Girth clonal mean (cm)
.
GT 1 IAN 873 PB 235 PR 255 PR 261 RRIM 600 RRIM 701
Ribe irão Preto
FIG. 3. Plot of regression coefficient (bi) values against girth clonal means in a stability study of seven Hevea clones.
clones based on girth growth and stability can then proceed using a selection index for multiple trait selection (Stonecypher & Arbes, 1976), but assigning weights based on relative economic value may prove difficult. This would require knowledge of the reduction in gain associated with using unstable versus stable genotypes. The use of independent culling levels, that is, setting an acceptable value for a stability parameter followed by selection based on girth, may prove more pratical.
Correlated gains among sites
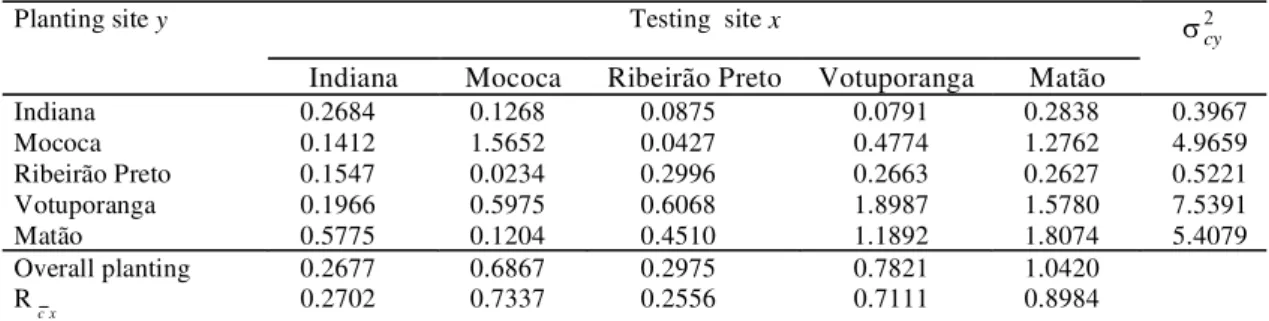
The expected gains from various combinations of testing and planting sites, along with estimates of clonal variance and repeatability of clonal means are presented in Table 7. Expected gains at planting sites are generally greater or close to the greatest when selection is done at the same site. Where this is not true (Indiana and Ribeirão Preto), the clonal variance is small when compared to those of Mococa, Matão, and Votuporanga. Selection based on overall means results in gains second only to those when selection is done at the same site as planting.
Matão was the best single site for large testing because of the high correlations with most of the other sites (Table 8). Votuporanga shows fair correlation with Ribeirão Preto (r= 0.53). The estimated gains for selection at Matão and planting at Indiana, Mococa and Ribeirão Preto were, in all cases greater than for selection at either Mococa or Votuporanga.
The least similar sites are Ribeirão Preto and Mococa as indicated by a low correlation of clonal
Sites M ococa Ribeirão Preto Votuporanga M atão
Indiana 0.2862 0.3351 0.1817 0.5799
M ococa 0.0462 0.3098 0.7369
Ribeirão Preto 0.5331 0.4678
Votuporanga 0.7395
TABLE 8. Genetic correlation coefficient between clonal means for six-year girth growth among sites. TABLE 7. Expected genetic gains from clones planted at site y after testing at site x (in centimeter); intensity
of selection assumed to be 0.82. Estimated clonal components of variance (scy2 ) and repeatabilities
(Rcx ) of clonal means are given for each site.
Planting site y Testing site x s2
cy
Indiana Mococa Ribeirão Preto Votuporanga Matão
Indiana 0.2684 0.1268 0.0875 0.0791 0.2838 0.3967
Mococa 0.1412 1.5652 0.0427 0.4774 1.2762 4.9659
Ribeirão Preto 0.1547 0.0234 0.2996 0.2663 0.2627 0.5221
Votuporanga 0.1966 0.5975 0.6068 1.8987 1.5780 7.5391
Matão 0.5775 0.1204 0.4510 1.1892 1.8074 5.4079
Overall planting 0.2677 0.6867 0.2975 0.7821 1.0420
R
c x 0.2702 0.7337 0.2556 0.7111 0.8984
RRIM 701 PR255
IAN 873 PR 261
RRIM 600 GT 1
PB 235
0,40 0,60 0,80 1,00 1,20 1,40 1,60
34 35 36 37 38 39 40
Regression coefficients (b
i
)
Girth clonal mean (cm) Overall clonal mean
means and low gains from selection and planting between sites.
CONCLUSIONS
1. The clone GT 1 recommended to the plateau region of São Paulo State shows the second highest girth average and a value of bi = 1.0, representing a
clone of wide adaptability, performing well on poor and good sites.
2. The clones PR 255 and PR 261 show high stability and wide adaptability, but the means of girth are low.
3. The clones PB 235 and IAN 873 are the most stable to girth growth and superior to the average, for favorable and unfavorable sites, respectively.
4. Expected gains from planting sites, along with estimates of clonal variance and repeatability of clonal means are generally greatest or close to the greatest when selection is done at the same site.
ACKNOWLEDGEMENTS
To Cambuhy Empreendimentos Agropecuários Ltda and Indiana Rubber Plantation for providing land support for the experiments in Matão and Indi-ana, respectively; to Mrs. Lígia Regina L. Gouvêa for compiling the data; to Dr. Maria Regina G. Ungaro for providing constructive criticism on the manuscript.
REFERENCES
BECKER, H. Correlations among some statistical measures of phenotypic stability. Euphytica, Wageningen, v.30, p.835 -840, 1981.
BECKER, W.A. Manual of quantitative genetics. Pullman: Academic Enterprises, 1984. 290p.
BREEZE, E.L. The measurement and significance of genotype-environment interactions in grasses. Heredity, London, v.24, p.27-44, 1969.
BURDON, R.D. Genetic correlation as a concept for studying genotype-environment interaction in forest tree breeding. Silvae Genetica, Frankfurt, v.26, n.5/6, p.168-175, 1977.
CLAIR, J.B.; KLEINSCHMIT, J. Genotype-environment interaction and stability in ten-year height growth of Norway Spruce clones (Picea abies Karts). Silvae Genetica, Frankfurt, v.35, n.2, p.177-186, 1986.
EBERHART, A.A.; RUSSELL, W.A. Stability parameters for comparing varieties. Crop Science, Madison, v.6, p.36-40, 1966.
FALCONER, D.S. Introduction to quantitative genetics. London: Longman, 1981. 370p.
FINLAY, K.W.; WILKINSON, G.N. The analysis of adaptation in a breeding programme. Australian Journal of Agricultural Research, Melbourne, v.14, p.742-754, 1963.
FREEMAN, J.H. Statistical methods for the analysis of genotype-environment interactions. Heredity, London, v.31, p.339-354, 1973.
GONÇALVES, P. de S.; CARDOSO, M.; SANTOS, I.C.I. dos; MARTINS, A.L.M.; ORTOLANI, A.A.; COLOMBO, C.A. Selection of Hevea mother tree adapted to unpredictable annual climatic variability. Revista Brasileira de Genética, Ribeirão Preto, v.15, n.1, p.137-147, 1992.
JAYASEKERA, N.E.M.; SAMARANAYAKE, P.; KARUNASEKERA, K.B. Initial studies on the nature of genotype-environment interactions in some Hevea cultivars. Journal of Rubber Research Institute of Sri Lanka, Agalawata, v.54, p.33-42, 1977.
KALIL FILHO, A.N. Potencial de produtividade e estabilidade fenotípica na caracterização de clones de seringueira (Hevea spp.). Piracicaba: USP-ESALQ, 1982. 95p. Dissertação de Mestrado.
PERKINS, J.M.; JINKS, J.L. Environmental and genotype x environmental components of variability III: Multiple lines and cross. Heredity, London, v.23, p.339-356, 1968.
PUSHPARAJAH, E. Problems and potentials for establishing Hevea under difficult environmental conditions. Planter, Kuala Lumpur, v.50, p.242-251, 1980.
STONECYPHER, R.; ARBES, M. Methods of selection. In: IUFRO JOINT MEETING ON ADVANCED GENERATION BREEDING, 1976, Bordeaux. Proceedings... Bordeaux: INRA, 1976. p.92-99.
STRINGFIELD, G.H.; SATTER, R.M. Differential response of corn varieties to fertility levels and to seasons. Journal of Agricultural Research, Punjab, v.49, p.991-1000, 1934.
SUHENDI, D.A. A yield stability analysis of rubber clones. Menara Perkebunan, Bogor, v.57, n.1, p.10-13, 1989.
TAN, H. Genotype x environment interaction studies in rubber (Hevea) clones. Journal of Natural Rubber Research, Kuala Lumpur, v.10, n.1, p.63-76, 1995.
VENCOVSKY, R.; BARRIGA, P. Genética biométrica no fitomelhoramento. Ribeirão Preto: Sociedade Brasileira de Genética, 1992. 496p.