Abstract—The full car model is used extensively in the system identification of a vehicle suspension system to capture the realistic dynamics of a suspension system. Influence of parameter variations on the full car model was analyzed on frequency domain. The magnitude and phase of the transfer
function between the output (sprung mass vertical
acceleration, pitch rate, raw rate and front tire vertical acceleration) and the front road input changed as parameters changed. System identification of the full car model using Matlab was done.
Index Terms—System Identification, Full Car Model, Time
Domain, Frequency Domain
I. INTRODUCTION
key aspect of vehicle research field is improving car ride quality and handling performance. Performance improvement can be achieved through analysis and modification of vehicle dynamics via the design suspension system controller [1,2,3]. High fidelity mathematical models that accurately capture the dynamics of the car suspension system are critical in this design task. An excellent means to determine such models is the use of system identification techniques.[3]
System identification methods, that address the problem of building mathematical models of dynamic systems based on observed data from the system, are often employed in automotive applications to determine unknown vehicle parameters that cannot be measured directly. A number of system identification methods are available in literature for automatic determination of system parameters. Several of these methods have been applied to vehicle parameter estimation, including: least squares, extended kalman filter, maximum likelihood and recursive prediction error.
The system identification procedure has a natural logical flow: first, collect data, then choose a model set and pick the optimal model in the set, as shown in Figure 1. All of the system methods rely on a model of the vehicle in order to estimate a specific set of vehicle parameters. Often the vehicle parameters can be estimated using vehicle models
Manuscript received December 08, 2010;
Fengchun. Sun. is with National Engineering Lab of Electric Vehicle, Beijing Institute of Technology, Beijing 100081 China. (e-mail: [email protected] )
Yan. Cui. is with the National Engineering Lab of Electric Vehicle, Beijing Institute of Technology, Beijing 100081 China. (e-mail: [email protected], phone: 86-138-1188-1907)
from different directions of the vehicle dynamics, including: vertical dynamics, longitudinal dynamics and lateral dynamics.
Figure 1: System Identification Flow Chart
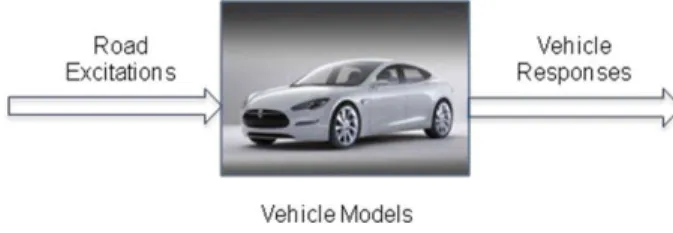
In this paper, system identification of parameters from the vertical direction is investigated. The road excitations are used as inputs and the vehicle responses are used as outputs, as show in Figure 2.
Figure 2: System Identification of Vehicle Parameters from Vertical Dynamics
Car models can be either mathematical models, neural network models or multi-body physical models. Several models have been developed with research related to the system identification of vehicle parameters from vertical dynamics. These include: quarter-car, half car and full car models.
To understand which parameters are easily and cost effectively identified, the influence of parameter variations on system identification process should be considered. In [4, 5], the quarter car model and half car model were analyzed with the help of the parameter variations. It shows that the variation of the spring damper characteristic has a more significant influence on the quarter-car model and half car model at resonant frequencies than the sprung mass and spring stiffness. The seven degrees-of-freedom full car model can capture more dynamic characteristics of vehicle. So it is
Influence of Parameter Variations on System
Identification of Full Car Model
Fengchun Sun, Yan Cui
used more extensively in the system identification of vehicle suspension system [5].
An eigenvalue analysis can be used in many engineering systems where part of the characteristics of the system can be determined [6]. The analysis of full car model eigenvalues is present in this paper.
The vehicle is a dynamic system that exhibits vibration in response to excitation inputs. The frequency response transfer function between vibration (e.g., car body acceleration, and excitation inputs) and excitation inputs is analyzed.
The system identification of the full car model using random road input is shown at the end the paper.
II. FULL CAR MODEL
The full car model has 7 degrees of freedom, which are the vertical displacement of the vehicle body, pitch angle, roll angle, vertical displacement of all four wheels. A schematic of this model is shown in Figure 1. The suspension between each axle and the body is modeled using a linear viscous damper and spring element. The tire is modeled using a simple linear spring without damping.
Figure 3. Full Car Model
A. State Space for the Full Car Model
The full car model can be presented using the state space model. The state space for full car model is shown in equation (1) and (2).
full full full full full
x
= A
x
+ B
u
(1)full full full full full
y
= C
x
+ D
u
(2)The state vector is shown in equation (3)
Tfull z z ztfl ztfl ztfr ztfr ztrl ztrl ztrr ztrr
x (3)
The input and output are shown in equation (4) and equation (5).
Tfull zrfl zrfr zrrl zrrr
u (4)
Tfull z z ztfl ztfr ztrl ztrr
y (5)
The representative values for the parameters of the system used in the simulation are shown in TABLE I. The eigenvalues of the full car model are analyzed and the influence of parameter variations, such as changes in sprung mass, spring damping and tire stiffness, are investigated through the full car model transfer function on frequency domain.
III. ANALYSIS OF SYSTEM EIGENVALUES
The stability of a large system is determined from the eigenvalues of the system. The system eigenvalues are functions of all control and design parameters. [6] A change in any of these parameters affects the system performance and is reflected in a shift in the system eigenstructure (eigenvalues and eigenvectors). In this paper only the eigenvalues are considered.
TABLE II shows the eigenvalues and corresponding natural frequencies, damping ratios of the full car model with representative values, which is shown in TABLE I. Modes 1 through 3 are the car body modes. Modes 4 through 7 are the wheel hop modes.
IV. INFLUENCE OF PARAMETER VARIATIONS ON TRANSFER
FUNCTIONS
The transfer function is commonly used in the analysis of a single-input single-output system in the frequency domain. In this case, front left road profile
zrfl was used as the single system transfer function input. For the dynamic analysis of this model, the transfer function between state variables
x s and the front left road profile zrf
s can be defined asequation (6).
TABLEI
PRESENTATIVE VALUES FOR PARAMETERS OF FULL CAR MODEL
Parameters Description Value Unit
ms sprung mass 1200 kg
Iθ pitch inertial of sprung mass 2100 m4
Iφ roll inertial of sprung mass 1800 m4
cfl cfr crl crr spring damping 6000 Ns/m
kfl kfr krl krr spring stiffness 50000 N/m
mtfl mtfr mtrl mtrr tire mass 125 kg
ktfl ktfr ktrl ktrr tire stiffness 400000 N/m
TABLEII
EIGENVALUES,NATURAL FREQUENCY AND DAMPING RATIO FOR FULL
CAR MODEL
Mode Eigenvalue Nature
Frequency
Damping Ratio
1 -3.6823 ± 7.5300i 1.3341 0.4393
2 -10.0875 ± 9.8077i 2.2392 0.7170
3 -19.0356 ± 3.8728i 3.0917 0.9799
4 -19.1302 ± 40.4495i 7.1214 0.4275
5 -23.6039 ± 45.3213i 8.1327 0.4619
6 -24.5844 ± 51.3259i 9.0575 0.4320
1 11
full full full full full rfl s s z s Y
C I A B D (6)
In which
1
full
B is the input matrix related to the front left road input.
The resulting transfer function between the sprung mass vertical acceleration and the front left road input is:
0 1 0 0 0 0 0 0 0 0
rfl rfl
z s s
z s z s
Y
(7)
The transfer function between the sprung mass pitch rate and the front left road input is:
0 0 0 1 0 0 0 0 0 0
rfl rfl
s s
z s z s
Y (8)
The transfer function between the sprung mass roll rate and the front left road input is:
0 0 0 0 0 1 0 0 0 0
rfl rfl
s s
z s z s
Y (9)
The transfer function between the front left tire vertical acceleration and the front left road input is:
0 0 0 0 0 0 1 0 0 0
tfl
rfl rfl
z s s
z s z s
Y (10)
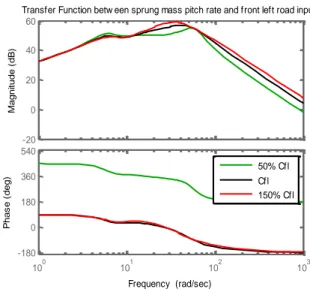
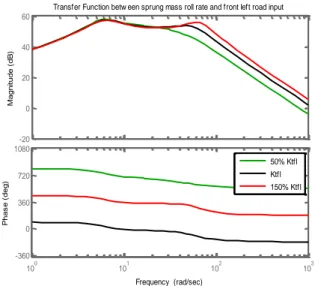
Simulation shows how parameter variations influence the magnitude and phase of the transfer function between four outputs and front left road input. In this case the parameters are varied from 50% to 150% of values showed in TALBE I. As shown in Figure 4 , Figure 5 and Figure 6, the change in the front left spring damping has a significant influence on magnitude and phase of the transfer functions between 3 outputs (sprung mass vertical acceleration, sprung mass pitch rate, sprung mass roll rate) and the front left road input. Figure 7 shows that the front left spring damping variation does not have a significant influence on magnitude of the transfer function between the front left tire vertical acceleration and the front left road input. This indicates that the change in the front left spring damping has a dramatic influence on each mode of full model. As shown in Figure 8 through Figure 11, the front left tire stiffness has a large influence on magnitude above 10 Hz on each mode of the full car model. The sprung mass pitch inertia has a significant influence on pitch rate, but almost no influence on the sprung mass vertical acceleration and the front tire vertical acceleration. Sprung mass roll inertia has a significant influence on roll rate, but almost no influence on other vehicle responses. Changes in the front left spring stiffness slightly influence the sprung mass vertical acceleration and the pitch rate near 0.7-10 Hz.
0 20 40 60 80 100 M a g n it u d e ( d B )
100 101 102 103 -90 0 90 180 270 360 P h a s e ( d e g )
Transfer Function betw een sprung mass vertical acceleration and front left road input
Frequency (rad/sec)
50% Cfl Cfl 150% Cfl
Figure 4. Influence of front left spring damping variation on transfer function between sprung mass vertical acceleration and front left road input
-20 0 20 40 60 M a g n it u d e ( d B )
100 101 102 103 -180 0 180 360 540 P h a s e ( d e g )
Transfer Function betw een sprung mass pitch rate and front left road input
Frequency (rad/sec)
50% Cfl Cfl 150% Cfl
Figure 5. Influence of front left spring damping variation on transfer function between sprung mass pitch rate and front left road input
-20 0 20 40 60 M a g n it u d e ( d B )
100 101 102 103 -180 0 180 360 540 P h a s e ( d e g )
Transfer Function betw een sprung mass roll rate and front left road input
Frequency (rad/sec)
50% Cfl Cfl 150% Cfl
40 60 80 100 120 M a g n it u d e ( d B )
100 101 102 103 0 45 90 135 180 P h a s e ( d e g )
Transfer Function betw een front left tire vertical acceleration and front left road input
Frequency (rad/sec)
50% Cfl Cfl 150% Cfl
Figure 7. Influence of front left spring damping variation on transfer function between front tire vertical acceleration and front left road input
0 20 40 60 80 100 M a g n it u d e ( d B )
100 101 102 103 -90 0 90 180 270 360 P h a s e ( d e g )
Transfer Function betw een sprung mass vertical acceleration and front left road input
Frequency (rad/sec)
50% Ktfl Ktfl 150% Ktfl
Figure 8. Influence of front tire stiffness on transfer function between sprung mass Vertical Acceleration and Front left road input
-20 0 20 40 60 M a g n it u d e ( d B )
100 101 102 103 -180 0 180 360 540 P h a s e ( d e g )
Transfer Function betw een sprung mass pitch rate and front left road input
Frequency (rad/sec)
50% Ktfl Ktfl 150% Ktfl
Figure 9. Influence of front tire stiffness on transfer function between sprung mass Pitch Rate and Front Left Road Input
40 60 80 100 120 M a g n it u d e ( d B )
100 101 102 103 0 45 90 135 180 P h a s e ( d e g )
Transfer Function betw een front left tire vertical acceleration and front left road input
Frequency (rad/sec)
50% Ktfl Ktfl 150% Ktfl
Figure 10. Influence of front tire stiffness on transfer function between Front Tire Vertical Acceleration and Front left Road Input
-20 0 20 40 60 M a g n it u d e ( d B )
100 101 102 103 -360 0 360 720 1080 P h a s e ( d e g )
Transfer Function betw een sprung mass roll rate and front left road input
Frequency (rad/sec)
50% Ktfl Ktfl 150% Ktfl
Figure 11. Influence of front tire stiffness on transfer function between sprung mass Roll Rate and Front Left Road Input
V. SYSTEM IDENTIFICATION OF FULL CAR MODEL
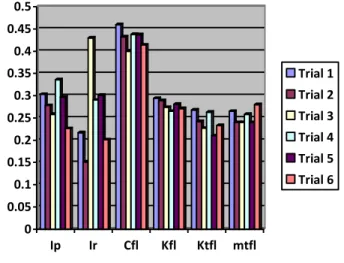
Six trials were made for system identification for the full car model with random road input. In Fig. 7, the percent errors of parameters in system identification were shown. The front spring damping has relatively large error. Front spring stiffness, front tire stiffness and mass have relatively small errors.
0 0.05 0.1 0.15 0.2 0.25 0.3 0.35 0.4 0.45 0.5
Ip Ir Cfl Kfl Ktfl mtfl
Trial 1
Trial 2
Trial 3
Trial 4
Trial 5
Trial 6
Figure 12. Percent error of parameters estimation for the full car model (random road input)
VI. CONCLUSIONS
For the root locus analysis and the transfer function analysis, the variation of spring damping and tire stiffness have a big influence on the magnitude of transfer functions between 3 outputs (sprung mass vertical acceleration, sprung mass pitch rate, front tire vertical acceleration) and front road input more than other parameters. This means that sprung damping and tire stiffness have a notable influence on these outputs. During system identification spring damping, tire stiffness and tire mass have relatively small errors than other parameters. Conversely, spring stiffness and sprung mass inertia have a large percent error. This verifies that the spring damping and the tire stiffness is more sensitive than other parameters in full car model. The reason of that is the nonlinear characteristics of the shock absorber and tire. The nonlinear shock absorber model and the nonlinear tire model will be investigated in the future work.
REFERENCES
[1] Smith M. “Achievable Dynamics Response for Automotive Active
Suspension.” Vehicle System Dynamics,1995, 1:1-34
[2] Peng H, Stranthearn R nand Ulsoy A G. “A Novel Active Suspension Design Technique Simulation and Experimental Results.” Proc. of American Control Conference, 1997.
[3] Gao W, Zhang N, Dai J. “A stochastic quarter-car model for dynamics of vechicles with uncertain parameters.” Vehicle System Dynamics, 2008, 46(12):1159-1169.
[4] Majjad R. “Estimation of Suspension Parameters.” Proceedings of 1997 IEEE International Conference on Control Applications, 1997. 522-527, [5] Akcay H, Turkay S. “Influence of tire damping on mixed H2/H∞ synthesis of half-car active suspensions.” Jounal of Sound and Vibration, 2009, 332:15-28.
[6] Alden R T H, Qureshy F A. “Eigen Traking Due to Parameter Variation.” IEEE Transactions on automatic control, 1985, 30: 923-925. [7] Wong J Y. Theory of Ground Vehicles. Wiley, 4th edition.
[8] Gillespie T D. Fundamentals of Vehicle Dynamics. Society of Automotive Engineers, Inc., 1992.
[9] Genta G. Motor Vehicle Dynamics, Modeling & Simulation. World Scientific Publishing Co., 1997.