GEOMETRIC AND REFLECTANCE SIGNATURE CHARACTERIZATION OF
COMPLEX CANOPIES USING HYPERSPECTRAL STEREOSCOPIC IMAGES FROM
UAV AND TERRESTRIAL PLATFORMS
E. Honkavaara a,*, T. Hakala a, O. Nevalainen a, N. Viljanen a, T. Rosnell a, E. Khoramshahi a, R. Näsi a, R. Oliveira b , A. Tommaselli b
a
Dep.of Remote Sensing and Photogrammetry, Finnish Geospatial Research Institute, Masala, Kirkkonummi, Finland - (eija.honkavaara, teemu.hakala, olli.nevalainen, niko.viljanen, tomi.rosnell, ehsan.khoramshahi, roope.nasi)@nls.fi b UNESP, University of São Paulo State, Presidente Prudente - SP, Brazil - [email protected], [email protected]
Commission VII, WG 3
KEY WORDS: Hyperspectral, Radiometry, Photogrammetry, Geometry, Matching, Uncertainty
ABSTRACT:
Light-weight hyperspectral frame cameras represent novel developments in remote sensing technology. With frame camera technology, when capturing images with stereoscopic overlaps, it is possible to derive 3D hyperspectral reflectance information and 3D geometric data of targets of interest, which enables detailed geometric and radiometric characterization of the object. These technologies are expected to provide efficient tools in various environmental remote sensing applications, such as canopy classification, canopy stress analysis, precision agriculture, and urban material classification. Furthermore, these data sets enable advanced quantitative, physical based retrieval of biophysical and biochemical parameters by model inversion technologies. Objective of this investigation was to study the aspects of capturing hyperspectral reflectance data from unmanned airborne vehicle (UAV) and terrestrial platform with novel hyperspectral frame cameras in complex, forested environment.
1. INTRODUCTION
Recent progress in miniturized hyperspectral imaging technology has provided the markets with hyperspectral cameras operating with frame imaging principle (Mäkynen et al., 2011; Saari et al., 2011; Honkavaara et al., 2013; Aasen et al., 2015). With frame camera technology it is possible to derive 3D hyperspectral reflectance point clouds and 3D geometric data of targets of interest, when capturing images with stereoscopic overlaps. This will allow detailed geometric and radiometric characterization of the object.
Novel hyperspectral imaging technology based on a variable air gap Fabry-Perot interferometer (FPI) was used in this investigation. The FPI technology makes it possible to manufacture lightweight, frame format hyperspectral imager operating in the time-sequential principle. The first prototypes of the FPI-based cameras were operating in the visible to near-infrared spectral range (500-900 nm; VNIR) (Saari et al., 2011; Mäkynen et al., 2011; Honkavaara et al., 2013). The FPI technology is also commercially available in the VNIR range (http://www.rikola.fi). Similar to conventional cameras, these sensors can be operated from terrestrial and airborne platforms using photogrammetric principles, capturing image blocks with stereoscopic overlaps. Efficient and accurate data post-processing is required to transform these hundreds and thousands of images into products that allow the objects’ geometric and spectral characteristics to be interpreted on a quantitative geometric and radiometric basis. The modern computer vision and photogrammetric techniques based on structure-from-motion image orientation techniques (Wu et al., 2013) and dense digital matching generating accurate 3D point clouds and digital surface models (DSM) (Leberl et al., 2010) offer efficient tools to process the data sets.
This paper presents new instrumentation and processing chain for 3D geometric and multiangular reflectance characterization of complex forest canopies; the research augments the recent developments by Hakala et al. (2013), Honkavaara et al. (2013; 2014; 2016), Tommaselli et al. (2014) and Liang et al. (2015). The instrumentation can be operated from UAV and terrestrial platforms. Our objective is to study the aspects of extracting hyperspectral reflectance data with the novel instrumentation in forested environment, as well as the uncertainty modeling.
2. MATERIALS AND METHODS
2.1 Multiangular 3D reflectance data capture using FPI
camera technology
The hyperspectral frame camera technology based on the use of multiple orders of a variable air gap FPI is used in this study (Saari et al., 2011; Mäkynen et al., 2011). When the FPI is placed in front of the sensor, the wavelength of the light passing the FPI is a function of the interferometer air gap. By changing the air gap, it is possible to acquire a new set of wavelengths. During data collection, a predefined sequence of air gap values is applied to capture the full spectral range. The hyperspectral data cube is thus formed in the time-sequential imaging principle. When using this technology on a moving platform, each band in the data cube exposed to a different air gap value has a slightly different position and orientation, which has to be taken into account in the post-processing phase (Honkavaara et al., 2013).
The FPI camera prototype 2012b was used to capture hyperspectral images in the range of 500-900 nm (Honkavaara et al., 2013). It is equipped with custom optics having a focal length of 10.9 mm and an f-number of 2.8. The camera has a CMOSIS CMV4000 RGB image sensor. The time difference between adjacent exposures is 0.075 s, and between the first and The International Archives of the Photogrammetry, Remote Sensing and Spatial Information Sciences, Volume XLI-B7, 2016
last exposures in a data cube with 24 bands is 1.8 s. The image size is 1024 x 648 pixels with a pixel size of 11 μm. The field of view (FOV) is ±18° in the flight direction, ±27° in the cross-flight direction, and ±31° at the format corner. The entire camera system weighs less than 700 g.
The full system consisted of the following components. An on-board GPS (RasPiGNSS, NV08C-CSM) was used for collecting camera position trajectory for georeferencing purposes. Ocean optics irradiance spectrometer USB 2000+ (OOU2000) with cosine collector optics was used for the measurement of incident irradiance; the cosine collector was stabilized to prevent tilting of the sensor affecting the results of the irradiance measurement. Additionally Raspberry Pi2 on-board computer was used for collecting timing data for all devices, logging the GPS and for saving the OOU2000 spectra. Furthermore, the FPI camera was equipped with an irradiance sensor based on the Intersil ISL29004 photodetector. The sensor was not calibrated to measure in W/m2 and only relative, broadband irradiance intensity values were obtained (Hakala et al., 2013). In UAV operation a RGB camera (Samsung NX 300) was used to support the geometric processing.
In the airborne operation, the UAV was a hexacopter with Tarot 960 foldable frame and it was equipped with a tilting gimbal, allowing capture of vertical and oblique images around the object of interest (Figure 1). Autopilot was Pixhawk equipped with Arducopter 3.15 firmware. Payload of the system is 3-4 kg and flight time 15-30 min (depending on payload, battery and conditions). In the terrestrial operation, the FPI camera and the irradiance sensor were mounted on a pole with adjustable height and tilting, allowing images to be captured from multiple views and altitudes of tree canopies and the forest floor (Figure 2). Using the developed system, hyperspectral point clouds can thus be captured from vertical, horizontal and any other oblique perspective between these.
Figure 1. The instrumentation used in the UAV measurements
Figure 2. The FPI camera setup in terrestrial measurement.
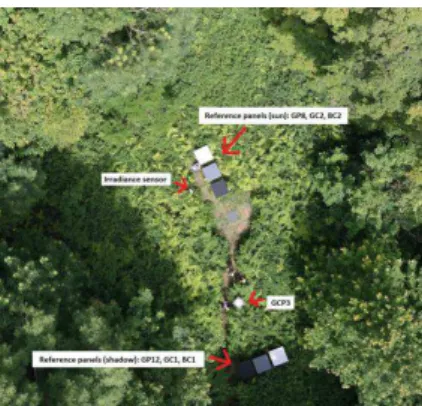
The ground station (Figure 3) was composed of reflectance reference panels and ASD Field Spec Pro spectrometer to record irradiance at the clearing next to the measurement location. Ground control points (GCPs) were installed in the area to support the geometric processing.
Figure 3. Terrestrial reference data during the UAV flights.
2.2 Test area
A measurement campaign was carried out in the Wytham Woods (51.7758495°, -001.3367698°), Oxford, UK in June-July 2015. Wytham Woods are an ancient semi-natural mixed-woodland owned by the University of Oxford (http://www.wytham.ox.ac.uk/). The main tree species are oak (Quercus robur), ash (Fraxinus excelsior), beech (Fagus sylvatica), hazel (Coryllus avellana), sycamore (Acer
pseudoplatanus), which grow in Wytham’s semi-natural woodland habitat (ancient and recent), as well as plantation.
2.3 Datasets
The UAV data capture was carried out in 30 June 2015 (Table 1, 2). The weather conditions were cloud free and windless. Flights included block flights with vertical and oblique view geometry (Figure 4). The vertical image block composed of 10 flight lines in North-South direction and the oblique block consisted of four bi-directional flight lines at 45º angles. In the oblique block the camera was tilted approximately 40º thus the setup provided view angles of 0-60º to the object. The photogrammetric block setup was designed at a flight height of 100 m above ground level. The resulting ground sample distance (GSD) was 10 cm for the FPI camera, and 3 cm for the RGB camera. The size of the image footprint was 65 m by 102 m, the forward overlap was 85%, and the side overlap was 70% on average (in vertical imaging). The spectral settings are given in Table 3.
Figure 4. The block structure. Vertical image block composes of 10 flight lines in North-South direction. The oblique block consists of 4 bi-directional flight lines. The International Archives of the Photogrammetry, Remote Sensing and Spatial Information Sciences, Volume XLI-B7, 2016
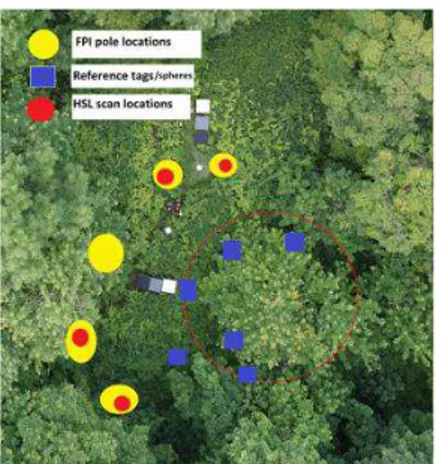
In the terrestrial data capture one tree was imaged from 500 directions (6 pole locations; Figure 5). At each location, images were acquired from different heights and angles. The camera to target distance was approximately 15.6 m, which provided an average GSD of 1.5 cm for the hyperspectral images.
Figure 5. Approximate positions of the terrestrial stereoscopic imaging by FPI camera.
Table 1. Paramters of image blocks. Dist: Nominal camera to object distance. V: vertical, O: oblique; T: terrestrial.
Id Type N
cubes
Flight speed (m/s)
GSD (m) Dist (m)
f1 V 304 4 0.10 100
f2 O 320 3 0.10 100
f5 O 315 3 0.10 100
f6 V 289 4 0.10 100
t1 T 165 0 0.015 15.6
t3 T 65 0 0.015 15.6
t4 T 73 0 0.015 15.6
Table 2. Solar angles, imaging time and exposure information.
Azimuth (º)
Zenith (º)
Time Exp.T.
(ms)
f1 125.18 38.44 9:44 – 10:04 5
f2 137.97 34.05 10:22 – 10:43 5
f5 210.47 31.35 13:05 – 10:38 4
f6 236.77 39.28 14:19 – 14:25 4
t1 cloudy, variable 10:36 - 11:15 20 t3 cloudy, variable 12:57 - 13:15 15 t4 cloudy, variable 13:51 - 14:16 8
Table 3. Spectral settings (peak wavelength and FWHM)
UAV data capture:
L0 (nm): 507.6, 509.5, 514.5, 520.8, 529.0, 537.4, 545.8, 554.4, 562.7, 574.2, 583.6, 590.4, 598.8, 605.7, 617.5, 630.7, 644.2, 657.2, 670.1, 677.8, 691.1, 698.4, 705.3, 711.1, 717.9, 731.3, 738.5, 751.5, 763.7, 778.5, 794.0, 806.3, 819.7, 833.7, 845.8, 859.1, 872.8, 885.6
FWHM (nm): 12, 14, 20, 22, 24, 24, 24, 24, 24, 24, 20, 22, 24, 28, 30, 32, 28, 32, 30, 28, 32, 30, 28, 28, 28, 30, 30, 28, 32, 30, 28, 30, 32, 30, 30, 32, 32, 30
Terrestrial data capture
L0 (nm): 512.3, 514.8, 520.4, 527.5, 542.9, 550.6, 559.7, 569.9, 579.3, 587.9, 595.9, 604.6, 613.3, 625.1, 637.5, 649.6, 663.8, 676.9, 683.5, 698, 705.5, 711.4, 717.5, 723.8, 738.1, 744.9, 758, 771.5, 800.5, 813.4, 827, 840.7, 852.9, 865.3, 879.6, 886.5
FWHM (nm): 15, 18, 20, 22, 20, 21, 20, 22, 17, 18, 21, 20, 25, 28, 25, 28, 27, 27, 29, 24, 24, 25, 27, 28, 27, 26, 28, 28, 24, 28, 27, 27, 28, 28, 26, 24
2.4 Processing of airborne data
The data processing is described briefly in the following. More details of the approach are given by Hakala et al., (2013) and Honkavaara et al., (2013, 2014, 2016).
2.4.1 Georeferencing data. The study area included six
GCPs, which locations were measured using Leica System 500 receiver with Leica AT502 antenna. The measurements were approximately 45 min static measurements with 1 Hz data acquisition rate. The measurement data was post-processed using RTKPOST2.4.2-software (http://www.rtklib.com/). The solutions were calculated using Precise Point Positioning method (“PPP Static”). The precise orbit and clock data were downloaded from International GNSS Service
(https://igscb.jpl.nasa.gov/components/prods_cb.html). The
navigation file for the day was received from NERC British Isles continuous GNSS Facility (BIGF, http://www.bigf.ac.uk/).
The flight trajectory of the UAV was measured using single frequency GNSS receiver mounted on the UAV. The data acquisition rate was 2 Hz. The post-processing of the flight trajectory was calculated using RTKLIB Kinematic method using 1 Hz base station observation data from Ordnance Survey Oxford reference station (approximately 6 km from the study site). The flight trajectories were further interpolated to exact image acquisition time stamps.
2.4.2 Photogrammetric processing. Agisoft Photoscan
Professional commercial software (AgiSoft LLC, St. Petersburg, Russia) were used for the image orientations and DSMs. An integrated geometric processing was carried out for the RGB images and one band of the FPI images for the morning flights (f1, f2). Geometric processing for afternoon flights (f5, f6) was performed for three bands of FPI images simultaneously and then the results of orientations were merged and optimized with RGB images orientations. In the integrated orientation processing, there were a total of 881 images for the morning block (f1, f2) and 2078 images for the afternoon block. In order to transform the image orientations to the WGS84 coordinate system, the 6 GCPs and GPS-trajectory of the flight were used. The outputs of the process were the image exterior orientations and the camera calibrations in the object coordinate system. Dense point clouds were generated using RGB images to acquire as high as possible point density. Final point clouds were produced with 10 cm point interval. Orientations of the remaining FPI bands were optimized to the reference bands.
2.4.3 Radiometric processing. Empirical line method based
on reflectance panels and direct method based on at-sensor radiance and irradiance at object could be used to transform image DNs to reflectance. The two methods can also be integrated; panels determine the absolute level and the irradiance observations support monitoring the changes in illumination. (Hakala et al., 2013; Honkavaara et al., 2014).
Six reflectance reference targets were installed in a small opening in the test area (Figure 3). Panels were of size of 1 m x 1 m and had reflectance of 0.53 @ 540nm (white), 0.10 @ 540nm (grey) and 0.03 @ 540nm (black). A set of three panels, one of each target panel type, were positioned in a sun illumination and another set in the shadow of the canopy. The reflectance factors of the radiometric targets were measured in field the ASD with 18 degree optics, by referencing to the Spectralon reference panel. Finally, the spectra were sampled for the spectral bands of the images.
The ASD Field Spec Pro spectrometer (Analytical Spectral Devices) was used to capture irradiance on the ground level next to the radiometric targets during the flights. The irradiance was measured using cosine collector optics and each spectrum had a GPS timestamp for time synchronization with other measurements. Spectra were collected with 5 s time interval during the flights. The OOU2000 spectrometer was onboard the UAV with cosine collector optics to collect the irradiance above canopy. The optics were mounted to a stabilizing gimbal that was supposed to keep the cosine collector pointing directly towards zenith, however the performance of the gimbal was sufficient. This caused the irradiance data to have intensity offsets relative to the actual angle between the cosine collector and solar direction. This was corrected by calculating a level shifting correction factor using the ground irradiance data.
In this investigation, the reflectance calibration of the reference image in the first flight f1 was calculated using three panels by the empirical line method. Other images and flights were registered to the flight f1 using the irradiance measurements captured during the flight; for flights f1, f2 and f5 the ASD irradiance was used; the ASD was in shadow during the flight f6 thus the wideband Intersil irradiance was used.
Finally, reflectance signatures, point clouds and mosaics, and hemispherical directional reflectance factors (HDRF) were calculated using the parameters produced in previous phases.
2.5 Terrestrial data
Principles in processing of the terrestrial data were similar to the UAV data processing described in Section 2.4.
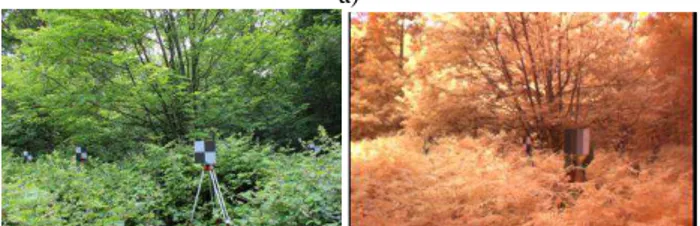
For the georeferencing, six metal tags with four-square pattern (Figure 6a) on tripods were placed around the tree; they were used for georeferencing and as tie points to register individual pole data. The locations of three reference tags were measured using static 45 min GPS measurement sessions. The measure-ment and post-processing procedures were the same as with the UAV GCPs. The image orientations and point clouds were calculated using the PhotoScan software.
Four-color Spectralon reference panel was imaged in the beginning of every imaging set (at each pole location) (Figure 6b); this was used to calculate the transformation from image DNs to reflectance with the empirical line method. OOU2000 spectrometer with cosine collector optics was attached to the FPI camera to collect the at sensor irradiance and the ASD was measuring irradiance at the clearing. Outputs of the processing were reflectance point clouds.
a)
Figure 6. a) Geometric reference tags present in the measurements. b) A color-infrared (NIR, R, G) band
composite of single FPI image frame with a 4-color Spectralon panel.
3. RESULTS AND DISCUSSION
3.1 Geometric processing
Photogrammetric processing of UAV data sets by the PhotoScan was automatic excluding the interactive GCP measurement and quality control. The RMS reprojection error was less than 0.55 pixels (Table 4). In the terrestrial data sets, the images collected in each pole position could be processed automatically by the PhotoScan, but manual support was necessary to integrate datasets captured in different pole positions. Coded targets were measured manually as tie points and used as error free matches in the alignment process. Due to different viewing angles and too low overlaps in some areas, three pole locations (1, 3 and 4) out of five could be combined to produce single combined point cloud. The average reprojec-tion error was 0.676 pixels.
Table 4. Statistics of the photogrammetric calculations. Dataset N ima N tie Nproj
Re-proj error
Dense N points
f1f2 881 123,039 329,595 0.541 105,660,385 f5f6 2077 62,372 263,477 0.528 101,202,403 t1t3t4 285 179,523 546,780 0.676 2,769,976
3.2 Radiometric processing
Examples of empirical line parameters for the morning flight f1 and terrestrial data capture are shown in Figure 7.
a)
-0.1 -0.08 -0.06 -0.04 -0.02 0 0.02 0.04
500 600 700 800 900
Wavelength (nm)
b
sd_b
-0.05 0 0.05 0.1 0.15 0.2 0.25 0.3 0.35
500 600 700 800 900
Wavelength (nm)
a
sd_a
b)
0 0.02 0.04 0.06 0.08 0.1 0.12 0.14 0.16
500 600 700 800 900
Wavelength (nm)
a
-0.07 -0.06 -0.05 -0.04 -0.03 -0.02 -0.01 0 0.01 0.02
500 600 700 800 900
Wavelength (nm)
b
Figure 7. Empirical line parameters Refl=a*DN+b a) for flight f1 and b) for terrestrial pole position t3.
Figures 8 and 9 illustrate the characteristics of irradiance mea-surement in forested scenes. Irradiance meamea-surements during the UAV image capture by the ASD on ground (at 794 nm) and by the ISL wide band sensor are shown in Figure 8. The ASD measurements indicated stable irradiance during the flights f1 and f2, during the last half of the flight f5 and f6 the irradiance spectrometer was in partial or full shadow, which is seen as variable level of irradiance measurements. The wideband irradi-ance measured by the ISL sensor in UAV indicated that the illu-mination conditions were stable during all flights; the tilting of the sensor when the UAV was flying in different flight direc-tions explains the changing level of irradiance measurements. The International Archives of the Photogrammetry, Remote Sensing and Spatial Information Sciences, Volume XLI-B7, 2016
Figure 9 shows examples of irradiance spectra on ground measured by the ASD in a small forest opening and in the UAV by the OOU2000. Before calibration there was difference in the irradiance level (Figure 9a) which could be eliminated by a calibration correction (Figure 9b). The impact of surrounding vegetation is visible in the spectrums (Figure 9a, b): the UAV irradiance is similar to ASD irradiance on ground level. When the UAV rises above canopy, the irradiance decreases in the NIR range; this is expected result and caused by the light scattering from the surrounding vegetation.
The empirical line method provides simple approach for reflec-tance calibration in close range applications. However, in forested environment finding suitable position for reflectance panels can be difficult. Physically based approach utilizing irradiance measurements offers more efficient approach. However, the accurate calibration of components of the system becomes crucial; poor calibration of sensors or instability will cause significant bias in measured reflectance values. In the ter-restrial measurement the illumination setup is extremely compl-icated. We will continue the research to develop efficient met-hods for reflectance characterization in complex environments.
a)
0 0.2 0.4 0.6 0.8 1 1.2
Image
f1
f2
f5
f6
b)
0 5000 10000 15000
Image
f1
f2
f5
f6
Figure 8. Irradiance measured for each image a) on ground level by ASD at 794 nm and b) in the UAV by the
Intersil wideband irradiance sensor.
a) b)
Figure 9. a) Irradiance spectrum measurements by ASD on ground (blue), OOU2000 close to ASD (green) and above canopy in UAV (red); OOU2000 irradiances are not calibrated. b) Calibrated OOU2000 in UAV
and ASD on ground.
3.3 Radiometric outputs
Previous results show the challenges in radiometric data capture. The spectral data presented here is still preliminary.
Examples of preliminary reflectance spectra of individual trees show different levels of spectra for different tree species (Figure 10). Hyperspectral mosaics of the flights f1 and f6 are presented in Figure 11. They are of good quality because of the uniformity of the imaging conditions. In Figure 12 examples of UAV and terrestrial spectral point clouds is shown.
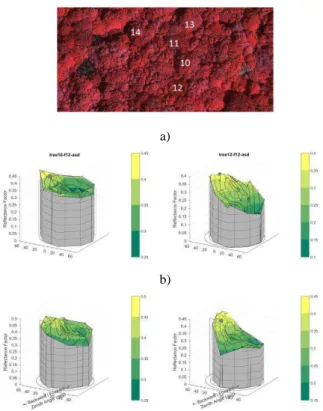
Figure 13 presents preliminary HDRFs sampled over the entire test area for the flight f1 for band at 794 nm using a spatial reso-lution of 5 m x 5 m (see approach in Honkavaara et al., 2014). The maximum view zenith angles were 65º. The preliminary HDRFs show increase in reflectance in the backward scattering direction, and the decrease in the forward scattering direction; this is expected behavior for forests. The HDRFs show great variability because of the natural variations in the scene; the fact that tree species was not taken into account increases the varia-bility. In Figure 14 the HDRFs of two individual trees sampled using a spatial resolution of 1 m x 1 m show differences in HDRFs of different species. In the further work it is necessary to improve the processing. For example, tree species specific HDRFs can be sampled to increase the number of samples in each class. Other improvements include better reflectance calibration, outlier detection and uncertainty estimation.
0 0.1 0.2 0.3 0.4 0.5 0.6
500 700 900
Wavelength (nm) f1-1 f1-2 f1-3 f1-4 f1-5 f1-10 Reflectance
Figure 10. Preliminary spectra from morning flights.
a) b)
Figure 11. Hyperspectral image mosaics composed of approximately 250 images from a) morning (f1) and
b) afternoon (f6) flights.
a) b)
c)
Figure 12. Hyperspectral point clouds from a) morning and b) afternoon UAV flights and c) terrestrial data. The International Archives of the Photogrammetry, Remote Sensing and Spatial Information Sciences, Volume XLI-B7, 2016
Figure 13. Preliminary HDRFs from the morning data set: the raw observations (left) and the fitted model (right).
a)
b)
Figure 14. Preliminary HRDFs of trees 10 (left) and 12 (right) sampled from a) morning and b) afternoon flights.
4. CONCLUSION
We presented preliminary results of reflectance and 3D characterization of a Wytham Woods, Oxford, UK, forest area using hyperspectral multiview/stereoscopic imagery captured using novel hyperspectral frame camera system. The system was operated from UAV platform and terrestrially. The new technology enables spectral reflectivity characterization of complex canopies. In the future we will further improve the reflectance characterization and study the uncertainty aspects. Furthermore, we will study the comprehensive analysis of forest characteristics using the 3D hyperspectral data.
ACKNOWLEDGEMENTS
The research leading to these results was funded through the Metrology for Earth Observation and Climate project (MetEOC-2), grant number ENV55 within the European Metrology Research Programme (EMRP). The EMRP is jointly funded by the EMRP participating countries within EURAMET and the European Union.
REFERENCES
Aasen, H.; Burkart, A.; Bolten, A.; Bareth, G.; 2015. Generating 3D hyperspectral information with lightweight UAV snapshot cameras for vegetation monitoring: From camera calibration to quality assurance. ISPRS Journal of Photog. and Remote Sens., vol. 108, pp. 245–259, 2015.
Hakala, T.; Honkavaara, E.; Saari, H.; Mäkynen, J.; Kaivosoja, J.; Pesonen, L.; Pölönen, I., 2013. Spectral imaging from UAVs under varying illumination conditions. Int. Arch. Photogramm. Remote Sens. Spat. Infor. Sci., XL-1/W2, pp. 189–194, 2013
Honkavaara, E.; Saari, H.; Kaivosoja, J.; Pölönen, I; Hakala, T.; Litkey, P.; Mäkynen, J.; Pesonen, L., 2013. Processing and Assessment of Spectrometric, Stereoscopic Imagery Collected Using a Lightweight UAV Spectral Camera for Precision Agriculture. Remote Sensing, vol. 5, no. 10, pp. 5006–5039.
Honkavaara, E.; Markelin, L.; Hakala, T.; Peltoniemi, J., 2014. The Metrology of Directional, Spectral Reflectance Factor Measurements Based on Area Format Imaging by UAVs. Photogrammetrie - Fernerkundung - Geoinformation, vol. 2014, no. 3, pp. 175–188, June, 2014.
Honkavaara, E.; Eskelinen, M.; Pölönen, I.; Saari, H.; Ojanen, H.; Mannila, R.; Holmlund, C.; Hakala, T.; Litkey, P.; Rosnell, T.; Viljanen, N.; Pulkkanen, M., 2016. Remote sensing of 3D geometry and surface moisture of a peat production area using hyperspectral frame cameras in visible to short-wave infrared spectral ranges onboard small unmanned airborne vehicle (UAV). IEEE TGARS, Accepted.
Leberl, F.; Irschara, A.; Pock, T.; Meixner, P.; Gruber, M.; Scholz, S.; Wiechert, A., 2010. Point clouds: Lidar versus 3D vision. Photogrammetric Engineering & Remote Sensing, vol. 76, no. 10, pp 1123–1134, 2010.
Liang, X.; Wang, Y.; Jaakkola, A.; Kukko, A.; Kaartinen, H.; Hyyppä, J.; Honkavaara, E., Liu, J., 2015. Forest Data Collection Using Terrestrial Image-based Point Clouds from a Hand-Held Camera Compared to Terrestrial and Personal Laser Scanning, IEEE TGARS.
Mäkynen, J.; Holmlund, C.; Saari, H.; Ojala, K.; Antila, T., 2011. Unmanned Aerial Vehicle (UAV) operated megapixel spectral camera. Proc. SPIE 2011, 8369, doi:10.1117/12.897712.
Saari, H.; Pellikka, I.; Pesonen, L.; Tuominen, S.; Heikkilä, J.; Holmlund, C.; Mäkynen, J.; Ojala, K; Antila, T., 2+11. Unmanned Aerial Vehicle (UAV) operated spectral camera system for forest and agriculture applications. Proc. SPIE 2011, 8174, doi:10.1117/12.897585.
Tommaselli, A.M.G.; Berveglieri, A., 2014. Automatic Orientation of Multi-Scale Terrestrial Images for 3D Reconstruction. Remote Sens. 6, 3020–3040.
C. Wu, 2013. Towards Linear-Time Incremental Structure from Motion. In 3D Vision - 3DV 2013, International Conference on, pp.127-134, June 29 2013-July 1 2013.