N
Save Nature to Survive9(1): 179-181, 2014 www.thebioscan.in
179
EVALUATION OF BIOAGENTS FOR MANAGEMENT OF THE ONION
PURPLE BLOTCH AND BULB YIELD LOSS ASSESSMENT UNDER
FIELD CONDITIONS
P. M. YADAV*, K. B. RAKHOLIYA AND D. M. PAWAR
Department of Plant Pathology, N. M. College of Agriculture,
N. A. U., Navsari - 396 450, Gujarat, INDIA
e-mail: [email protected]
INTRODUCTION
Onion (Allium cepa L.) rightly called as “queen of kitchen” is one of the important vegetable crops grown in India. According to Vavilov (1951) the primary center of origin lies in central Asia. The near East and Mediterranean are the secondary centers of origin and introduced in India from Palestine. It belongs to the family Alliaceae and genus Alliumis very large comprising of more than 500 spp. usually perennial bulbous plants. Out of these, Allium cepa (Onion) is the major cultivated species grown all over the world. Onion crop is attacked by 66 diseases, of which 10 bacterial, 38 fungal, 6 nematodes, 3 viral, 1 phytoplasmal, 1 phanerogamic plant parasite and 7 miscellaneous diseases and disorder. Among these diseases the purple blotch is one of the major constraints in onion cultivation. The pathogen is polyphagus infecting crop like onion, garlic, shallot and other Allium spp. High relative humidity (80 to 90%) and optimum temperature (24+1ºC) are favour for further development of purple blotch disease and causing considerable yield losses. Shahanaz et al. (2007) reported losses about 50 to 100 per cent due to purple blotch disease. Different chemicals including systemic and contact fungicides have been used for management of this disease (Srivastava et al., 1999; Kanzaria et al., 2003 and Rahman et al., 2003). However increase environmental pollution and present day public perception on pesticide contaminants of foods, development of alternate economical and eco-friendly approaches for disease management. The damage due to these chemicals was brought an awareness to find out other alternatives like eco-friendly management with the framework
of IDM without affecting our precious eco-system (Mukhopadhyay, 1994). Keeping in view economic importance of the onion and yield losses due to purple blotch in the crop, the present investigations were being planned and conducted experiment on A. porri with different bioagents in field condition.
MATERIALS AND METHODS
Field experiment was carried out in rabi season during the period 2011-12 and 2012-13 at the College farm, N.M.C.A., Navsari Agril. University, Navsari (Gujarat). The study was undertaken with the objective, management of purple blotch of onion caused by A. porri with bioagents in vitro condition. Seedlings of cv. Pilipattiwere planted in plot (4.0m x 1.8m). The first spray of bioagents (0.05%) was given on initiation of disease, remaining two sprays were carried out at 15 days interval. Control plot was maintained by without spraying any bioagent.
The detail’s bioagents treatments applied is given in Table 1. The severity of disease was measured using 0-5 Scale (Sharma, 1986) after second and third spray as,
The details of scales are as shown below, 0 No disease symptoms
1 A few spots towards tip covering 10 per cent leaf area.
2 Several dark purplish brown patch covering up to 20 per cent leaf area.
ABSTRACT
Among the several diseases, purple blotch diseases of onion (Allium cepa L.) caused by Alternaria porri (Ellis) Cif. is one of the most destructive disease causing accountable losses of about 80 to 90 per cent. The results obtained on the field efficacy of different bioagents tested, Pseudomonas fluorescens--I (0.5%) was found most antifungal against A. porri and recorded significantly least mean disease intensity (37.19%) and gave maximum bulb yield (27183 kg/ha). Both the fungal and bacterial antagonists tested were also found effective against A. porri and recorded significantly reduced mean disease intensity thereby increased the bulb yield over unsprayed control. Based on incremental cost:benefit ratio (ICBR) of the bioagents spray treatments, P. fluorescens--I (ICBR, 1:13.87) was found economical and effective for the management of purple blotch of onion followed by Bacillus subtilis
(ICBR, 1:12.93).
KEYWORDS
Onion Purple blotch
Alternaria porri
Bioagents.
Received on :
15.04.2013
Accepted on :
21.12.2013
180 P. M. YADAV et al.,
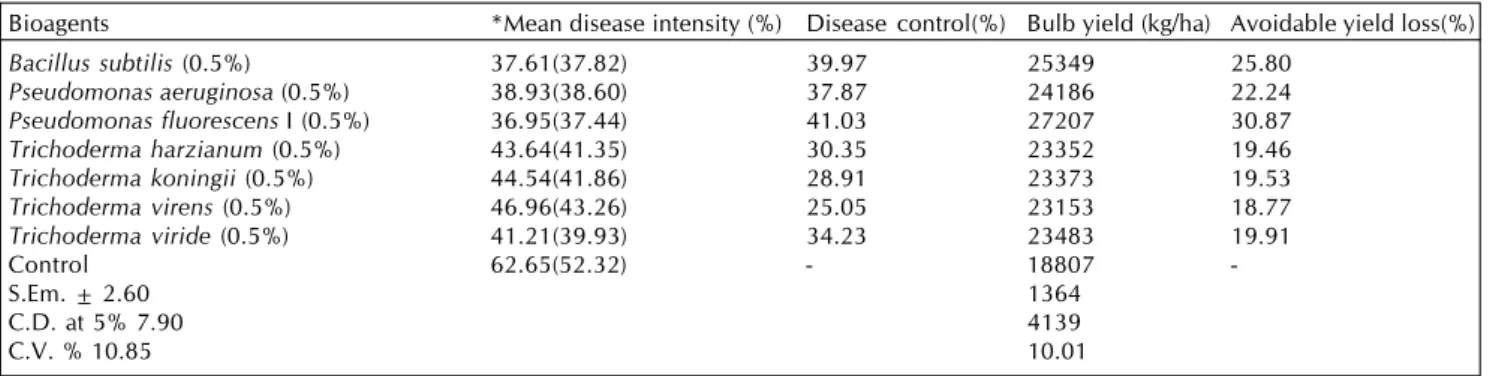
Table 1: Evaluation of different bioagents against purple blotch of onion underfield conditions during rabi 2011-12
Bioagents *Mean disease intensity (%) Disease control(%) Bulb yield (kg/ha) Avoidable yield loss(%)
Bacillus subtilis (0.5%) 37.61(37.82) 39.97 25349 25.80
Pseudomonas aeruginosa (0.5%) 38.93(38.60) 37.87 24186 22.24
Pseudomonas fluorescens-I (0.5%) 36.95(37.44) 41.03 27207 30.87
Trichoderma harzianum (0.5%) 43.64(41.35) 30.35 23352 19.46
Trichoderma koningii (0.5%) 44.54(41.86) 28.91 23373 19.53
Trichoderma virens (0.5%) 46.96(43.26) 25.05 23153 18.77
Trichoderma viride (0.5%) 41.21(39.93) 34.23 23483 19.91
Control 62.65(52.32) - 18807
-S.Em. ± 2.60 1364
C.D. at 5% 7.90 4139
C.V. % 10.85 10.01
Values in parenthesis are angular transformed value;* Average of three replications
Table 2: Evaluation of different bioagents against purple blotch of onion underfieldconditions during rabi 2012-13
Bioagents *Mean disease intensity (%) Disease control(%) Bulb yield (kg/ha) Avoidable yield loss(%)
Bacillus subtilis (0.5%) 40.36(39.44) 37.29 25306 26.14
Pseudomonas aeruginosa (0.5%) 39.26(38.79) 35.99 24139 22.57
Pseudomonas fluorescens-I (0.5%) 37.43(37.72) 41.84 27160 31.18
Trichoderma harzianum (0.5%) 43.83(41.45) 31.89 23334 19.90
Trichoderma koningii (0.5%) 45.28(42.29) 29.64 23319 19.85
Trichoderma virens (0.5%) 45.62(42.48) 29.11 23229 19.54
Trichoderma viride (0.5%) 41.25(39.96) 35.09 23483 20.41
Control 64.35(53.34) - 18690
-S.Em. ± 2.50 1369
C.D. at 5% 7.59 10.06
C.V. % 10.34 4153
Values in parenthesis are angular transformed value; * Average of three replications
Table 3: Evaluation of different bioagents against purple blotch of onion under fieldconditions (Pooled data of rabi 2011-12 and 2012-13)
Bioagents *Mean disease intensity (%) Disease control(%) Bulb yield (kg/ha) Avoidable yield loss(%)
Bacillus subtilis (0.5%) 38.98(38.63) 38.62 25327 25.97
Pseudomonas aeruginosa (0.5%) 39.09(38.70) 38.45 24162 22.40
Pseudomonas fluorescens-I (0.5%) 37.19(38.58) 41.44 27183 31.02
Trichoderma harzianum (0.5%) 43.74(41.40) 31.12 23343 19.68
Trichoderma koningii (0.5%) 44.91(42.08) 29.28 23346 19.69
Trichoderma virens (0.5%) 46.29(42.87) 27.11 23191 19.15
Trichoderma viride (0.5%) 41.23(39.95) 35.08 23479 20.14
Control 63.50(52.83) - 18749
YxT
S.Em. ± 2.55 1366
C.D. at 5% NS NS
C.V. % 10.59 10.03
Values in parenthesis are angular transformed value;* Average of three replications.
Table 4: Economics of bioagents sprayings for the management of purple blotch in onion cv.Pilipatti
Treatments Qty required Totalcost Mean Yield( Gross Additional Total Net ICBR /ha ofbioagent/ PDI q/ha) income income/ costof profit
ha (Rs)** *** ha over cultivation (Rs)
control(Rs) (Rs)
Bacillus subtilis (0.5%) 2500 L 1350 38.98(38.63) 253.27 177289 46046 13710 32336 1:12.93
Pseudomonas aeruginosa (0.5%) 2500 L 1350 39.09(38.70) 241.62 169134 37891 13710 24181 1:12.33
Pseudomonas fluorescens-I (0.5%) 2500 L 1350 37.19(38.58) 271.83 190281 59038 13710 45328 1:13.87
Trichoderma harzianum (0.5%) 2500 L 1500 43.74(41.40) 233.43 163403 32160 13860 18300 1:11.78
Trichoderma koningii (0.5%) 2500 L 1500 44.91(42.08) 233.46 163422 32179 13860 18319 1:11.79
Trichoderma virens (0.5%) 2500 L 1500 46.29(42.87) 231.91 162337 31094 13860 17234 1:11.71
Trichoderma viride (0.5%) 2500 L 1500 41.23(39.95) 234.79 164353 33110 13860 19250 1:11.85
Control (water spray) - - 63.50(52.83) 187.49 131243 - - -
-(Rs)
181
3 Several patches with paler outer zone covering up to 40 per cent leaf area.
4 Leaf streaks covering up to 75 per cent leaf area or breaking of the leaves from center.
5 Complete drying of the leaves or breaking of the leaves from center.
Per cent disease intensity (PDI) was calculated by using the following formula (Wheeler, 1969),
RESULTS AND DISCUSSION
During rabi 2011-12, the per cent disease intensity was 62.65 observed. Proportionately different bioagents controlled the disease effectively. Among the different bioagents, the per cent intensity was less (36.95) in Pseudomonas fluorescens-I sprayed plot which was at par with all the bioagents tested rather than Trichoderma virens with high per cent disease intensity (46.96).
It is evident from data presented in Table 1, that all the bioagents were effective in reducing the incidence of purple blotch as compared to control. Maximum disease control (41.03%) was recorded in foliar application of P. fluorescens-I followed by
Bacillus subtilis, P. aeruginosa and T. viride resulting in 39.97, 37.97 and 34.23 per cent in disease control, respectively. Correspondingly, maximum bulb yield of 27207 kg/ha was also recorded in P. fluorescens-I sprayed plot which could reduce 30.87 per cent yield loss over control followed by B. subtilis (25349 kg/ha), P. aeruginosa (24186 kg/ha) and T. viride (23483 kg/ha) sprayed plots which could reduce 25.80, 22.24 and 19.91 per cent yield loss respectively over control. During rabi 2012-13, the per cent disease intensity was increased to 64.35. Similarly different bioagents controlled the disease effectively over control. Among the different bioagents, the per cent intensity was also less (37.43) in P. fluorescens-I sprayed plot which was at par with all the bioagents tested rather than T. virens with high per cent disease intensity (45.62). Maximum disease control (41.84%) was recorded in foliar application of P. fluorescens-I followed by
B. subtilis, P. aeruginosa and T. viride resulting in 37.29, 35.99 and 35.09 per cent in disease control, respectively. Correspondingly, maximum bulb yield of 27160 kg/ha was also recorded in P. fluorescens-I sprayed plot which could reduce 31.18 per cent yield loss over control followed by B. subtilis (25306 kg/ha), P. aeruginosa (24139 kg/ha) and T. viride (23483 kg/ha) sprayed plots which could reduce 26.14, 22.57 and 20.41 per cent yield loss respectively over control (Table 2).
Pooled analysis of data presented Table 3 and Fig. 1, 2 revealed no significant differences between bioagents treatments with respect to per cent disease intensity during rabi 2011-12 and
rabi 2012-13. The pooled data over the years on the intensity
of disease indicated that the bioagents P. fluorescens-I was found superior in reducing the purple blotch of onion gives 37.19 per cent disease intensity with maximum disease control (41.44) among bioagents followed by B. subtilis as with PDI value of 38.98, P. aeruginosa with PDI value of 39.09 and T. viride with PDI value of 41.23 with 38.62, 38.45 and 35.08 per cent disease control respectively. Correspondingly, maximum bulb yield of 27183 kg/ha was recorded in P. fluorescens-I sprayed plot which could reduce 31.02 per cent yield loss over control followed by followed by B. subtilis
(25327 kg/ha), P. aeruginosa (24162 kg/ha) and T. viride
(23479 kg/ha) sprayed plots which could reduce 25.97, 22.40 and 20.14 per cent yield loss respectively over control.
Trichoderma virens yielded 23191 kg/ha bulb, which was the lowest bulb yield among all the treatments with 19.15 per cent increase yield over control while minimum bulb yield of 18749 kg/ha was recorded in control plot (Table 3 and Fig. 2). The incrimental C: B ratio was also found higher in P. fluorescens-I (1:13.87) followed by B. subtilis (1:12.93) and P. aeruginosa (1:12.33) sprayed plots compared to other bioagents and control plot over two years (Table 4).
The results of present study are in line with Mohan et al. (2001) who found lowest disease percentage was observed in
B. subtilis and T. viride in controlling leaf blight in onion caused by A. porri.
REFERENCES
Kanzaria, M. V., Vaddoria, M. A., Golani, L. J. and Patel, R. K. 2003. Management of stalk blight disease of onion seed crop. Approaches
for sustainable development of onion and garlic. National
Horticultural Research and Development Foundation, Nashik.pp.
320-323.
Mohan, K., Ebenezer, E. G. and Seetharaman, K. 2001. Management of leaf blight disease of onion caused by Alternaria porri by plant extracts, plant oils and bioagents. News Letter National Horticultural
Research and Development Foundation. 21/22(1,3/4): 1-14.
Mukhopadhyay, A. N. 1994. Biocontrol of soil borne plant pathogens, current status, future prospects and potential limitations. Indian
Phytopathology. 47: 119-126.
Rahman, M. A., Chiranjeevi, C. H. and Reddy, I. P. 2003. Management of leaf blight disease of onion. Approaches for sustainable development of onion and garlic. National Horticultural Research and Development
Foundation, Nashik. pp. 311-314.
Shahanaz, E., Razdan, V. K. and Raina, P. K. 2007. Survival, dispersal and management of foliar blight pathogen of onion. J. Mycol. Pl.
Pathol. 37(2): 213-214.
Sharma, S. R. 1986. Effect of fungicidal sprays on purple blotch and bulb yield. Indian Phytopathology. 39(1): 72-82.
Srivastava, P. K., Tiwari, B. K. and Srivastava, K. J. 1999. Effect of different fungicides and spray interval on the control of purple blotch disease of late kharif onion. News letter NHRDF. 19(4): 7-9.
Vavilov 1951. The origin, variation, immunity and breeding of cultivated plants. Chronica Botanica Waltham, Mass, (USA).
Wheeler, B. E. J. 1969. An introduction to plant diseases. J. Wiley and Sons Ltd., London. pp.
Per cent Disease = Intensity
Sum of numerical ratings Number of observations
5 100 X