Research Article
Development of Dye-Sensitized Solar Cells with Sputtered
N-Doped TiO
2
Thin Films: From Modeling the Growth
Mechanism of the Films to Fabrication of the Solar Cells
D. A. Duarte,
1M. Massi,
1,2and A. S. da Silva Sobrinho
11Plasmas and Processes Laboratory, Technological Institute of Aeronautics, S˜ao Jos´e dos Campos 12228-900, SP, Brazil 2Institute of Science and Technology, Federal University of S˜ao Paulo, S˜ao Jos´e dos Campos 12245-000, SP, Brazil
Correspondence should be addressed to D. A. Duarte; [email protected]
Received 7 May 2013; Accepted 7 January 2014; Published 25 February 2014
Academic Editor: Cooper H. Langford
Copyright © 2014 D. A. Duarte et al. his is an open access article distributed under the Creative Commons Attribution License, which permits unrestricted use, distribution, and reproduction in any medium, provided the original work is properly cited.
In this paper, nitrogen-doped TiO2 thin ilms were deposited by DC reactive sputtering at diferent doping levels for the
development of dye-sensitized solar cells. he mechanism of ilm growth during the sputtering process and the efect of the
nitrogen doping on the structural, optical, morphological, chemical, and electronic properties of the TiO2were investigated by
numerical modeling and experimental methods. he inluence of the nitrogen doping on the working principle of the prototypes was investigated by current-voltage relations measured under illuminated and dark conditions. he results indicate that, during the ilm deposition, the control of the oxidation processes of the nitride layers plays a fundamental role for an efective incorporation
of substitutional nitrogen in the ilm structure and cells built with nitrogen-doped TiO2have higher short-circuit photocurrent in
relation to that obtained with conventional DSSCs. On the other hand, DSSCs built with nondoped TiO2have higher open-circuit
voltage. hese experimental observations indicate that the incorporation of nitrogen in the TiO2lattice increases simultaneously
the processes of generation and destruction of electric current.
1. Introduction
Since the dye-sensitized solar cells (DSSCs) were introduced by O’Regan and Graetzel in the early 90s [1] several studies were conducted aiming to improve the light-to-electricity conversion of the DSSCs by modifying various cell compo-nents, including the transparent conductive oxides [2], light absorbers [3], redox electrolytes [4], counter-electrodes [5], and the TiO2structure [6–8]. In 2001, Asahi and coauthors [9] reported a theoretical study in which they simulated the doping of the TiO2with several metal and nonmetal anions in order to red-shit its optical absorption once this material can absorb only UV light due to its wide band gap. In their studies, it was veriied that the substitutional doping with nitrogen was more efective to decrease the energy band gap of the TiO2due to the insertion of N2p states above the top of valence band. Since then, many experimental investigations
have been published on this issue, so that, a large number of works have applied this improved material to study the DSSC technology. Kang and coauthors [10], for example, reported that the nitrogen-doped titania electrode-based DSSCs showed superior eiciency relative to that attained with pure titania. Ma and coauthors [11] found similar results. Lindgren and coauthors [12] reported that nitrogen-doped TiO2electrode-based DSSC displayed an improved incident photon to electron conversion eiciency (IPCE) relative to that obtained with undoped TiO2electrode.
Nitrogen-doped TiO2can be deposited as crystalline or amorphous structure where the overall composition is oten a mixture between TiN, TiO2and suboxides like TiO, Ti2O3, and Ti3O5. However, Hashimoto and coauthors [13] found that TiO and Ti2O3 are the most predominant suboxides obtained during the reactive sputter deposition of TiO2. In addition, XPS analyses [14, 15] revealed substitutional and Volume 2014, Article ID 839757, 13 pages
interstitial nitrogen incorporated in the TiO2 lattice, which is in agreement with the theoretical investigations conducted by Asahi et al. [9].
According to Jiang and coauthors [16] nitrogen-doped TiO2can be prepared from incorporation of nitrogen atoms in the TiO2lattice or oxidation of TiN. In the irst case, nitro-gen is usually incorporated by sol-gel method [17], chemical-vapor deposition [18, 19],and hydrothermal and solvother-mal synthesis [20–22]. he other one can be ascribed, for example, by oxidation of TiN at high temperatures [23] and micro-arc oxidation from ion beam-assisted deposition [24]. However, nitrogen incorporated in the stoichiometric TiO2 from chemical methods, for example, requires high energy because the Ti–O bonds are diicult to be broken by nitrogen atoms [16]. As a result, the overall ilm structure, in this case, becomes interstitially doped and the energy band gap, as well as, the optical absorption remains approximately unaltered. he second case, oxidation of TiN, is a more eicient method for incorporation of substitutional nitrogen due to the facility of the Ti–N bonds to be broken by oxygen [16]. However, some experimental investigations [25,26] reported a sudden reduction in the energy band gap of nitrogen-doped TiO2 prepared by reactive sputtering once this technique combines the oxidation of TiN and chemisorption of reactive gas particles [27].
Nitrogen-doped TiO2 prepared by reactive sputtering is generally deposited from a metallic titanium target immersed in a reactive gas mixture of argon, nitrogen, and oxygen [12, 25,26, 28, 29]. In some cases, the exchange of oxygen by water vapor has been also used as an alternative [30]. In the most cases, nitrogen-doped TiO2is usually deposited by assuming high nitrogen concentration mixed with low oxy-gen concentration. his procedure induces irst the growth of nitride layers to later be oxidized by oxygen particles, thereby improving the incorporation of the nitrogen particles in the ilm lattice. Large amounts of oxygen mixed with small amounts of nitrogen lead to a poor incorporation of nitrogen particles in the ilm lattice or not as eicient as it should be. See studies conducted in [25,28].
A correct understanding of the efects that lead to an efective incorporation of nitrogen particles in the TiO2 lattice is not always an easy task from experimental methods. Sometimes the correlation of the experimental results with numerical data, for example, can help us to clarify some details not achievable in laboratory. For this, it is necessary to use a reliable model that describes consistently all necessary parameters during ilm deposition. In this way, the so-called Berg model [31] shows to be interesting on this issue due to its capacity to describe adequately all experimental parameters during the deposition process. Previous studies based on Berg’s model and conducted by our group [32] show that there is an optimal gas mixture for deposition of nitrogen-doped TiO2by reactive sputtering in which the band gap is reduced. his inding is consistent with several experimental results obtained elsewhere. However, more studies are needed about this subject, mainly studies related to the efects that lead to the incorporation of substitutional nitrogen during the temporal evolution of the growing ilm.
In this paper, nitrogen-doped TiO2 thin ilms were deposited by DC reactive sputtering and used for fabrication of dye-sensitized solar cells. he general efects of nitrogen incorporation on the ilm properties, as well as, its inluence on the working mechanism and performance of the solar cells were promptly investigated. In addition, an original numerical model was used to simulate the reactive sputter deposition of nitrogen-doped TiO2 in order to study the growth mechanism of the ilms and understand how the substitutional nitrogen is incorporated in the ilm lattice during the reactive deposition.
2. Experimental Setup and Model Input Data
Nitrogen-doped TiO2 thin ilms were deposited by DC reactive magnetron sputtering using a planar magnetron with a titanium disk (99.6%) of 34 mm in diameter as target. Films were deposited at diferent oxygen low rates (0.2, 0.6, 0.9, 1.3, 1.7, 2.2, 2.6, 3.0, and 3.5 sccm) on grounded glass substrates coated with luorine-tin oxide (FTO). Other experimental parameters such as argon low rate, nitrogen low rate, DC power, and target-to-substrate distance were ixed at 10 sccm, 10 sccm, 150 W, and 30 mm, respectively. Ater deposition process, they were analyzed by proilometry, X-ray difraction (XRD), optical spectrophotometry, atomic force microscopy (AFM), Rutherford backscattering spectroscopy (RBS), and X-ray photoelectron spectroscopy (XPS). he energy band gap of the ilms was calculated from Tauc relation for indirect semiconductors [28] and the absorption coeicient, used in the Tauc’s plot, was taken from relation used in [12]. Proilometry data were used to calculate the energy band gap and will not be shown. Film thicknesses were ixed at 2�m. It must be cleared that the XPS technique was used to investigate the chemical composition of the ilms surface and the RBS technique was used to investigate the bulk.he numerical model used in this paper and all necessary parameters used during the simulations are described in details according to [32]. In summary, the model is repre-sented by a set of ordinary diferential equations that describe the reactions of destruction and formation of compound on the target and substrate. Solving these sets of nonlinear equations gives the chemical composition on the target and substrate in either stationary or nonstationary conditions. In the present study, we will conduct simulations only in the nonstationary region. Studies about the stationary condition were conducted in the above-referenced study.
process, the electrodes were light purple. Sealing was done with 25�m thick thermoplastic hot-melt sealing foil and all electrical contacts were improved with silver paint. he efective area of the cells was ixed at 2.25 cm2(0.5×4.5 cm2). Ater inishing all these steps , they were characterized under irradiation of an Oriel Xe (Hg) 250 W lamp with AM 1.5 ilter, used to simulate the solar spectrum at 1 sun. he light intensity was adjusted using a Newport Optical Power Meter. Current-voltage relations were obtained using linear sweep voltammetry at 1 mV s−1using an Eco Chemie-Autolab PGSTAT 10 potentiostat.
3. Results and Discussions
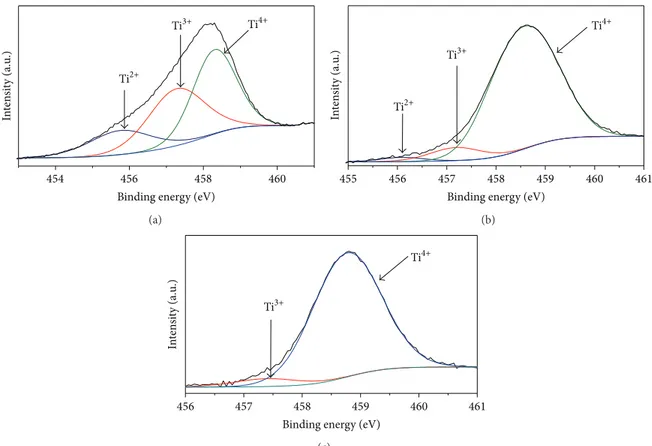
he results from XPS are summarized in Figures1and2. Fig-ure1shows the Ti2p core level for ilms deposited at O2low rate of 0.2, 0.6, and 3.5 sccm. All spectra were decomposed in three characteristic contributions: Ti2+2p3/2, Ti3+2p3/2, and Ti4+2p3/2. hese peaks are, respectively, assigned to TiO, Ti2O3,and TiO2[34,35]. However, for titanium oxynitride-like structures, TiO cannot be clearly distinguished by XPS because the peak Ti2+2p3/2 is also assigned to TiN [25]. he increase of the peak Ti4+2p3/2and decrease of the other ones, with increased O2low rate, indicate the full oxidation of the ilm surface and, as consequence, formation of TiO2.
he N1s core level is depicted in Figure 2. he results indicate a characteristic peak at about 396 eV for all spectra. According to fundamental studies, this peak is assigned to the substitutional nitrogen and it is generally known as “nitride” peak due to the substitution of O2− by N2− in the TiO2 lattice giving the so-called O–Ti–N structure [14]. Other peaks between 398 and 402 eV were also detected by XPS and according to Saha and Tompkins they are related to chemisorbed N2at the grain boundaries [14]. However, Sato and coauthors [17] claim that the assignments of N1s peaks at 400 and 402 eV, for example, are implausible at room temperature because molecular N2 cannot be chemisorbed on metal oxides like TiO2. Since then , several studies stated that these peaks are assigned to diferent other forms of interstitial nitrogen as, for example, nitric oxides (NO�) or other related chemical states like NC and NH3[36–39]. hus, we consider that the peaks between 398 and 402 eV are related to interstitial nitrogen.
he XPS proiles show two peaks assigned to Ti–N bound in Figure2(a). he irst, detected at 395.7 eV, is ascribed to the Ti–N bound in nitride layers and the second one, detected at 396.8 eV, is assigned to the substitutional nitrogen in the TiO2 lattice. However, as the O2 low rate increases, the binding energy associated to the Ti–N bound at 395.7 eV is shited to 396 and, then, to 396.3 eV. See Figures2(b) and
2(c), respectively. According to Chen and Burda [40], the electron density around to the nitrogen atoms is reduced upon oxidation of the nitride layers. his is caused by the high oxygen electronegativity: therefore, the N1s binding energy in the O–Ti–N structure becomes higher than in the N–Ti–N structure. By this way, this result shows that the oxidation of TiN changes the chemical state of the nitrogen from a simple
chemisorbed particle in nitride layers to a dopant in the TiO2 structure.
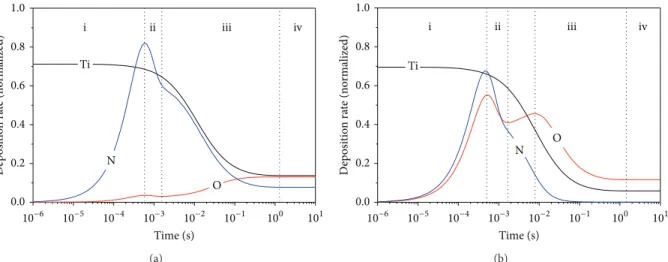
he results from numerical modeling for ilms deposited at O2 low rates of 0.2 and 3.5 sccm are shown in Figures
3(a)and3(b), respectively. hese graphs show the normalized deposition rate. For ilm deposited at O2low rate of 0.2 sccm (Figure3(a)) one can observe four well-deined stages. (i) Initially, ater the discharge breakdown, particles of the reactive gases (N and O) react by chemisorption with Ti particles already deposited at the substrate for compound formation. (ii) Ater occupation of all available sites in the ilm structure, the chemisorption rate of the nitrogen and oxygen particles is reduced. At this stage, the target becomes poisoned due to the compound formation on it. As consequence, the sputtering yield as well as the lux of Ti particles toward the substrate decreases [32]. At stage (iii), the oxygen concentration increases again due to the oxidation of the nitride layers through the reaction TiN + O2 →TiO2+ (1/2)N2where the amount of nitrogen released back again to the gas phase and the remaining one becomes trapped as substitutional or interstitial doping. At stage (iv), the system becomes stationary. he same mechanism occurs during deposition at O2low rate of 3.5 sccm. However, due to the high O2concentration, the efect related to the oxidation process becomes more intense, thus eliminating almost by complete the amount of nitrogen in the ilm structure; see Figure3(b).
he explanations for stages (i), (ii), and (iii), in Fig-ure3(b), are the same used for Figure3(a). At stage (iv), a larger amount of nitrogen is released from ilm structure due to the higher O2concentration in the gas phase. In addition, the lowering in the chemisorption rate of the oxygen particles on the substrate is caused by decreasing of the Ti lux from the target. At stage (v), the system becomes stationary.
According to all these observations, the oxidation of the nitride layers seems to be the main responsible by eliminating the nitrogen particles of the ilm structure so the correct control of this parameter may result in better doping levels [32]. To exemplify the inluence of the oxidation of the nitride layers on the chemical composition of the ilms, see Figure4. In this igure, only the normalized deposition rate for nitrogen and oxygen is shown and calculations were done at O2low rate of 3.5 sccm for cases with and without oxidation of TiN. Notice that the modeling without oxidation of the nitride layers is unreal. We are just using it to exemplify the importance of the oxidation process during ilm growing. he results show that proiles, with and without oxidation, are quite diferent. In the case for oxidation of TiN (Figure4(a)), the remaining amount of nitrogen, in the stationary region, is lower than that obtained in the case without oxidation of TiN (Figure4(b)) and the amount of oxygen in the case with oxidation of TiN is higher than that obtained in the case without the oxidation process. he results from numerical data employing oxidation of TiN are in agreement with XPS indings.
454 456 458 460
Binding energy (eV)
In
ten
si
ty (a.u
.)
Ti3+
Ti2+
Ti4+
(a)
Binding energy (eV)
In
ten
si
ty (a.u
.) Ti3+
Ti2+
Ti4+
455 456 457 458 459 460 461
(b)
Binding energy (eV)
In
ten
si
ty (a.u
.)
Ti3+
Ti4+
456 457 458 459 460 461
(c)
Figure 1: XPS spectra for Ti2p3/2core level of the ilms deposited at (a) 0.2, (b) 0.6, and (c) 3.5 sccm.
Ti–N
O–Ti–N
NH3
N–C
N–O
394 396 398 400 402 404
Binding energy (eV)
In
ten
si
ty (a.u
.)
(a)
O–Ti–N
N–C
N–O
394 396 398 400 402 404 406
Binding energy (eV)
In
ten
si
ty (a.u
.)
(b)
O–Ti–N N–C
394 396 398 400 402 404 406
Binding energy (eV)
In
ten
si
ty (a.u
.)
(c)
1.0
0.8
0.6
0.4
0.2
0.0
10−6 10−5 10−4 10−3 10−2 10−1 100 101
Time (s)
D
ep
osi
tio
n
ra
te
(no
rmalized)
N
O Ti
i ii iii iv
(a)
1.0
0.8
0.6
0.4
0.2
0.0
10−6 10−5 10−4 10−3 10−2 10−1 100 101
Time (s)
D
ep
osi
tio
n
ra
te
(no
rmalized)
N O
Ti
i ii iii iv
(b)
Figure 3: Deposition rate at oxygen low rate of (a) 0.2 and (b) 3.5 sccm.
1.0
0.8
0.6
0.4
0.2
0.0
10−6 10−5 10−4 10−3 10−2 10−1 100 101
Time (s)
D
ep
osi
tio
n
ra
te
(no
rmalized)
With oxidation of TiN
N O
(a)
1.0
0.8
0.6
0.4
0.2
0.0
10−6 10−5 10−4 10−3 10−2 10−1 100 101
Time (s)
D
ep
osi
tio
n
ra
te
(no
rmalized)
Without oxidation of TiN
N
O
(b)
Figure 4: Deposition rate at oxygen low rate of 3.5 sccm for the cases (a) with and (b) without oxidation of the nitride layers.
Ti N Ti
Ti N Ti N Ti
N N
Ti N Ti N Ti
Ti
N
Ti
Molecular oxygen Molecular
nitrogen
Atomic oxygen Atomic
nitrogen Titanium
atom
O
O O
O
O O
O O O
O
O O
O Ti
Ti
Ti
Ti Ti Ti
Ti Ti Ti
Ti Ti
Ti
Ti
Ti Ti
Ti
N
N N N
N N
N N
N
N N
N N
Deposition of TiN (creation of suboxides)Oxidation of TiN Formation of N–TiO2
Nitrogen released from surface ater oxidation
2.5
2.0
1.5
1.0
0.5
0.0
0.0 1.0 2.0 3.0
0.0 0.2 0.4 0.6 0.8 1.0
R
atio O/T
i
R
atio N/T
i
Oxygen flow rate (sccm) Stoichiometric TiO2
O/Ti N/Ti
4.0
Figure 6: Chemical composition of the ilms obtained by RBS as
function of the oxygen low rate (reproduced from [32]).
(c)
(b)
(a)
20 30 40 50 60 70
(101) TiO2anatase
(200)
2�(deg)
Substrate
In
ten
si
ty (a.u
.)
Figure 7: XRD patterns for ilms deposited at (a) 0.2, (b) 0.6, and (c) 3.5 sccm.
[42] and enabling nitrogen particles to be incorporated as substitutional doping in the voids of the ilm lattice [43]. In addition, the reaction between O and sputtered Ti followed by reaction with N is another path for incorporation of substitutional nitrogen, but, at low O2low rates, this reaction is expected to be negligible [32]. On the other hand, as the O2 low rate increases, oxygen tends to react with suboxides more easily than nitrogen due to its higher sticking coeicient, and as consequence, the substitutional N concentration decreases and ilm becomes mostly covered by TiO2[32].
he chemical composition of the ilms obtained by RBS is shown in Figure6. Similar results for oxynitride-like layers were observed elsewhere [26–28,43]. At high O2low rates, a decrease in the nitrogen concentration and the increase of oxygen content in the ilm composition were observed. According to studies conducted in the past, this increased oxygen content is assigned to oxidation of TiN [26, 44], thereby being in agreement with the results of the numerical model. In addition, the results indicate a ratio O/Ti<2 for
ilms deposited at 0.2, 0.6 and 0.9 sccm. his result suggests the existence of suboxides and, as consequence, O vacancies in the ilm bulk, although this result may be also ascribed to substitution of O by N in the TiO2structure. he presence of O defects in the bulk and surface of the ilms was investigated as described to follow.
he origin of Ti3+is related to the existence of O vacancies in the bulk and surface, so each vacancy reduces two adjacent Ti atoms from Ti4+to Ti3+. hus, the small intensity of active states Ti3+ in Figure1(c)is likely attributed to the existence of O vacancies on ilm surface once RBS data, for the same ilm, show a ratio O/Ti = 2.05 so that it indicates that the bulk is stoichiometric. On the other hand, the presence of active states Ti3+ in Figures1(a)and 1(b)may be ascribed, for example, to the existence of O vacancies in either bulk or surface once the ratio O/Ti is lower than 2 for these two ilms. According to XRD spectra depicted in Figure7, ilm deposited at 0.2 sccm is amorphous. his means that the bulk and surface of this ilm have O deiciency. On the other hand, ilms deposited at 0.6 and 3.5 sccm are crystalline, which indicates a bulk without excessive vacancies. hus, the ratio O/Ti<2 for ilm deposited at 0.6 sccm is an indicative that the voids in the TiO2 lattice were eiciently occupied by substitutional nitrogen so that the presence of O vacancies in this structure is mainly attributed to surface defects. hese appointments are summarized in Table1.
he efect of nitrogen doping on the energy band gap and refractive index is shown in Figure8(a). he refractive index was calculated from the Moss rule [45]. he results indicate a decrease in the energy band gap as the O2low rate decreases. Similar behavior was observed in other publications [25,
26]. he lowest energy band gaps of 1.9 and 2.5 eV were attained for ilms deposited at 0.2 and 0.6 sccm, respectively. As mentioned previously, this is caused by insertion of midgap states above the valence band of the ilms [9]. he highest energy band gaps of 3.2 eV were measured for ilms deposited at high O2 low rates. hese values correspond to the energy band gap of pure anatase TiO2, which is in agreement with XRD analysis. his result indicates that these ilms were not efectively doped with nitrogen, although XPS has detected a tiny concentration of substitutional nitrogen (see Figure2(c)). he refractive index of the nitrogen-doped TiO2 ilms has achieved values above 2.6 and, as the ilm surface is oxidized, it decreases toward the typical values of undoped anatase TiO2. Similar behavior was also observed elsewhere [25,26].
Ener
g
y ba
nd ga
p (eV)
Ref
rac
ti
ve
index
Refractive index Energy band gap
3.5
3.0
2.5
2.0
1.5
0.0 1.0 2.0 3.0 4.0
2.7
2.6
2.5
2.4
2.3
Oxygen flow rate (sccm)
(a)
A
b
so
rp
tio
n
co
eicien
t (a.u
.)
Film deposited at
0.2sccm
0.6sccm
3.5sccm
350 400 450 500 550 600 650 700
Wavelength (nm)
Absorption caused by active
states Ti3+in the ilm bulk
(b)
Figure 8: Energy band-gap (reproduced from [32]) and refractive index as function of the oxygen low rate and (b) absorption coeicient
for ilms deposited at 0.2, 0.6, and 3.5 sccm as function of photon wavelength.
Table 1: Structural properties of the ilms.
Deposition condition
(Oxygen low rate) Structure Crystal type
Oxygen defects
Bulk Surface
0.2 sccm Amorphous — Yes Yes
0.6 sccm Crystalline Anatase No Yes
3.5 sccm Crystalline Anatase No Yes
undoped TiO2 [46, 48]. Since there is no increase in the absorption coeicient for ilms deposited at 0.6 and 3.5 sccm, we can conclude that the increase of the absorption coeicient in the near-infrared part to the ilm deposited at 0.2 sccm is caused by the active states Ti3+in the ilm bulk.
All ilms were deposited with (101) and (200) preferred orientation. XRD spectra before and ater annealing do not show any diference between each other, which indicates crys-tallization during ilm deposition. he preferential anatase crystallization for TiO2thin ilms deposited by conventional magnetron sputtering has been discussed in a previous study [49]. he other difraction peaks are associated with the substrate. In overall, a decrease in the difraction peak of the anatase phase is observed as more nitrogen is incorporated in the ilm lattice. his efect has been also reported by our group in a previous publication [50]. Other studies observed similar results [28,51]. According to Muscat and coauthors [52], the excessive nitrogen incorporation elevates the density of the TiO2matrix by their volume, which may act as a driving force of the structural phase transformations. Other papers [26, 53, 54] reported that nitrogen acts as a crystallization inhibitor once nitrogen incorporated in the TiO2lattice decreases the mobility of Ti and O atoms, and,as a consequence, the nucleation of crystalline phases is reduced.
hey claim that this efect is caused by the larger ionic radius of N as compared with O.
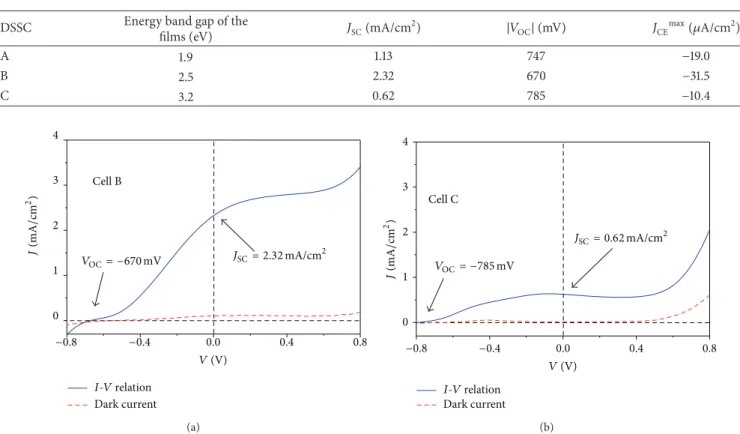
he efect of nitrogen doping on the working principle of solar cells was evaluated from current-voltage relations measured under illuminated and dark conditions. For con-venience, cells built with ilms deposited at 0.2, 0.6 and 3.5 sccm will be called cells A, B, and C, respectively. Cells parameters like the short-circuit current density (�SC), open-circuit voltage (�OC), and maximum dark current (�CE
max
Table 2: Short-circuit current density, open-circuit voltage, and maximum dark current for cells A, B, and C. he maximum dark current
was taken for each respective�OC.
DSSC Energy band gap of the
ilms (eV) �SC(mA/cm
2) |�
OC|(mV) �CE
max
(�A/cm2)
A 1.9 1.13 747 −19.0
B 2.5 2.32 670 −31.5
C 3.2 0.62 785 −10.4
J(
mA
/
cm
2) 4
3
2
1
0
−0.8 −0.4
Cell B
Dark current
V(V)
0.0 0.4 0.8
I-Vrelation
JSC= 2.32mA/cm2 VOC= −670mV
(a)
4
3
2
1
0
Cell C
Dark current
V(V)
−0.8 −0.4 0.0 0.4 0.8
I-Vrelation
JSC= 0.62mA/cm2
J(
mA
/
cm
2)
VOC= −785mV
(b)
Figure 9: Current-voltage relations for cells B (with nitrogen-doped anatase TiO2) and C (with undoped anatase TiO2) under illuminated
and dark conditions.
electron acceptor states, thus increasing the series resistance and decreasing the real cell performance. Anyway, �SC for both cells A and B is higher than that obtained with cell C. his result enhances the importance of nitrogen incorpora-tion in the ilm lattice.
Besides the active states Ti3+, interstitial nitrogen can also act as an electron acceptor state [9,10]. However, some studies claim that these states can also act as an electron generator state [55]. he appearance of interstitial nitrogen was conirmed by XPS and its concentration decreases as the ilm surface is oxidized, which indicates that ilms of the cells A and B have higher concentration of interstitial nitrogen than ilm used in cell C. As consequence, these trap states (oxygen deiciency and interstitial nitrogen) contribute to decreasing the open-circuit voltage due to lowering in the charge separation process. In addition, ater nitrogen incorporation, the semiconductor-dye-electrolyte interface may have been compromised. his question was investigated by dark current measurements as follows.
Dark current is an important parameter used to evalu-ate the electron recombination in the semiconductor-dye-electrolyte interface between photoinjected electrons in the (nitrogen-doped) TiO2conduction band and triiodide ions (I3−). Observe that negative values for current measured under dark illumination may suggest that the ilm surface was not entirely covered by dye, thus exposing the semiconductor surface to the electrolyte solution and facilitating the back
reaction. According to experimental setup, the color of the working electrodes was light purple, which suggests a poor adsorption of the dye molecules. he results show that the dark current was increased ater nitrogen incorporation; see Table 2. his indicates that despite the fact that nitrogen increases the overall cell photocurrent, it also increases the back reaction, thereby contributing to decreasing the open-circuit voltage. Similar behavior was observed in [10]. To clarify the efect of nitrogen incorporation on the current-voltage relations of the solar cells, see Figure9.
Some studies conducted elsewhere [56,57] show that the conduction band edge of the TiO2(�CB) is shited towards negative values ater nitrogen incorporation. Since the open-circuit voltage is given by�OC=�CB− �redoxone can expect an increase in the �OC ater nitrogen incorporation since the redox potential (�redox) remains unaltered. However, the opposite case was observed in this paper. his result indicates that the solid-liquid interface of the cells, produced in the present paper, was compromised not only by the nitrogen incorporation, but also by the poor adsorption of the dye molecules that increased the back reaction and reduced the open-circuit voltage.
Deep valleys between grain
boundaries
500.00nm 1.00 × 1.00 𝜇m
(a)
Coalescence between grain
boundaries
500.00nm 1.00 × 1.00 𝜇m
(b)
Figure 10: AFM images (1�m×1�m) for ilms deposited at (a) 0.6 and (b) 3.5 sccm.
454 456 458 460
Binding energy (eV)
In
ten
si
ty (a.u
.)
Ti3+
Film deposited at
0.2sccm
0.6sccm
3.5sccm
(a)
Binding energy (eV)
In
ten
si
ty (a.u
.)
528 530 532 534 536
OH
Film deposited at
0.2sccm
0.6sccm
3.5sccm
(b)
Figure 11: XPS spectra for (a) Ti2p3/2and (b) O1s core levels of the ilms deposited at (a) 0.2, (b) 0.6, and (c) 3.5 sccm.
of the ilms deposited at 0.6 and 3.5 sccm was evaluated from AFM analysis. Images (1�m × 1�m) are shown in Figure10. he results show that ilm deposited at 0.6 sccm has an efective surface area higher (1.75�m2) than that deposited at 3.5 sccm (1.46�m2). We attribute this surface modiication to the fact of nitrogen decreasing the mobility of Ti and O, thereby decreasing the difusion process, creating deep valleys between grain boundaries and, as consequence, increasing the efective surface area. his mechanism is in agreement with that suggested in XRD analysis. At high O2 low rates, Ti and O difuse easier, thus increasing the coalescence between grain boundaries and decreasing the efective surface area. See Figure10(b).
Another important observation is described by the higher open-circuit voltage achieved for cell A in comparison to cell
B. In fact, the opposite case would be expected once ilm used in cell A is amorphous. However, in Table 2one can see that �CE
max
for cell A is lower than that obtained for cell B, which may explain the higher �OC attained for cell A. his result suggests that the response for this question is given by physical efects happening on ilm surface and not into the bulk. In order to investigate this controversial result, XPS analysis was conducted. Figures11(a)and 11(b)
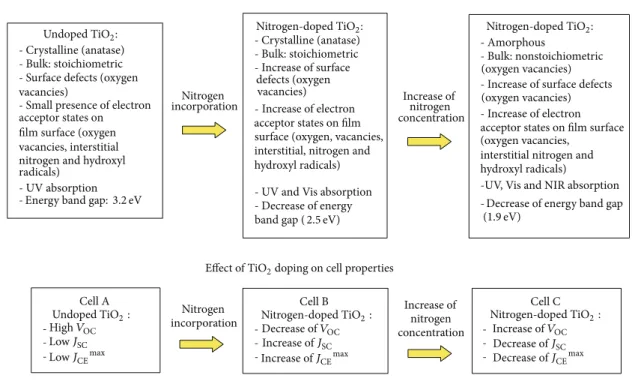
- Crystalline (anatase) - Bulk: stoichiometric - Surface defects (oxygen vacancies)
- Small presence of electron acceptor states on ilm surface (oxygen vacancies, interstitial nitrogen and hydroxyl radicals)
- UV absorption
- Crystalline (anatase) - Bulk: stoichiometric
-surface (oxygen, vacancies, interstitial, nitrogen and hydroxyl radicals)
- UV and Vis absorption - Decrease of energy
-- Amorphous
- Bulk: nonstoichiometric (oxygen vacancies) - Increase of surface defects
- Increase of electron acceptor states on ilm surface (oxygen vacancies,
interstitial nitrogen and hydroxyl radicals)
-UV, Vis and NIR absorption
-incorporation Increase of nitrogen
concentration
Cell A
-Cell B
-Cell C Nitrogen
incorporation
Increase of nitrogen concentration
Undoped TiO2:
Energy band gap:3.2eV
Nitrogen
Increase of surface
defects (oxygen vacancies)
Increase of electron
acceptor states on ilm
band gap (2.5eV)
Nitrogen-doped TiO2: Nitrogen-doped TiO2:
(oxygen vacancies)
Decrease of energy band gap
(1.9eV)
-Effect of nitrogen incorporation on TiO2properties
Effect of TiO2doping on cell properties
Decrease ofJSC
Decrease ofJCEmax
Undoped TiO2: Nitrogen-doped TiO2: Nitrogen-doped TiO2:
Increase ofJSC
Increase ofJCEmax
Decrease ofVOC
LowJSC
LowJCEmax
Increase ofVOC
HighVOC
Figure 12: General properties of TiO2and DSSCs at diferent doping levels of nitrogen.
with photoelectrons, also increases the presence of hydroxyl radicals adsorbed on the ilm surface ; see Figure11(b). he adsorbed OH radicals come from the dissociative adsorption of the water molecules caused by positive holes let by oxygen vacancies on its surface (H2O(ads) + h+VB → OH(ads) + H+(ads)). In the cases that the holes are created in the ilm bulk, they quickly difuse to the ilm surface in a subsecond regime. During cell operation, water appearance on the TiO2 surface might have been originated from the liquid electrolyte or solution used to dissolve the dye molecules. According to Liu and coauthors [4] the hydroxyl radicals act as a potential barrier for photoelectrons in the solid-liquid interface, thus avoiding the back reaction by blocking the reactions between these electrons and the I3−ions. Other studies found similar results [59,60].
he dye molecules are mainly responsible for electric charge generation in conventional dye-sensitized solar cells , so the undoped semiconductor, in this case, is responsible only for charge transport. On the other hand, the charge generation for cells built with nitrogen-doped TiO2is caused by both dye molecules and the ilm semiconductor. For the irst case, the overall electrical current produced in the solar cell is generated only by majority charge carriers. For the second one, it is generated by majority and minority charge carriers. he minority charge transport, for cells with doped ilms, is produced by nitrogen states in the semiconductor and the production of majority carriers remains with the dye molecules. However, if the cell built with nitrogen-doped anatase TiO2 generates minority charge transport in the ilm bulk, why does this cell has achieved the higher
photocurrent? To obtain this result, the electron generation rate, in the ilm structure, must be higher than the trapping rate. However, ater absorption of solar irradiation each free electron injected in the conduction band of the ilm generates one positive hole in the valance band, thus creating an electron acceptor state and compensating the total charge production. hus, this mechanism, in fact, does not explain exactly the increase of the cell photocurrent. However, in the studies conducted by Livraghi and coauthors [61], it was proposed the formation of charged diamagnetic N− states from reoxidation of the active states Ti3+(N∙+ Ti3+ → N−+ Ti4+). hese N-induced states (N−) are higher in energy than that of corresponding N species due to the greater Coulomb repulsion [62, 63]. According to the theory proposed by Livraghi, the formation of these doubly charged states is more favorable with the increase of Ti3+ [61,63]. hey also claim that the formation of these electronic states is the key factor for the improvement in the visible light activity of nitrogen-doped TiO2 [63]. Napoli and coauthors [64] observed similar mechanism for incorporation of nitrogen species into suboxides by plasma processing. hus, not only the incorporation of nitrogen states in the ilm lattice, but also the controlled presence of Ti3+ is a very important factor to the improvement of the DSSCs. To clarify all aspects caused by the nitrogen incorporation, a summary chart showing the evolution of the general properties of the ilms and cells, as the nitrogen concentration increases, is shown in Figure12.
solar cells, in special, the cell photocurrent. However, as the production of cells with long-term stability and in large-scale is aimed, problems in the electronic structure of TiO2, caused by nitrogen incorporation must be roughly improved, mainly those that contribute to decreasing the open-circuit voltage. Plasma surface treatment with oxygen, for example, has achieved eicient results in decreasing the oxygen vacancies on TiO2surface and improving the overall cell performance [6].
4. Conclusions
In this paper, nitrogen-doped TiO2 thin ilms deposited at diferent doping levels by DC reactive sputtering were used for fabrication of dye-sensitized solar cells. he efect of nitrogen incorporation on the general properties of the ilms, as well as, its efect on the working principle of the solar cells was investigated. he results indicate that the substitutional nitrogen is incorporated into TiO2 structure from reaction with suboxides created by oxidation of the nitride layers so that the control of the reactive gas mixture, during ilm deposition, plays a fundamental role to achieve high doping levels. he incorporation of nitrogen particles in the ilm lattice shits eiciently the absorption coeicient of the ilms toward the visible and near-infrared regions. However, excessive nitrogen incorporation becomes the ilm amorphous and leads to the appearance of excessive electron acceptor states like oxygen vacancies, interstitial nitrogen, and hydroxyl radicals. Characterization of the cells shows that nitrogen incorporated in the ilm structure increases the short-circuit current density due to the photoexcitation of nitrogen states in the visible part of solar spectrum. On other hand, it decreases the open-circuit voltage and increases the dark current due to the combination of several parallel efects. Among them the main ones are the increase of the electron acceptor states and the surface area of the doped ilms. his latter efect increases the contact area in the solid-liquid interface and, as consequence, the back reaction in the regions in which the dye molecules were not chemisorbed.
Conflict of Interests
he authors declare that there is no conlict of interest in this paper.
Acknowledgments
he authors thank FAPESP, CAPES, CNPq, and PRONEX (Grant no. 11/50773-0) for inancial support; the National Institute for Space Research (INPE) for proilometry mea-surements; the Laboratory of Optical Surface Measurements (LMSO) of the Institute for Advanced Studies (IEAv) for spectrophotometry measurements; the University of Vale do Paraiba (UNIVAP) for XRD measurements; and the Laboratory of Nanotechnology and Solar Energy (LNES) of the University of Campinas (UNICAMP) for cells characteri-zation. hey also would like to express their special thanks to Dr. Agnaldo de Souza Gonc¸alves from Tezca Res. & Dev. Solar
Cells Ltd. and Dr. F´abio Dondeo Origo from LMSO-IEAv for their helpful contributions.
References
[1] B. O’Regan and M. Graetzel, “A low-cost, high-eiciency solar
cell based on dye-sensitized colloidal TiO2ilms,”Nature, vol.
353, pp. 737–740, 1991.
[2] C. G. Granqvist, “Transparent conductors as solar energy
materials: a panoramic review,”Solar Energy Materials and Solar
Cells, vol. 91, no. 17, pp. 1529–1598, 2007.
[3] M. Graetzel, “Dye-sensitized solar cells,”Journal of
Photochem-istry and Photobiology C, vol. 4, no. 2, pp. 145–153, 2003. [4] Y. Liu, A. Hagfeldt, X. Xiao, and S. Lindquist, “Investigation of
inluence of redox species on the interfacial energetics of a
dye-sensitized nanoporous TiO2solar cell,”Solar Energy Materials
and Solar Cells, vol. 55, no. 3, pp. 267–281, 1998.
[5] S. I. Cha, Y. Kim, K. H. Hwang, Y. Shin, S. H. Seo, and D. Y. Lee, “Dye-sensitized solar cells on glass paper: TCO-free highly bendable dye-sensitized solar cells inspired by the traditional
Korean door structure,”Energy and Environmental Science, vol.
5, no. 3, pp. 6071–6075, 2012.
[6] Y. Kim, B. J. Yoo, R. Vittal, Y. Lee, N. G. Park, and K. J. Kim,
“Low-temperature oxygen plasma treatment of TiO2 ilm for
enhanced performance of dye-sensitized solar cells,”Journal of
Power Sources, vol. 175, no. 2, pp. 914–919, 2008.
[7] A. Mathew, G. M. Rao, and N. Munichandraiah, “Efect of TiO2
electrode thickness on photovoltaic properties of dye sensitized solar cell based on randomly oriented Titania nanotubes,” Materials Chemistry and Physics, vol. 127, no. 1-2, pp. 95–101, 2011.
[8] Y. Yu, K. Wu, and D. Wang, “Dye-sensitized solar cells with
modiied TiO2surface chemical states: the role of Ti3+,”Applied
Physics Letters, vol. 99, no. 19, Article ID 192104, 2011.
[9] R. Asahi, T. Morikawa, T. Ohwaki, K. Aoki, and Y. Taga, “Visible-light photocatalysis in nitrogen-doped titanium
oxides,”Science, vol. 293, no. 5528, pp. 269–271, 2001.
[10] S. H. Kang, H. S. Kim, J. Y. Kim, and Y. E. Sung, “Enhanced
photocurrent of nitrogen-doped TiO2 ilm for dye-sensitized
solar cells,”Materials Chemistry and Physics, vol. 124, no. 1, pp.
422–426, 2010.
[11] T. Ma, M. Akiyama, E. Abe, and I. Imai, “High-eiciency dye-sensitized solar cell based on a nitrogen-doped nanostructured
titania electrode,”Nano Letters, vol. 5, no. 12, pp. 2543–2547,
2005.
[12] T. Lindgren, J. M. Mwabora, E. Avenda˜no et al., “Photoelec-trochemical and optical properties of nitrogen doped titanium dioxide ilms prepared by reactive DC magnetron sputtering,” Journal of Physical Chemistry B, vol. 107, no. 24, pp. 5709–5716, 2003.
[13] S. Hashimoto, A. Tanaka, A. Murata, and T. Sakurada, “Formu-lation for XPS spectral change of oxides by ion bombardment
as a function of sputtering time,”Surface Science, vol. 556, no. 1,
pp. 22–32, 2004.
[14] N. C. Saha and H. G. Tompkins, “Titanium nitride oxidation
chemistry: an X-ray photoelectron spectroscopy study,”Journal
of Applied Physics, vol. 72, no. 7, p. 3072, 1992.
[15] G. He, L. D. Zhang, G. H. Li, M. Liu, and X. J. Wang, “Structure, composition and evolution of dispersive optical constants of
sputtered TiO2thin ilms: efects of nitrogen doping,”Journal
[16] X. Jiang, Y. Wang, and C. Pan, “High concentration
sub-stitutional N-doped TiO2 ilm: preparation, characterization,
and photocatalytic property,”Journal of the American Ceramic
Society, vol. 94, no. 11, pp. 4078–4083, 2011.
[17] S. Sato, R. Nakamura, and S. Abe, “Visible-light sensitization
of TiO2 photocatalysts by wet-method N doping,” Applied
Catalysis A, vol. 284, no. 1-2, pp. 131–137, 2005.
[18] H. Irie, Y. Watanabe, and K. Hashimoto,
“Nitrogen-concen-tration dependence on photocatalytic activity of TiO2−�N�
powders,”Journal of Physical Chemistry B, vol. 107, no. 23, pp.
5483–5486, 2003.
[19] H. Li, J. Li, and Y. Huo, “Highly active TiO2N photocatalysts
prepared by treating TiO2 precursors in NH3/ethanol luid
under supercritical conditions,”Journal of Physical Chemistry B,
vol. 110, no. 4, pp. 1559–1565, 2006.
[20] N. Kometani, A. Fujita, and Y. Yonezawa, “Synthesis of N-doped
titanium oxide by hydrothermal treatment,”Journal of Materials
Science, vol. 43, no. 7, pp. 2492–2498, 2008.
[21] S. Hu, A. Wang, X. Li, and H. Lowe, “Hydrothermal synthesis
of well-dispersed ultraine N-doped TiO2 nanoparticles with
enhanced photocatalytic activity under visible light,”Journal of
Physics and Chemistry of Solids, vol. 71, no. 3, pp. 156–162, 2010. [22] Z. Jiang, F. Yang, N. Luo et al., “Solvothermal synthesis of
N-doped TiO2nanotubes for visible-light-responsive
photocatal-ysis,”Chemical Communications, no. 47, pp. 6372–6374, 2008.
[23] L. Zhu, J. Xie, X. Cui, J. Shen, X. Yang, and Z. Zhang,
“Photoelectrochemical and optical properties of N-doped TiO2
thin ilms prepared by oxidation of sputtered TiN� ilms,”
Vacuum, vol. 84, no. 6, pp. 797–802, 2010.
[24] L. Wan, J. F. Li, J. Y. Feng, W. Sun, and Z. Q. Mao, “Anatase TiO2
ilms with 2.2 eV band gap prepared by micro-arc oxidation,” Materials Science and Engineering B, vol. 139, no. 2-3, pp. 216– 220, 2007.
[25] V. Stranak, M. Quaas, R. Bogdanowicz et al., “Efect of nitrogen
doping on TiO�N�thin ilm formation at reactive high-power
pulsed magnetron sputtering,”Journal of Physics D, vol. 43, no.
28, Article ID 285203, 2010.
[26] S. H. Mohamed, O. Kappertz, J. M. Ngaruiya et al., “Inluence of nitrogen content on properties of direct current sputtered
TiO�N�ilms,”Physica Status Solidi A, vol. 201, no. 1, pp. 90–
102, 2004.
[27] J. M. Ngaruiya, O. Kappertz, C. Liesch, P. M¨uller, R. Dron-skowski, and M. Wuttig, “Composition and formation mecha-nism of zirconium oxynitride ilms produced by reactive direct
current magnetron sputtering,”Physica Status Solidi A, vol. 201,
no. 5, pp. 967–976, 2004.
[28] D. Herman, J. Sicha, and J. Musil, “Magnetron sputtering of
TiO�N�ilms,”Vacuum, vol. 81, no. 3, pp. 285–290, 2006.
[29] J.-M. Chapp´e, N. Martin, J. Lintymer, F. Sthal, G. Terwagne, and J. Takadoum, “Titanium oxynitride thin ilms sputter deposited
by the reactive gas pulsing process,”Applied Surface Science, vol.
253, no. 12, pp. 5312–5316, 2007.
[30] J.-M. Chapp´e, N. Martin, J. F. Pierson et al., “Inluence of sub-strate temperature on titanium oxynitride thin ilms prepared
by reactive sputtering,”Applied Surface Science, vol. 225, no. 1–
4, pp. 29–38, 2004.
[31] S. Berg and T. Nyberg, “Fundamental understanding and
modeling of reactive sputtering processes,”hin Solid Films, vol.
476, no. 2, pp. 215–230, 2005.
[32] D. A. Duarte, J. C. Sag´as, A. S. da Silva Sobrinho, and M. Massi,
“Modeling the reactive sputter deposition of N-doped TiO2for
application in dye-sensitized solar cells: efect of the O2low rate
on the substitutional N concentration,”Applied Surface Science,
vol. 269, pp. 55–59, 2013.
[33] Y. S. Park and H. K. Kim, “he efects of annealing temperature on the characteristics of carbon counter electrodes for
dye-sensitized solar cells,”Current Applied Physics, vol. 11, no. 4, pp.
989–994, 2011.
[34] S. R. Kim and K. M. Parvez, “Oxygen ion-beam irradiation
of TiO2 ilms reduces oxygen vacancies and improves
per-formance of dye-sensitized solar cells,” Journal of Materials
Research, vol. 26, no. 8, pp. 1012–1017, 2011.
[35] M. C. Marchi, S. A. Bilmes, C. T. M. Ribeiro, E. A. Ochoa, M. Kleinke, and F. Alvarez, “A comprehensive study of the inluence
of the stoichiometry on the physical properties of TiO� ilms
prepared by ion beam deposition,”Journal of Applied Physics,
vol. 108, no. 6, Article ID 064912, 2010.
[36] Z. Zhang, X. Wang, J. Long, Q. Gu, Z. Ding, and X. Fu, “Nitrogen-doped titanium dioxide visible light photocatalyst:
spectroscopic identiication of photoactive centers,”Journal of
Catalysis, vol. 276, no. 2, pp. 201–214, 2010.
[37] L. Zhu, J. Xie, X. Cui, J. Shen, X. Yang, and Z. Zhang,
“Photoelectrochemical and optical properties of N-doped TiO2
thin ilms prepared by oxidation of sputtered TiN� ilms,”
Vacuum, vol. 84, no. 6, pp. 797–802, 2010.
[38] T. L. Luke, A. Wolcott, L. P. Xu et al., “Nitrogen-doped and CdSe
quantum-dot-sensitized nanocrystalline TiO2 ilms for solar
energy conversion applications,”Journal of Physical Chemistry
C, vol. 112, no. 4, pp. 1282–1292, 2008.
[39] Y. Nosaka, M. Matsushita, J. Nishino, and A. Y. Nosaka, “Nitrogen-doped titanium dioxide photocatalysts for visible
response prepared by using organic compounds,”Science and
Technology of Advanced Materials, vol. 6, no. 2, p. 143, 2005. [40] X. Chen and C. Burda, “Photoelectron spectroscopic
inves-tigation of nitrogen-doped titania nanoparticles,” Journal of
Physical Chemistry B, vol. 108, no. 40, pp. 15446–15449, 2004. [41] F. Esaka, K. Furuya, H. Shimada et al., “Comparison of surface
oxidation of titanium nitride and chromium nitride ilms studied by X-ray absorption and photoelectron spectroscopy,” Journal of Vacuum Science and Technology A, vol. 15, no. 5, pp. 2521–2528, 1997.
[42] P. Simon, B. Pignon, B. Miao et al., “N-doped titanium monox-ide nanoparticles with TiO rock-salt structure, low energy band
gap, and visible light activity,”Chemistry of Materials, vol. 22, no.
12, pp. 3704–3711, 2010.
[43] X. Chen, Y. Lou, A. C. S. Samia, C. Burda, and J. L. Gole, “Formation of oxynitride as the photocatalytic enhancing site in nitrogen-doped Titania nanocatalysts: comparison to a
commercial nanopowder,”Advanced Functional Materials, vol.
15, no. 1, pp. 41–49, 2005.
[44] N. Martin, R. Sanjin´es, J. Takadoum, and F. L´evy, “Enhanced sputtering of titanium oxide, nitride and oxynitride thin ilms
by the reactive gas pulsing technique,”Surface and Coatings
Technology, vol. 142–144, pp. 615–620, 2001.
[45] T. S. Moss, “A relationship between the refractive index and the infra-red threshold of sensitivity for photoconductors,” Proceedings of the Physical Society B, vol. 63, no. 3, p. 167, 1950.
[46] A. Fujishima, X. Zhang, and D. A. Tryk, “TiO2photocatalysis
and related surface phenomena,”Surface Science Reports, vol.
63, no. 12, pp. 515–582, 2008.
TiO2photocatalyst with visible light activity for NO removal,” Journal of Molecular Catalysis A, vol. 161, no. 1-2, pp. 205–212, 2000.
[48] T. Lindgren, J. Lu, A. Hoel, C. G. Granqvist, G. R. Torres, and S. E. Lindquist, “Photoelectrochemical study of sputtered nitrogen-doped titanium dioxide thin ilms in aqueous
elec-trolyte,”Solar Energy Materials and Solar Cells, vol. 84, no. 1–4,
pp. 145–157, 2004.
[49] D. A. Duarte, M. Massi, and A. S. da Silva Sobrinho, “Com-parison between conventional and hollow cathode magnetron sputtering systems on the growing of titanium dioxide thin ilms: a correlation between the gas discharge and ilm
forma-tion,”European Physical Journal—Applied Physics, vol. 54, no. 2,
Article ID 20801, 2011.
[50] D. R. Irala, H. S. Maciel, D. A. Duarte, M. Massi, and A. S. da Silva Sobrinho, “Inluence of the nitrogen concentration on the photoinduced hydrophilicity of N-doped titanium dioxide thin
ilms deposited by plasma sputtering,”ECS Transactions, vol. 31,
no. 1, pp. 109–115, 2010.
[51] K. Prabakar, T. Takahashi, T. Nezuka et al., “Visible light-active
nitrogen-doped TiO2 thin ilms prepared by DC magnetron
sputtering used as a photocatalyst,”Renewable Energy, vol. 33,
no. 2, pp. 277–281, 2008.
[52] J. Muscat, V. Swamy, and N. M. Harrison, “First-principles
investigations for YH3(YD3): energetics, electric-ield
gradi-ents, and optical properties,”Physical Review B, vol. 65, no. 22,
Article ID 224112, 9 pages, 2002.
[53] B. A. Nejand, S. Sanjabi, and V. Ahmadi, “Optical and
photocat-alytic characteristics of nitrogen doped TiO2thin ilm deposited
by magnetron sputtering,”Scientia Iranica, vol. 17, no. 2, pp. 102–
107, 2010.
[54] K. Hukari, R. Dannenberg, and E. A. Stach, “Nitrogen efects
on crystallization kinetics of amorphous TiO�N� thin ilms,”
Journal of Materials Research, vol. 17, no. 3, pp. 550–555, 2002. [55] C. Di Valentin, G. Pacchioni, A. Selloni, S. Livraghi, and E.
Giamello, “Characterization of paramagnetic species in
N-doped TiO2 powders by EPR spectroscopy and DFT
calcula-tions,”Journal of Physical Chemistry B, vol. 109, no. 23, pp. 11414–
11419, 2005.
[56] K. Yang, Y. Dai, and B. Huang, “Study of the Nitrogen
Con-centration Inluence on N-Doped TiO2 Anatase from
First-Principles Calculations,”Journal of Physical Chemistry C, vol.
111, no. 32, Article ID 12086, 2007.
[57] P. Xiang, X. Li, H. Wang et al., “Mesoporous nitrogen-doped
TiO2sphere applied for quasi-solid-state dye-sensitized solar
cell,”Nanoscale Research Letters, vol. 6, article 606, 2011.
[58] S. W. Park and J. E. Heo, “Characteristics of N-doped titanium oxide prepared by the large scaled DC reactive magnetron
sputtering technique,”Separation and Purification Technology,
vol. 58, no. 1, pp. 200–205, 2007.
[59] P. V. V. Jayaweera, P. K. D. D. P. Pitigala, M. K. I. Seneviratne, A. G. U. Perera, and K. Tennakone, “1/f noise in dye-sensitized
solar cells and NIR photon detectors,” Infrared Physics and
Technology, vol. 50, no. 2-3, pp. 270–273, 2007.
[60] Y.-S. Jung, B. Yoo, M. K. Lim, S. Y. Lee, and K.-J. Kim, “Efect of Triton X-100 in water-added electrolytes on the performance of
dye-sensitized solar cells,”Electrochimica Acta, vol. 54, no. 26,
pp. 6286–6291, 2009.
[61] S. Livraghi, M. C. Paganini, E. Giamello, A. Selloni, C. Di Valentin, and G. Pacchioni, “Origin of photoactivity of
nitro-gen-doped titanium dioxide under visible light,”Journal of the
American Chemical Society, vol. 128, no. 49, pp. 15666–15671, 2006.
[62] S. Hoang, S. P. Berglund, N. T. Hahn, A. J. Bard, and C. B. Mullins, “Enhancing visible light photo-oxidation of water
with TiO2nanowire arrays via cotreatment with H2and NH3:
synergistic efects between Ti3+and N,”Journal of the American
Chemical Society, vol. 134, no. 8, pp. 3659–3662, 2012.
[63] C. Di Valentin, E. Finazzi, G. Pacchioni et al., “Density func-tional theory and electron paramagnetic resonance study on the
efect of N-F codoping of TiO2,”Chemistry of Materials, vol. 20,
no. 11, pp. 3706–3714, 2008.
[64] F. Napoli, M. Chiesa, S. Livraghi et al., “he nitrogen photoac-tive centre in N-doped titanium dioxide formed via interaction of N atoms with the solid. Nature and energy level of the
species,”Chemical Physics Letters, vol. 477, no. 1–3, pp. 135–138,
Submit your manuscripts at
http://www.hindawi.com
Hindawi Publishing Corporation
http://www.hindawi.com Volume 2014
Inorganic Chemistry International Journal of
Hindawi Publishing Corporation
http://www.hindawi.com Volume 2014
Photoenergy
Hindawi Publishing Corporation
http://www.hindawi.com Volume 2014
Carbohydrate
Chemistry
International Journal of
Hindawi Publishing Corporation
http://www.hindawi.com Volume 2014
Journal of
Chemistry
Hindawi Publishing Corporation
http://www.hindawi.com Volume 2014
Physical Chemistry
Hindawi Publishing Corporation http://www.hindawi.com
Analytical Methods in Chemistry Journal of
Volume 2014
Bioinorganic Chemistry and Applications
Hindawi Publishing Corporation
http://www.hindawi.com Volume 2014
Spectroscopy
International Journal ofHindawi Publishing Corporation
http://www.hindawi.com Volume 2014
The Scientiic
World Journal
Hindawi Publishing Corporationhttp://www.hindawi.com Volume 2014 Medicinal Chemistry
Hindawi Publishing Corporation
http://www.hindawi.com Volume 2014
Chromatography Research International Hindawi Publishing Corporation
http://www.hindawi.com Volume 2014
Applied ChemistryJournal of
Hindawi Publishing Corporation
http://www.hindawi.com Volume 2014
Hindawi Publishing Corporation
http://www.hindawi.com Volume 2014
Theoretical Chemistry Journal of
Hindawi Publishing Corporation
http://www.hindawi.com Volume 2014
Journal of
Spectroscopy
Analytical Chemistry
Hindawi Publishing Corporation
http://www.hindawi.com Volume 2014
Journal of
Hindawi Publishing Corporation
http://www.hindawi.com Volume 2014
Quantum Chemistry
Hindawi Publishing Corporation
http://www.hindawi.com Volume 2014
International
Electrochemistry
International Journal ofHindawi Publishing Corporation
http://www.hindawi.com Volume 2014
Hindawi Publishing Corporation
http://www.hindawi.com Volume 2014
![Figure 6: Chemical composition of the ilms obtained by RBS as function of the oxygen low rate (reproduced from [32]).](https://thumb-eu.123doks.com/thumbv2/123dok_br/17567325.266037/6.900.84.430.100.400/figure-chemical-composition-ilms-obtained-function-oxygen-reproduced.webp)
![Figure 8: Energy band-gap (reproduced from [32]) and refractive index as function of the oxygen low rate and (b) absorption coeicient for ilms deposited at 0.2, 0.6, and 3.5 sccm as function of photon wavelength.](https://thumb-eu.123doks.com/thumbv2/123dok_br/17567325.266037/7.900.92.811.105.450/reproduced-refractive-function-absorption-coeicient-deposited-function-wavelength.webp)