Correlation of Alzheimer
’
s Disease Death
Rates with Historical Per Capita Personal
Income in the USA
Dariusz Stępkowski1*, Grażyna Woźniak1, Marcin Studnicki2
1Laboratory of Molecular Basis of Cell Motility, Nencki Institute of Experimental Biology, Warszawa, Poland,
2Department of Experimental Design and Bioinformatics, Warsaw University of Life Sciences-SGGW, Warszawa, Poland
*d.stepkowski@nencki.gov.pl
Abstract
Alzheimer’s disease (AD) is a progressive degenerating disease of complex etiology. A variety of risk factors contribute to the chance of developing AD. Lifestyle factors, such as physical, mental and social activity, education, and diet all affect the susceptibility to devel-oping AD. These factors are in turn related to the level of personal income. Lower income usually coincides with lower level of education, lesser mental, leisure—social and physical activity, and poorer diet. In the present paper, we have analyzed the correlation of historical (1929–2011) per capita personal income (PCPI) for all states of the USA with corresponding age-adjusted AD death rates (AADR) for years 2000, 2005 and 2008. We found negative correlations in all cases, the highest one (R-0.65) for the PCPIs in the year 1970 correlat-ed against the AADRs in 2005. From 1929 to 2005 the R value varies in an oscillatory man-ner, with the strongest correlations in 1929, 1970, 1990 and the weakest in 1950, 1980, 1998. Further analysis indicated that this oscillatory behavior of R is not artificially related to the economic factors but rather to delayed biological consequences associated with per-sonal income. We conclude that the influence of the income level on the AD mortality in 2005 was the highest in the early years of life of the AD victims. Overall, the income had a significant, lifelong, albeit constantly decreasing, influence on the risk of developing AD. We postulate that the susceptibility of a population to late-onset AD (LOAD) is determined to a large extent by the history of income-related modifiable lifestyle risk factors. Among these risk factors, inappropriate diet has a significant contribution.
Introduction
The prevalence of Alzheimer’s disease (AD) is steadily increasing worldwide, including the USA [1,2,3]. The reasons for such a profound increase in the number of AD cases are unclear. In order to elucidate the causes of this increase, risk factors present in the history of a popula-tion should be considered. Among known factors increasing the risk of developing Alzheimer’s disease the most important one is the aging of the population [4,5]. Alzheimer’s disease is
OPEN ACCESS
Citation:Stępkowski D, Woźniak G, Studnicki M
(2015) Correlation of Alzheimer’s Disease Death Rates with Historical Per Capita Personal Income in the USA. PLoS ONE 10(5): e0126139. doi:10.1371/ journal.pone.0126139
Academic Editor:Hemachandra Reddy, Texas Tech University Health Science Centers, UNITED STATES
Received:January 19, 2015
Accepted:March 29, 2015
Published:May 11, 2015
Copyright:© 2015 Stępkowski et al. This is an open
access article distributed under the terms of the
Creative Commons Attribution License, which permits unrestricted use, distribution, and reproduction in any medium, provided the original author and source are credited.
Data Availability Statement:All relevant data are within the paper and its Supporting Information files.
Funding:The authors have no support or funding to report.
therefore most probably related to the aging processes on the cellular and organismal level. Other pathologies prevalent in the population that increase the risk of dementia including AD are diabetes [6,7], hypertension [8], high level of cholesterol and other factors related to vascu-lar health [8,9], strokes [10], midlife obesity [11], bad diet [12,13,14,15], depression [16], head injuries [17], and exposure to toxins [18]. Smoking [19], lower socioeconomic status [20,21], physical inactivity [22,23,24], low level of education of patients and their parents [20,25,26], mental inactivity [22,24] and lack of social engagement [27] also contribute to the risk of devel-oping dementia and AD. The strength of evidence and the relevance to the susceptibility to AD of some of these risk factors is discussed in [28]. Some authors point to early-life events as the most important ones for shaping the future susceptibility of an individual to AD [29]. Some of the risk factors listed are interrelated and this makes historical analysis of their influence on the population extremely difficult. However, many of them can be grouped together as lifestyle fac-tors significantly related to the economic status. It is possible to track per capita personal in-come (PCPI) data for the population of the United States of America, from before the Great Depression of the 1930s when the majority of present Alzheimer’s patients were born. To check if, and how, the PCPI, presumably by affecting the lifestyle, has an influence on the AD mortality, we studied the correlation of PCPI for each state of the USA, starting from the year 1929, just before the Great Depression, through the year 2011, with age-adjusted AD death rates (AADRs) for those states in 2000, 2005 and 2008.. We found a significant negative corre-lation of PCPI with AADRs for all the years studied. Despite the presence of many potential confounders such as migration between states, historical lifestyle differences between the states, differences in climate, rural to urban population ratios, different stratification of personal in-come etc., PCPI seems to be a convenient parameter discriminating between healthier and less healthy lifestyles.
Methods
The PCPI data for each state for years 1929–2011 were taken from the FRED St. Louis data base (http://research.stlouisfed.org/series) and compiled into an Excel worksheet (available in S1 File). For each year, linear regression was performed with AADRs for years: 2000, 2005 and 2008 using Origin 7.5 software (AADRs were taken from National Vital Statistics Reports, Deaths final data for 1998–2010). For all three sets of data on AADR, the highest correlation was obtained with PCPI for the year 1970. Regressions were done using PCPI for each state normalized to PCPI in 2011 using the following formula: PCPI in a given yearFn where
Consumer Price Index for urban consumers prepared by the U.S. Department of Labor, Bureau of Labor Statistic. Pearson’s coefficient R was chosen as the measure of the strength of correla-tion over R2since it differentiates between negative and positive correlation and offers higher sensitivity (due to the wider range of variability (-1,1) than that of R2(0,1)). Additionally, un-like R2, R changes linearly with the change in data values therefore, R is more suitable for use to relate the variability of R with the susceptibility of population to AD.
Statistical methods
A crucial question about the statistical significance of the oscillatory nature of R variability and the trend lines (for the correlations between PCPI and age-adjusted AD death rates (AADRs) in 2000, 2005,2008) was addressed by dividing the studied period into seven segments (sea-sons). These segments correspond to periods between the peaks of consecutive highest and lowest correlations (extremes). The first segment spans the period between 1929 and 1936, the second from 1937 to 1950, the third from 1951 to 1969, the fourth from 1970 to 1980, the fifth from 1981 to 1991, the sixth from 1992 to 2002 and the seventh the period from 2003 to 2011. For each period the Mann-Kendall test and value of tau correlation were calculated. These tests were used to statistically assess the monotonicity of upward or downward trends of R variabili-ty in time. The results of these tests are presented in Supporting Information 2. Furthermore, the 95% confidence interval from polynomial regressions (degree 16) was used to determine the statistical significance of the differences between the extreme (minima and maxima) values of the regression curve. The polynomial regressions for AADR in 2000, 2005 and 2008 were performed using the R 3.1.2 software with lm function. The 95% confidence intervals are pre-sented as the upper and lower confidence borders for the designated polynomial functions and were based on Student's t distribution. The pattern of division of the total studied period and the validity of extremes of the regression curve were confirmed by differential analysis. Differ-ential analysis was performed by subtraction of the R value for a given year from the R value of the preceding year. These differentials were plotted against time and regressed by polynomial regression procedure similarly as for correlations between PCPI and AADR. The first deriva-tive function obtained in this way zeroed in most cases of the extreme values of the original curve, confirming both the validity of segmental division and of the extreme points of the origi-nal correlations (minima and maxima).
Rationale
for 1998–2010). We used age-adjusted data to compensate for the different age structure in the populations of the US states. These data exclude deaths from other primary causes but with co-existing AD (a discussion of this problem can be found in a recent report of the Alzheimer’s Association [5]). We assumed that the proportion between AD deaths as primary cause and deaths from other diseases with coexisting AD was constant in the studied period. Therefore, underrepresentation of AD in death certificates does not influence conclusions from our stud-ies. One possible bias of our analysis can be caused by the increased life span during the period studied (from 76.7 in 1998 to 77.4 in 2005—National Vital Statistics Reports. Deaths final data for 1998–2010) which could increase the proportion of deaths due to AD as the primary cause in relation to other deaths. However, since the life expectancy change was only minor, the effect of the increase in the life span on the AADRs should also be negligible. Other possible sources of bias and their relation to the quality of our analysis are presented in the Discussion.
Results
Negative correlation of PCPI with age-adjusted death rates
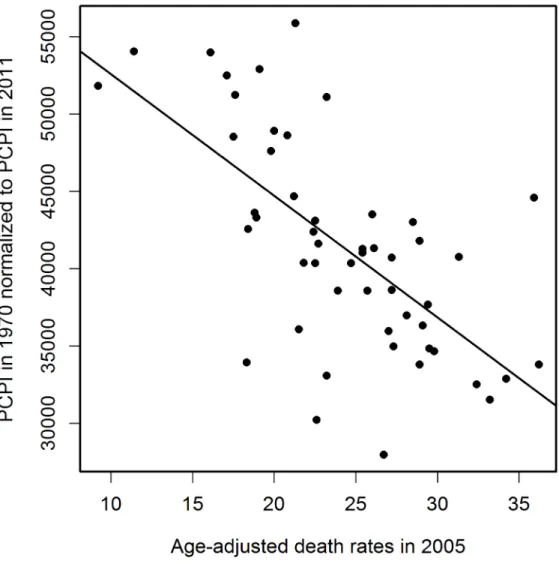
in 2005 is plotted inFig 4. The relation between PCPIs and AADRs (2005) is steepest in the early years of the period analyzed, and the same is true for the 2000 and 2008 AADRs (data not shown). This means that in the early period of life of a potential AD victim a deeper decrease of PCPI was needed to cause one more fatality per 100 000 population in 2005 (as well as in 2000 and 2008), than later in life. We interpret this as the higher ability of a young organism to resist the negative influence of the risk factors related to lower income. On the other hand, the corre-lation of AADR with income level is stronger in the early periods of life (seeFig 3A, regression curve and trend line), which can be interpreted as a higher importance of the economic status in the early years of life for the late-life health than the status in the midlife and later in life. The observation that the correlation of PCPI with AD death rates changes in time in a statisti-cally significant oscillatory manner prompted us to examine whether this unexpected behavior is a consequence of the oscillations of economic factors or rather is due to long term— presum-ably biological—consequences mainly related to modifiable risk factors associated with the past income. To answer this question we recalculated the slope data dividing them by a factor Fr = (state PCPI highest in a given year) / (state PCPI lowest in a given year). This procedure Fig 1. Negative correlation of PCPI in 1970 (in 51 states of the USA) with age-adjusted AD death rates (AADRs) for the respective states in 2005.Death rates are represented by the number of cases per 100 000 population adjusted for age distribution.
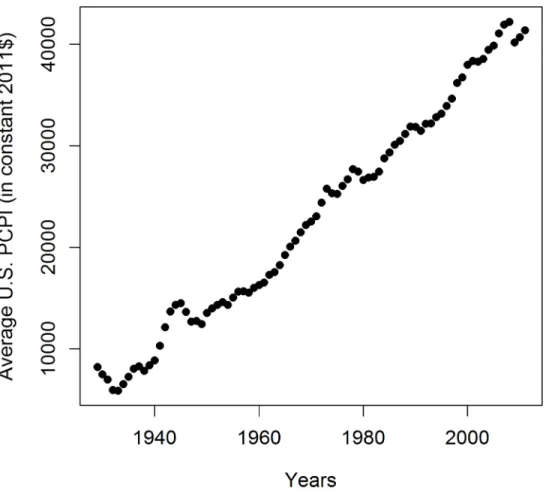
cancels out the different year by year stratification of PCPIs between the richest and poorest states. InFig 5these corrected slope data (relative slope, regressed as inFig 3) are plotted against time with corresponding 95% confidence intervals, again giving an oscillatory appear-ance, which indicates that we are dealing here with true long term biological effects related to the level of past income rather than with chance oscillatory changes of correlations due to eco-nomic fluctuations. This oscillatory character of R variability cannot be explained by oscilla-tions of the average US PCPI in constant dollars either (seeFig 6).
Discussion
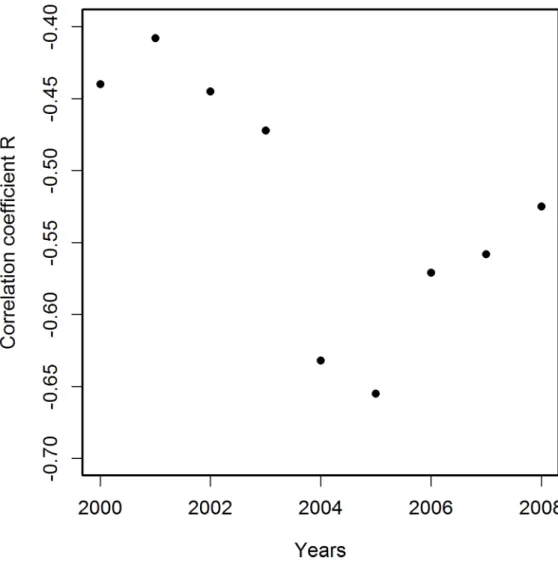
Crucial to the evaluation of the quality of the presented results is their potential susceptibility to many possible sources of bias such as, for example, migration of patients between states. Such migration has been estimated to be rather high [31]. However, our results, showing a strong correlation of PCPI with AADRs, suggest only a limited significance of this level of mi-gration. Other possible limitations of using local death rates for analysis of geographical Fig 2. Correlation coefficients R for correlations of PCPI in 1970 (in 51 states of the USA) with age-adjusted AD death rates (AADRs) in the respective states in the period 2000–2008.The best correlation
is observed for deaths data for 2005. Death rates are represented by the number of cases per 100 000 population adjusted for age distribution.
distribution of a disease impact have been discussed by Glymour et al. [31]. Those authors con-sidered them as insignificant. Factors unrelated to personal income such as differences in cli-mate, rural to urban population ratio, stratification of personal income in the population, or average educational attainment or overestimation of death rates due to higher awareness of AD Fig 3. Variability in time of correlation coefficients R for correlations of PCPI (in 49 or 51 states of the USA) with age-adjusted AD death rates (AADRs) for the respective states in 2005.For years 1929–1949 PCPI data were available for 49 states. For years 1950–2011 PCPI data were available for 51 states. Solid line represents the regression curve obtained from polynomial (16thdegree) regression with 95% confidence intervals marked by dashed lines.
impact on society can also, due to the same reasons as in the case of migration, be considered of limited significance.
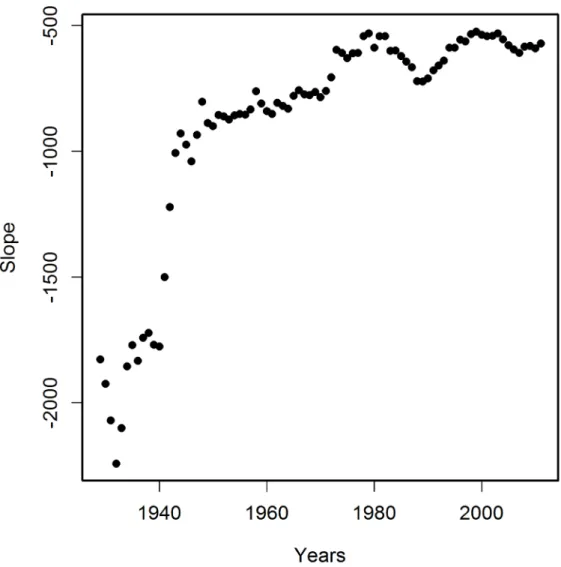
The variability of the correlations of PCPI between 1929 and 2005 and the death rates is rather smooth despite the fairly narrow time window of the income data used (one-year state average PCPIs). This indicates that the observed oscillatory character of R changes over time reflects gradual processes which occur in a time span longer than one year. Figs3–6indicate that the most plausible interpretation of this phenomenon is a significant influence of lifestyle-related events which occurred in the past rather than temporal economic fluctuations. Among the possible biological factors influencing this correlation, infectious diseases affecting large segments of the population in the past and historical changes in the lifestyle, among them diet, are most likely. Diet, unlike infections, is one of the factors related significantly to the income level and affects statistically the majority of a population. Our studies point to the fact that his-torical diet changes had a profound influence on the susceptibility of the population to AD. This is not a new observation since the influence of diet on the risk of developing AD is well documented [12,13,14,15]. Our analysis, however, offers some advantages over those earlier Fig 4. Variability in time of the slope of correlations of PCPI for each state with age-adjusted AD death rates (AADRs) for the respective states in 2005.Numbers of states as in legend toFig 3.
studies because, we use whole population data and thus we avoid the problem of selection and recall errors which may bias some of the epidemiological studies.
The mechanism by which life style influences the susceptibility to LOAD most probably re-lies on epigenetic changes caused by certain diet components and other life style factors [32,33,34]). Since epigenetic changes are reversible, the potential interventional space is likely to be achievable through reversing the undesired epigenetic changes, as has been suggested by some authors [32,34,35,36,37].
A crucial conclusion of our study is that the earliest years of life had the strongest effect on AD mortality in 2005. The years of the Great Depression in the 1930s, when patients who died in 2005 were in their infancy and childhood, markedly shaped their fate as AD victims seven decades later, despite the fact that, as mentioned earlier, at that time of their lives the patients were the most resistant to the negative impact of the risk factors related to low income. The Fig 5. Variability in time of the relative slope of correlations of PCPI for each state with age-adjusted AD death rates (AADRs) for the respective states in 2005.The Relative slope was calculated by dividing slope data fromFig 4by the coefficient of stratification of PCPI between poorest and richest states; f = PCPI highest/PCPI lowest. This procedure removes the time-dependent influence of stratification of PCPI between states. Solid line regression curve obtained as inFig 3, dashed lines—95% confidence intervals. The oscillatory character of the relative slope resembles the oscillations of R inFig 3. Numbers of states as in legend toFig 3
conclusion that early life events shape the late life health status is consistent with numerous ob-servations from studies of the Dutch Hunger Winter consequences and similar studies from other countries (Roseboom et al. [38] and references therein), studies on the influence of the socioeconomic status in childhood on future susceptibility to AD [20,29], and animal studies [39]. In accordance with our analysis are studies by Glymour et al. [31] who observed a relation between the place of birth in the USA and AD mortality. Their observations can be explained by our finding that the relation between PCPI and AD mortality is the strongest for the early life events. The geographic distribution of birthplaces with the highest mortality coincides roughly with the geographic location of low-PCPI states. Since low income is related to poor diet in the early years of life [31] our results are complementary to theirs. Despite the fact that the early-life environmental stimuli have a great impact on late-life health, we observe that also later periods of life contribute to the frequency of death due to AD. This is illustrated by the persisting correlation of the income level with death rates throughout the whole period studied (see Figs3and A, and B inS2 File). Interventions reducing the negative influence of poor diet history are therefore possible throughout the whole life of an individual, albeit with a steadily decreasing efficiency. Recently, observations have been published concerning improved cogni-tion of the oldest-old patients due to mental and physical activity training in relacogni-tion to the non-trained groups [23,24]. These communications are in line with our suggestion that also the oldest patients are responsive to therapy, however, to a lesser extent than younger patients. We postulate that switching to a healthier diet together with mental, social and physical activity Fig 6. Average US PCPI in years 1929–2011 in constant 2011 dollars.This graph does not explain the
variability of R in this period seen inFig 3.
interventions can significantly improve the fate of patients. Such interventions are also impor-tant for the overall health status of the elderly as reported recently by Rizzuto et al. [40], who performed an 18-year follow up study on 1810 participants from the Kungsholmen district of Stockholm and found that a low-risk lifestyle profile can add five years to a woman’s and six years to a man’s life. A similar but lesser effect was also observed for the 85 and older group.
In the light of our results, the differences in AD mortality rates between races mentioned in the first paragraph of Rationale can be largely explained by differences in per capita income, since populations of African-Americans and Hispanic-origin Americans have lower per capita incomes than whites (US Census Bureau 2010 ACS 1 Year Estimates). Race-specific diets and other lifestyle factors, e.g., educational attainment (US Census Bureau 2010 ACS 1 Year Esti-mates) or others, related to the income may contribute to racial differences in AD mortality rates.
We have shown that the novel whole-population approach used here gives valuable results allowing identification of the long-gone causes of the enormous increase in the prevalence of AD in the USA in recent years. This was possible owing to the use of a general parameter of the healthiness of the lifestyle of a population; in our case the historical data of PCPI, and their cor-relation with death rates. Changing the habits of a population toward more healthy nutrition and other beneficial lifestyle behaviors, such as physical, mental and social activity, appear as the most effective measures to be undertaken to combat this disease. A similar strategy of re-ducing AD prevalence in the population by rere-ducing the influence of certain risk factors has been proposed by Barnes and Yaffe [41]. A recently published paper by Grant [42] uses a simi-lar logic to ours of analyzing the effects of historical changes of diet on the present AD mortali-ty in Japan and eight developing countries. The author concludes, in line with our results, that the dietary history of these countries has affected the present AD prevalence. Our approach of relating semi-quantitatively the history of a population’s lifestyle with the present mortality data could be easily applied to diseases other than AD, such as cancer, diabetes, cardiovascular disease and others in the hope of finding more efficient strategies of prevention.
Supporting Information
S1 File. Dataset with Excel spreadsheet containing PCPI and normalized PCPI data (XLS)
S2 File. Fig A in S2 File Variability in time of correlation coefficients R for correlations be-tween US state PCPIs in the period 1929–2005 and age-adjusted AD death rates (AADRs) for the respective states in 2000.Fig B in S2 File Variability in time of correlation coefficients R for correlations of US states’PCPIs in period 1929–2005 against age-adjusted AD death rates (AADRs) for these states in 2008. Table A in S2 File Parameters of correlation between PCPIs for each state of the USA and AADRs in 2005. Table B. The Kendall’s Tau correlation coeffi-cients and results of the Mann-Kendall trend test for the correlations between PCPI and age-adjusted AD death rates (AADRs) in 2005 (p value)
(DOC)
Acknowledgments
Jan Fronk, Wojciech Otto and Tomasz M. Stępkowski are gratefully acknowledged for critical
Author Contributions
Conceived and designed the experiments: DS. Performed the experiments: DS GW MS. Ana-lyzed the data: DS GW MS. Wrote the paper: DS MS.
References
1. Brookmeyer R, Johnson E, Ziegler-Graham K, Arrighi HM. Forecasting the global burden of Alzhei-mer’s disease. Alzheimers Dement 2007; 3: 186–191. doi:10.1016/j.jalz.2007.04.381PMID:
19595937
2. Brookmeyer R, Evans DA, Hebert L, Langa KM, Heeringa SG, Plassman BL, et al. National estimates of the prevalence of Alzheimer’s disease in the United States. Alzheimers Dement 2011; 7: 61–73. doi:
10.1016/j.jalz.2010.11.007PMID:21255744
3. Sosa-Ortiz AL, Acosta-Castillo I, Prince MJ. Epidemiology of Dementias and Alzheimer’s Disease. Arch Med Res 2012; 43: 600–608. doi:10.1016/j.arcmed.2012.11.003PMID:23159715
4. Hebert LE, Scherr PA, Beckett LA, Albert MS, Pilgrim DM, Chown MJ, et al. Age-specific incidence of Alzheimer’s disease in a community population. J Am Med Assoc 1995; 273: 1354–1359.
5. Alzheimer’s Association. 2013 Alzheimer’s disease facts and figures. Alzheimers Dement 2013; 9: 208–245. doi:10.1016/j.jalz.2013.02.003PMID:23507120
6. De Felice FG. Connecting Type 2 diabetes to Alzheimer’s disease. Expert Rev Neurother 2013; 13: 1297–1299. doi:10.1586/14737175.2013.864824PMID:24236899
7. Crane PK, Walker R, Hubbard RA, Li G, Nathan DM, Zheng H, et al. Glucose Levels and Risk of De-mentia. N Engl J Med 2013; 369: 540–548. doi:10.1056/NEJMoa1215740PMID:23924004
8. Kivipelto M, Helkala E-L, Laakso MP, Hänninen T, Hallikainen M, Alhainen K, et al. Midlife vascular risk factors and Alzheimer’s disease in later life: longitudinal, population based study. BMJ 2001; 322: 1447–1451. doi:10.1136/bmj.322.7300.1447PMID:11408299
9. Exalto LG, Quesenberry CP, Barnes D, Kivipelto M, Biessels GJ, Whitmer RA. Midlife risk score for the prediction of dementia four decades later. Alzheimers Dement 2014; 10: 562–570. doi:10.1016/j.jalz. 2013.05.1772PMID:24035147
10. Ballard C, O’Sullivan MJ. Alzheimer disease and stroke: Cognitive and neuroimaging predictors of AD and stroke. Nat Rev Neurol 2013; 9: 605–606. doi:10.1038/nrneurol.2013.215PMID:24145371
11. Tolppanen A-M, Ngandu T, Kaareholt I, Laatikainen T, Rusanen M, Soininen H, et al. (2013) Midlife and Late-Life Body Mass Index and Late-Life Dementia: Results from a Prospective Population-Based Cohort. J Alzheimers Dis 2014; 38: 201–209. doi:10.3233/JAD-130698PMID:23948937
12. Panza F, Capurso C, D’Introno A, Colacicco AM, Parigi AD, Gagliardi G, et al. Mediterranean diet, mild cognitive impairment, and Alzheimer’s disease. Exp Gerontol 2007; 42: 6–7. doi:10.1016/j.exger. 2006.09.011PMID:17092680
13. Féart C, Samieri C, Rondeau V, Amieva H, Portet F, Dartigues JF, et al. Adherence to a Mediterranean diet, cognitive decline, and risk of dementia. J Am Med Assoc 2009; 302: 638–648. doi:10.1001/jama. 2009.1146
14. Scarmeas N, Luchsinger JA, Schupf N, Brickman AM, Cosentino S, Tang MX, et al. Physical activity, diet, and risk of Alzheimer disease. J Am Med Assoc 2009; 302: 627–637. doi:10.1001/jama.2009. 1144
15. Wengreen H, Munger RG, Cutler A, Quach A, Bowles A, Corcoran C, et al. Prospective study of Dietary Approaches to Stop Hypertension- and Mediterranean-style dietary patterns and age-related cognitive change: the Cache County Study on Memory, Health and Aging. Am J Clin Nutr 2013; 98: 1263–1271. doi:10.3945/ajcn.112.051276PMID:24047922
16. Zeki Al Hazzouri A, Vittinghoff E, Byers A, Covinsky K, Blazer D, Diem S, et al. Long-term Cumulative Depressive Symptom Burden and Risk of Cognitive Decline and Dementia Among Very Old Women. J Gerontol A Biol Sci Med Sci. 2014; May; 69(5):595–601. doi:10.1093/gerona/glt139PMID:24097423
17. Breunig JJ, Guillot-Sestier M-V, Town T. Brain injury, neuroinflammation and Alzheimer’s disease. Front Aging Neurosci 2013; 5:26. doi:10.3389/fnagi.2013.00026PMID:23874297
18. Richardson JR, Roy A, Shalat SL, von Stein RT, Hossain MM, Buckley B, et al. Elevated Serum Pesti-cide Levels and Risk for Alzheimer Disease. JAMA Neurol. 2014 Mar; 71(3):284–90. doi:10.1001/ jamaneurol.2013.6030PMID:24473795
19. Fratiglioni L, Wang H-X. Smoking and Parkinson’s and Alzheimer’s disease: review of the epidemiologi-cal studies. Behav Brain Res 2000; 113: 117–120. doi:10.1016/S0166-.4328(00)00206-0PMID:
20. Moceri VM, Kukull WA, Emanuel I, van Belle G, Larson EB. Early-life risk factors and the development of Alzheimer’s disease. Neurology 2000; 54: 415–420. PMID:10668705
21. Fischer C, Yeung E, Hansen T, Gibbons S, Fornazzari L, Ringer L, et al. Impact of socioeconomic sta-tus on the prevalence of dementia in an inner city memory disorders clinic. Int Psychogeriatr 2009; 21: 1096. doi:10.1017/S1041610209990846PMID:19712540
22. Verghese J, Lipton RB, Katz MJ, Hall CB, Derby CA, Kuslansky G, et al. Leisure activities and the risk of dementia in the elderly. N Engl J Med 2003; 348: 2508–2516. doi:10.1056/NEJMoa022252PMID:
12815136
23. Middleton LE, Barnes DE, Lui L-Y, Yaffe K. Physical Activity Over the Life Course and Its Association with Cognitive Performance and Impairment in Old Age: LIFE COURSE PHYSICAL ACTIVITY AND COGNITION. J Am Geriatr Soc 2010; 58: 1322–1326. doi:10.1111/j.1532-5415.2010.02903.xPMID:
20609030
24. Barnes DE. The Mental Activity and eXercise (MAX) Trial: A Randomized Controlled Trial to Enhance Cognitive Function in Older Adults. JAMA Intern Med 2013; 173: 797. doi:10.1001/jamainternmed. 2013.189PMID:23545598
25. Glymour MM, Tzourio C, Dufouil C. Is Cognitive Aging Predicted by One’s Own or One’s Parents’ Edu-cational Level? Results From the Three-City Study. Am J Epidemiol 2012; 175: 750–759. doi:10.1093/ aje/kwr509PMID:22472116
26. Rogers MAM, Plassman BL, Kabeto M, Fisher GG, McArdle JJ, Llewellyn DJ, et al. Parental Education and Late-life Dementia in the United States. J Geriatr Psychiatry Neurol 2008; 22: 71–80. doi:10.1177/ 0891988708328220PMID:19073840
27. Mangialasche F, Kivipelto M, Solomon A, Fratiglioni L. Dementia prevention: current epidemiological evidence and future perspective. Alzheimers Res Ther 2012; 4: 1–8. doi:10.1186/alzrt104PMID:
22182734
28. Daviglus ML, Bell CC, Berrettini W, Bowen PE, Connolly ES Jr, Cox NJ, et al. National Institutes of Health State-of-the-Science Conference statement: preventing alzheimer disease and cognitive de-cline. Ann Intern Med 2010; 153: 176–181. doi:10.7326/0003-4819-153-3-201008030-00260PMID:
20547888
29. Moceri VM, Kukull WA, Emanual I, van Belle G, Starr JR, Schellenberg GD, et al. Using census data and birth certificates to reconstruct the early-life socioeconomic environment and the relation to the de-velopment of Alzheimer’s disease. Epidemiology 2001; 12: 383–389. doi: 10.1097/00001648-200107000-00007PMID:11416775
30. Chin AL, Negash S, Hamilton R. Diversity and Disparity in Dementia: The Impact of Ethnoracial Differ-ences in Alzheimer Disease. Alzheimer Dis Assoc Disord 2011; 25: 187–195. doi:10.1097/WAD. 0b013e318211c6c9PMID:21399486
31. Glymour MM, Kosheleva A, Wadley VG, Weiss C, Manly JJ. Geographic Distribution of Dementia Mor-tality: Elevated Mortality Rates for Black and White Americans by Place of Birth. Alzheimer Dis Assoc Disord 2011; 25: 196–202. doi:10.1097/WAD.0b013e31820905e7PMID:21297428
32. Kwok JB. Role of epigenetics in Alzheimer’s and Parkinson’s disease. Epigenomics 2010; 2: 671–682. doi:10.2217/epi.10.43PMID:22122050
33. McKay JA, Mathers JC. Diet induced epigenetic changes and their implications for health: Nutrition, epi-genetics and health. Acta Physiol 2011; 202: 103–118. doi:10.1111/j.1748-1716.2011.02278.xPMID:
21401888
34. Alegría-Torres JA, Baccarelli A, Bollati V. Epigenetics and lifestyle. Epigenomics 2011; 3: 267–277. doi:10.2217/epi.11.22PMID:22122337
35. Balazs R, Vernon J, Hardy J. Epigenetic mechanisms in Alzheimer’s disease: progress but much to do. Neurobiol Aging 2011; 32: 1181–1187. doi:10.1016/j.neurobiolaging.2011.02.024PMID:21669333
36. Gray SG. Epigenetic treatment of neurological disease. Epigenomics 2011; 3: 431–450. doi:10.2217/ epi.11.67PMID:22126204
37. Kim M, Bae M, Na H, Yang M. Environmental Toxicants—Induced Epigenetic Alterations and Their Re-versers. J Environ Sci Health Part C 2012; 30: 323–367. doi:10.1080/10590501.2012.731959PMID:
23167630
38. Roseboom TJ, Van Der Meulen JH, Ravelli AC, Osmond C, Barker DJ, Bleker OP Effects of prenatal exposure to the Dutch famine on adult disease in later life: an overview. Mol Cell Endocrinol 2001; 185: 93–98. doi:10.1016/S0303-7207(01)00721-3PMID:11738798
39. Altmann S, Murani E, Schwerin M, Metges CC, Wimmers K, Ponsuksili S. Maternal dietary protein re-striction and excess affects offspring gene expression and methylation of non-SMC subunits of conden-sin I in liver and skeletal muscle. Epigenetics 2012; 7: 239–252. doi:10.4161/epi.7.3.19183PMID:
40. Rizzuto D, Orsini N, Qiu C, Wang H-X, Fratiglioni L. Lifestyle, social factors, and survival after age 75: population based study. BMJ 2012; 345: e5568–e5568. doi:10.1136/bmj.e5568PMID:22936786
41. Barnes DE, Yaffe K. The projected effect of risk factor reduction on Alzheimer’s disease prevalence. Lancet Neurol 2011; 10: 819–828. doi:10.1016/S1474-4422(11)70072-2PMID:21775213