HESSD
9, 3339–3384, 2012Impact of climate change on sediment
yield in the Mekong River Basin
B. Shrestha et al.
Title Page
Abstract Introduction
Conclusions References
Tables Figures
◭ ◮
◭ ◮
Back Close
Full Screen / Esc
Printer-friendly Version
Interactive Discussion
Discussion
P
a
per
|
Dis
cussion
P
a
per
|
Discussion
P
a
per
|
Discussio
n
P
a
per
|
Hydrol. Earth Syst. Sci. Discuss., 9, 3339–3384, 2012 www.hydrol-earth-syst-sci-discuss.net/9/3339/2012/ doi:10.5194/hessd-9-3339-2012
© Author(s) 2012. CC Attribution 3.0 License.
Hydrology and Earth System Sciences Discussions
This discussion paper is/has been under review for the journal Hydrology and Earth System Sciences (HESS). Please refer to the corresponding final paper in HESS if available.
Impact of climate change on sediment
yield in the Mekong River Basin: a case
study of the Nam Ou Basin, Lao PDR
B. Shrestha1, M. S. Babel1, S. Maskey2, A. van Griensven2,3, S. Uhlenbrook2,4, A. Green5, and I. Akkharath5
1
Water Engineering and Management, School of Engineering and Technology, Asian Institute of Technology, P.O. Box 4, Klong Luang, Pathumthani 12120, Thailand 2
Department of Water Science and Engineering, UNESCO-IHE Institute for Water Education, P.O. Box 3015, 261DA Delft, The Netherlands
3
Department of Hydrology and Hydraulic Engineering, Vrije Universiteit Brussels, Pleinlaan 2, 1050 Brussels, Belgium
4
Department of Water Resources, Delft University of Technology, P.O. Box 5048, 2600 GA Delft, The Netherlands
5
HESSD
9, 3339–3384, 2012Impact of climate change on sediment
yield in the Mekong River Basin
B. Shrestha et al.
Title Page
Abstract Introduction
Conclusions References
Tables Figures
◭ ◮
◭ ◮
Back Close
Full Screen / Esc
Printer-friendly Version
Interactive Discussion
Discussion
P
a
per
|
Dis
cussion
P
a
per
|
Discussion
P
a
per
|
Discussio
n
P
a
per
|
Received: 21 February 2012 – Accepted: 3 March 2012 – Published: 14 March 2012
Correspondence to: B. Shrestha ([email protected])
Published by Copernicus Publications on behalf of the European Geosciences Union.
HESSD
9, 3339–3384, 2012Impact of climate change on sediment
yield in the Mekong River Basin
B. Shrestha et al.
Title Page
Abstract Introduction
Conclusions References
Tables Figures
◭ ◮
◭ ◮
Back Close
Full Screen / Esc
Printer-friendly Version
Interactive Discussion
Discussion
P
a
per
|
Dis
cussion
P
a
per
|
Discussion
P
a
per
|
Discussio
n
P
a
per
|
Abstract
This paper evaluates the impact of climate change on sediment yield in the Nam Ou Basin located in Northern Laos. The Soil and Water Assessment Tool (SWAT) is used to assess future changes in sediment flux attributable to climate change. Future pre-cipitation and temperature series are constructed through a delta change approach.
5
As per the results, in general, temperature as well as precipitation show increasing trends in both scenarios, A2 and B2. However, monthly precipitation shows both in-creasing and dein-creasing trends. The simulation results exhibit that the wet and dry seasonal and annual stream discharges are likely to increase (by up to 15, 17 and 14 % under scenario A2; and 11, 5 and 10 % under scenario B2 respectively) in the
10
future, which will lead to increased wet and dry seasonal and annual sediment yields (by up to 39, 28 and 36 % under scenario A2; and 23, 12 and 22 % under scenario B2 respectively). A higher discharge and more sediment flux are expected during the wet seasons, although the changes, percentage-wise, are observed to be higher during the dry months. In conclusion, the sediment yield from the Nam Ou Basin is likely to
in-15
crease with climate change, which strongly suggests the need for basin-wide sediment management strategies in order to reduce the negative impact of this change.
1 Introduction
Climatic changes have been observed in the past decades and the changes have been predicted for the coming decades (IPCC, 2007). Climate models estimate that
20
the global mean atmospheric temperature is likely to increase by 1.8 to 4.0◦ C by
the end of the 21st century, depending on various greenhouse gas (GHG) emissions scenarios (IPCC, 2007). An increase in global temperature is expected to increase evapotranspiration and cause precipitation changes, which will significantly affect the hydrological regimes of many river systems (Lu, 2005). Many studies have shown that
25
HESSD
9, 3339–3384, 2012Impact of climate change on sediment
yield in the Mekong River Basin
B. Shrestha et al.
Title Page
Abstract Introduction
Conclusions References
Tables Figures
◭ ◮
◭ ◮
Back Close
Full Screen / Esc
Printer-friendly Version
Interactive Discussion
Discussion
P
a
per
|
Dis
cussion
P
a
per
|
Discussion
P
a
per
|
Discussio
n
P
a
per
|
Burger, 2002), soil erosion rates (Pruski and Nearing, 2002; Michael et al., 2005; Neal et al., 2005) and sediment flux (Xu, 2003; Syvitski et al., 2005; Zhu et al., 2008). For instance, Zhu et al. (2008) have estimated the change in sediment flux from −0.7 to 13.7 % as a result of changes in rainfall from−0.7 to 17.8 % and temperature fluctuation of 0.03–2.4◦C in the Longchuanjiang catchment of the upper Yangtze River, China.
5
Similarly, Pan et al. (2011) have reported 1 to 3 %, 3.9 to 11.4 % and−1.1 to−5.3 % changes in mean annual, wet season and dry season streamflows respectively and 1.2 to 4.7 %, 3.6 to 15.3 % and−1.3 to−7.7 % changes in mean annual, wet season and dry season sediment yields respectively for the Song Cau watershed in northern Vietnam due to the changes in precipitation and temperature under B1, B2, and A2
10
climate change scenarios.
The area under study for the effects of climate change in this research is one part of the Mekong River basin. The Mekong is the largest river in Southeast Asia and drains a catchment of 795 000 km2 (Mekong River Commission, 2005) with China, Thailand, Laos, Cambodia, Vietnam and Myanmar as its riparian countries. Several climate
15
change studies of the Mekong River basin have projected a likely increase in the basin’s mean temperature and annual rainfall. For instance, Eastham et al. (2008) conducted a study to investigate the likely climate changes in the Mekong basin by the year 2030, and the results show a possible increase in the basin’s mean temperature by 0.79◦C
and a 13.5 % increase in annual precipitation resulting mainly from an increase in the
20
wet season’s (May to October) precipitation in all the sub-catchments. Apart from the climate change issue, the basin is currently facing other challenges too: the residen-tial population is growing, urban sectors are expanding, and the economies of riparian countries are developing rapidly (Keskinen, 2008). Water-development projects, most notably the construction of large hydropower dams, are important for economic
devel-25
opment (Mekong River Commission, 2006) and hence, extensive plans are underway to build reservoirs in the tributaries as well as the mainstream areas within the riparian countries (Mekong River Commission, 2008).
HESSD
9, 3339–3384, 2012Impact of climate change on sediment
yield in the Mekong River Basin
B. Shrestha et al.
Title Page
Abstract Introduction
Conclusions References
Tables Figures
◭ ◮
◭ ◮
Back Close
Full Screen / Esc
Printer-friendly Version
Interactive Discussion
Discussion
P
a
per
|
Dis
cussion
P
a
per
|
Discussion
P
a
per
|
Discussio
n
P
a
per
|
The sediment load of a river is sensitive to both, climate change and a wide range of human activities within its drainage basin. These factors could influence sediment mo-bilization and transfer through actions like clearing of land, agricultural development, mineral extraction, urbanization and infrastructure development, dam and reservoir construction, and soil conservation and sediment control programs (Walling, 2008).
5
Although the sediment of the Lower Mekong River has critical implications for aquatic ecology – fisheries, agriculture, water supply and river navigation, studies of the gen-eration, transportation and deposition of sediment in the Lower Mekong are sparse (Wang et al., 2011). Previous studies (Ishidaira et al., 2008; Kiem et al., 2008; Hoanh et al., 2010; Kingston et al., 2011) of the hydrological impacts of potential climate
10
changes in the Mekong have generally focused on discharge. The potential future changes in sediment load should be seen as an important requirement for sound river basin management (Walling, 2008). While researchers have highlighted the signifi-cant potential of climate change in increasing global soil erosion rates and possibly, consequent, increasing the amount of suspended sediment flux in rivers, the actual
15
response of suspended sediment flux in a particular place varies because it is also highly affected by the physical characteristics of the catchment and human activities in it (SWCS, 2003; Zhang and Nearing, 2005). In any case, there is a clear need for improved understanding of the potential impact of climate change on the sediment load of the Mekong River specifically. Further, the possible changes in the sediment load
20
needs to be evaluated in order to establish the sensitivity of the river system to the drivers of change, to understand the implications on future reservoir development and to assess their (the changes’) effects on future management strategies (as outlined by Walling, 2008).
Reliable predictions of the quantity and rate of runoff, and sediment transport from
25
HESSD
9, 3339–3384, 2012Impact of climate change on sediment
yield in the Mekong River Basin
B. Shrestha et al.
Title Page
Abstract Introduction
Conclusions References
Tables Figures
◭ ◮
◭ ◮
Back Close
Full Screen / Esc
Printer-friendly Version
Interactive Discussion
Discussion
P
a
per
|
Dis
cussion
P
a
per
|
Discussion
P
a
per
|
Discussio
n
P
a
per
|
can be used. Of these, the Soil and Water Assessment Tool (SWAT) has been em-ployed widely to evaluate the impact of climate change on soil erosion and sediment flux (Zhu et al., 2008). For example, Li et al. (2011) applied SWAT to evaluate the effect of temperature change on water discharge, and sediment and nutrient loading in the lower Pearl River basin, China. Hanratty and Stefan (1998) and Boorman (2003) have
5
also described the application of SWAT to evaluate the impact of climate change on sediments in an agricultural watershed in Minnesota and in five European catchments. The main objective of this paper is to evaluate the impact of possible climate change scenarios on the sediment yield in the Nam Ou River basin – one of the important sub-basins of the Mekong River basin. In this study, we have attempted to simulate
10
the sediment yield from the Nam Ou basin and to quantify the implications of climate change on sediment load using the SWAT model. For assessing the impact of climate change, future temperature and precipitation time series were obtained by applying the change factor or delta change method (Hay et al., 2000) to a regional climate model (RCM) simulated temperature and precipitation.
15
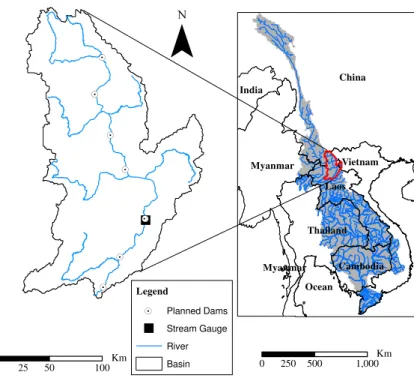
2 Study area
The Nam Ou River basin, a sub-basin of the Mekong River basin, is located in the northern part of the Lao People’s Democratic Republic (Fig. 1). It lies within 21◦17′17′′–
22◦30′40′′N and 101◦45′47′′–103◦11′57′′E and covers a total area of 26 180.50 km2.
The topography of the basin is mostly mountainous, dominated by sharp relief. The
20
elevation of the basin ranges from 263 to 2035 m a.m.s.l. (above mean sea level). The climate in the study area is characterized by two distinct seasons: a wet season (May to October) and a dry season (November to April). The mean annual temperature ranges from 20 to 26◦C. The basin receives about 1700 mm rainfall annually, of which
about 80 % falls during the wet season. Woods and shrub land are the dominant land
25
cover in the basin, and cover nearly 62 % of the total area. Soil in this river basin is predominantly sandy clay loam.
HESSD
9, 3339–3384, 2012Impact of climate change on sediment
yield in the Mekong River Basin
B. Shrestha et al.
Title Page
Abstract Introduction
Conclusions References
Tables Figures
◭ ◮
◭ ◮
Back Close
Full Screen / Esc
Printer-friendly Version
Interactive Discussion
Discussion
P
a
per
|
Dis
cussion
P
a
per
|
Discussion
P
a
per
|
Discussio
n
P
a
per
|
3 Data and methods 3.1 Observed data
Observed daily rainfall data from eleven stations (Luang Prabang, Xieng Ngeun, Muong Ngoy, Oudomxay, Muong Namtha, Phong Saly, Dien Bien, Lai Chau, Muong Te, Quynh Nhai, andTuan Giao), and climatic data of daily temperature, wind speed, humidity and
5
solar radiation from three stations (Luang Prabang, Oudomxay and Phongsaly) were used for this study. The records for rainfall data were from 1980–2003, and for other climatic data the period was of 12 yr (1992–2003). The observed precipitation data at the stations were interpolated and aggregated to the sub-basin by using the MQUAD program in the Decision Support Framework of the Mekong River Commission (MRC).
10
MQUAD generates estimations of areal rainfall (the catchment’s average rainfall) by calculating a multi-quadratic surface from available point rain gauge data, such that the surface passes through all the gauge points. The surface is defined for a user specified area, consisting of one or more catchments, and is made up from a grid of estimated point rainfall values calculated by the software. The grid of point values calculated is
15
then aggregated to produce a mean rainfall depth for each catchment. This process is repeated for each time step of the input point rainfall database.
The data of the maximum and minimum daily temperatures for 1980–1991 was de-rived from the 1/2-degree gridded global daily maximum and minimum temperature data, which is available for 1950 through 1999 from the Santa Clara University (SCU).
20
Details of the SCU data can be found in Maurer et al. (2009). The source of this database is the following link: http://www.engr.scu.edu/∼emaurer/global data/. The
statistics of the observed maximum and minimum monthly temperatures for three sta-tions of the sub-basin were compared with the SCU data for the years 1992–1999, and this comparison is presented in Table 1. The comparison shows a good relationship
25
HESSD
9, 3339–3384, 2012Impact of climate change on sediment
yield in the Mekong River Basin
B. Shrestha et al.
Title Page
Abstract Introduction
Conclusions References
Tables Figures
◭ ◮
◭ ◮
Back Close
Full Screen / Esc
Printer-friendly Version
Interactive Discussion
Discussion
P
a
per
|
Dis
cussion
P
a
per
|
Discussion
P
a
per
|
Discussio
n
P
a
per
|
and SCU data. This relationship was used to derive the daily maximum and minimum temperature data for the 1980–1991 period.
The meteorological data, daily discharge (for 1992–2003) and suspended sediment concentration (SSC) data (for 1996–2002) from the gauging station at Muong Ngoy in the study area were obtained from the MRC Secretariat, Phonm Penh, Cambodia.
5
Unlike discharge, which was measured daily, measurements of SSC were relatively sporadic, ranging from 6 to 56 measurements per year.
3.2 Regional climate model outputs
The RCM used in this study is PRECIS, developed by the Hadley Center of the UK
Meteorological Office. The PRECIS RCM is based on the atmospheric components
10
of the ECHAM4 GCM from the Max Planck Institute for Meteorology, Germany. The PRECIS data was produced by the Southeast Asian System for Analysis, Research and Training (START) Regional Center for 2225 grid cells covering the entire Mekong River basin with the resolution of 0.2×0.2◦ (approximately 22×22 km2). This data, comprising two data sets for ECHAM4 SRES Scenarios A2 and B2, includes daily
15
precipitation and maximum and minimum daily temperatures. The PRECIS RCM data over the periods of 1971–2000 (present) and 2011–2070 (future), for both A2 and B2 scenarios, was obtained from the Southeast Asian START Regional center. The source of this data base is the website http://www.start.or.th/. The specific boundary for the Nam Ou basin lies between latitudes 19.46◦–22.77◦N and longitudes 100.72◦–
20
103.32◦E.
Many statistical downscaling techniques have been developed to translate large-scale GCM/RCM output into finer resolution (Fowler et al., 2007). In this study, the simplest method – change factor or delta change approach has been applied. The change factor or delta change method has been used in many climate change
im-25
pact studies earlier (Hay et al., 2000; Diaz-Nieto and Wilby, 2005; Akhtar et al., 2008; Minville et al., 2008; Chen et al., 2011). Basically, this approach modifies the observed historical time series of precipitation by multiplying the ratio of the monthly future and
HESSD
9, 3339–3384, 2012Impact of climate change on sediment
yield in the Mekong River Basin
B. Shrestha et al.
Title Page
Abstract Introduction
Conclusions References
Tables Figures
◭ ◮
◭ ◮
Back Close
Full Screen / Esc
Printer-friendly Version
Interactive Discussion
Discussion
P
a
per
|
Dis
cussion
P
a
per
|
Discussion
P
a
per
|
Discussio
n
P
a
per
|
actual precipitations simulated by a GCM or RCM for each time period. Similarly, the observed daily temperature is modified by adding the difference between the monthly future and actual temperatures as simulated by the GCM or RCM for each time period. The observational database used for this approach covers the period of 1981–2000 for both precipitation and temperature in this study.
5
3.3 The SWAT model description
SWAT is a river basin or watershed scale, semi-distributed, process-based, and contin-uous time hydrologic and water quality model initially developed by Arnold et al. (1993) and designed to evaluate the effect of land use management on water, sedimentation, and agricultural chemical yields in large complex watersheds which are heterogeneous
10
in land use, soil and management conditions over a long period of time (Arnold et al., 1998; Neitsch et al., 2005). SWAT subdivides a watershed into different sub-basins connected by a stream network, and further into hydrological response units (HRUs). HRUs are the lumped land areas within the sub-basin that comprise of unique land cover, soil, slope and management combinations. SWAT simulates the hydrology of
15
the watershed in two phases. The land phase of the hydrologic cycle controls the amount of water, sediment, nutrients and pesticides loadings to the main channel in each sub-basin. The water or routing phase of the hydrologic cycle controls the move-ment of water, sedimove-ment, nutrients and pesticide loadings through the channel network of the watershed into the outlet.
20
SWAT estimates the surface runoffvolume from HRUs using the SCS curve number method (USDA-SCS, 1972) or the Green and Ampt infiltration method (Green and Ampt, 1911). In this study, the SCS curve number method has been used, which is a function of the soil’s permeability, land use and antecedent soil water conditions as defined in SWAT. SCS defines three antecedent moisture conditions: dry (wilting point),
25
HESSD
9, 3339–3384, 2012Impact of climate change on sediment
yield in the Mekong River Basin
B. Shrestha et al.
Title Page
Abstract Introduction
Conclusions References
Tables Figures
◭ ◮
◭ ◮
Back Close
Full Screen / Esc
Printer-friendly Version
Interactive Discussion
Discussion
P
a
per
|
Dis
cussion
P
a
per
|
Discussion
P
a
per
|
Discussio
n
P
a
per
|
and Tyalor, 1972), and Monteith (Monteith, 1965) methods. The Penman-Monteith method has been used in this study. The model calculates the surface erosion within each HRU with the Modified Universal Soil Loss Equation (MUSCLE) (Williams, 1975). The MUSCLE is:
sed = 11.8 × Qsurf ×qpeak ×areahru 0.56
×KUSLE ×CUSLE × PUSLE × LSUSLE × CFRG (1) 5
where sed is the sediment yield (metric tons day−1),Q
surf is the surface runoffvolume (mm ha−1day−1),q
peak is the peak runoffrate (m 3
s−1), area
hru is the area of the HRU (ha),KUSLE is the USLE soil erodibility factor,CUSLE is the USLE cover and manage-ment factor,PUSLEis the USLE support practice factor,LSUSLEis the USLE topographic factor and CFRG is the coarse fragment factor.
10
SWAT uses Manning’s equation to define flow rate and velocity. Water is routed through the channel network using the variable storage routing method developed by Williams (1969) or the Muskingum routing methods which are variations of the kine-matic wave model. For this study, the variable storage routing method was used. The sediment-routing model (Arnold et al., 1995) that simulates sediment transport in the
15
channel network consists of two components operating simultaneously: deposition and degradation. The amount of deposition and degradation is based on the maximum con-centration of sediment in the reach and the concon-centration of sediment in the reach at the beginning of the time step. The final amount of sediment in the reach is determined as:
20
sedch = sedch,i −seddep + seddeg (2)
where sedch is the amount of suspended sediment in the reach (metric tons day− 1
), sedch,i is the amount of suspended sediment in the reach at the beginning of the time period (metric tons day−1), sed
dep is the amount of sediment deposited in the reach segment (metric tons day−1), and sed
deg is the amount of sediment reentrained in the 25
reach segment (metric tons day−1).
HESSD
9, 3339–3384, 2012Impact of climate change on sediment
yield in the Mekong River Basin
B. Shrestha et al.
Title Page
Abstract Introduction
Conclusions References
Tables Figures
◭ ◮
◭ ◮
Back Close
Full Screen / Esc
Printer-friendly Version
Interactive Discussion
Discussion
P
a
per
|
Dis
cussion
P
a
per
|
Discussion
P
a
per
|
Discussio
n
P
a
per
|
The amount of sediment transported out of the reach is calculated as:
sedout = sedch × Vout
Vch (3)
where sedout is the amount of sediment transported out of the reach (metric
tons day−1), sed
ch is the amount of suspended sediment in the reach (metric
tons day−1), V
out is the volume of outflow during the time step (m 3
), and Vch is the
5
volume of water in the reach segment (m3). The detailed descriptions of the different model components can be found in Neitsch et al. (2005).
The main input data for the SWAT model consists of daily precipitation, maximum and minimum air temperatures, wind speed, humidity, solar radiation, and spatial data on Digital Elevation Model (DEM), land use and soil. River discharge and suspended
10
sediment yield were used for calibration and validation purposes. The input datasets for the model were obtained from the MRC Secretariat, Phonm Penh, Cambodia. In this study, a 250 m resolution DEM was used to delineate watershed and sub-basin boundaries, and to calculate sub-basin average slopes and to outline the stream net-work. Land use specifications, soil and slope layers were used to create HRUs within
15
each sub-basin area.
3.3.1 Model calibration and validation
The Nam Ou SWAT model was calibrated and validated for streamflow but only cal-ibrated for sediment yield. The periods 1992–1999 and 2000–2003 were used for streamflow calibration and validation respectively, including two years as a warm-up
20
period. The warm-up period allows the model to cycle multiple times so as to minimize the effect of the user’s estimates of initial state variables such as soil and water content and surface residue (Zhang et al., 2007). For this study, the sediment load was only calibrated for 1996–2002 due to the sporadic nature of data (only 176 measurements in 7 yr). For streamflow, the calibration was carried out both manually and
automat-25
HESSD
9, 3339–3384, 2012Impact of climate change on sediment
yield in the Mekong River Basin
B. Shrestha et al.
Title Page
Abstract Introduction
Conclusions References
Tables Figures
◭ ◮
◭ ◮
Back Close
Full Screen / Esc
Printer-friendly Version
Interactive Discussion
Discussion
P
a
per
|
Dis
cussion
P
a
per
|
Discussion
P
a
per
|
Discussio
n
P
a
per
|
calibration of the SWAT model, the Sequential Uncertainty Fitting (SUFI-2) algorithm (Abbaspour et al., 2004, 2007) was used. SUFI-2 is a combined calibration and un-certainty analysis technique which expresses the total unun-certainty of the model output in terms of final parameter ranges which also correspond to the model output ranges. Readers are referred to Abbaspour et al. (2007) for the details of SUFI-2 procedure.
5
3.3.2 Model evaluation and uncertainty analysis
The model performance is evaluated using the coefficient of determinant (R2), the Nash-Sutcliffe (NS) measure (Nash and Sutcliffe, 1970) and Percent Bias (PBIAS). Several researchers (such as Santhi et al., 2001; Benaman et al., 2005) have sug-gested that the prediction efficiency of a calibrated model can be judged as satisfactory
10
if NS andR2values are>0.6 (Setegn et al., 2010). PBIAS value<15 % is considered to be a satisfactory performance rating of a calibrated model by a number of researchers (Santhi et al., 2001; Van Liew et al., 2007).
The degree to which uncertainties are accounted for is quantified by a measure re-ferred to as thep-factor, which is the percentage of measured data bracketed by the
15
95 % prediction uncertainty (95 PPU). The 95 PPU is calculated at 2.5 % and 97.5 % levels of the cumulative distribution of an output variable obtained through the Latin Hypercube Sampling method (Abbaspour et al., 2007), disallowing 5 % of the very bad simulations. Another measure quantifying the strength of a calibration/uncertainty anal-ysis is ther-factor, which is the average thickness of the 95 PPU band divided by the
20
standard deviation of the measured data. The goodness of fit and the degree to which the calibrated model accounts for the uncertainties are assessed by the closeness of thep-factor to 100 % (i.e. all observations falling inside the prediction uncertainty band) while having the narrowest band (r-factor→0). The average distance between the upper and the lower 95 PPU is determined as:
25
dx = 1 k
k
X
t=1
(XU − XL)l (4)
HESSD
9, 3339–3384, 2012Impact of climate change on sediment
yield in the Mekong River Basin
B. Shrestha et al.
Title Page
Abstract Introduction
Conclusions References
Tables Figures
◭ ◮
◭ ◮
Back Close
Full Screen / Esc
Printer-friendly Version
Interactive Discussion
Discussion
P
a
per
|
Dis
cussion
P
a
per
|
Discussion
P
a
per
|
Discussio
n
P
a
per
|
r-factor = dσx
x
(5)
whereXU andXL represent the upper and lower boundaries of the 95 PPU, andσx is the standard deviation of the measured data.
4 Results and discussion
4.1 Changes in temperature and precipitation
5
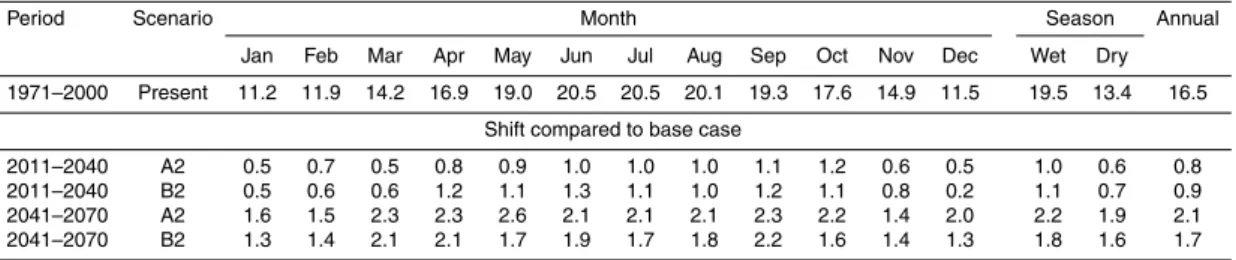
The present and future changes in simulated mean monthly, seasonal and annual max-imum and minmax-imum temperatures are presented in Tables 2a and b respectively. The results indicate a general increase in both, maximum and minimum temperatures, dur-ing the periods of 2011–2040 and 2041–2070 for scenarios A2 and B2. The change in mean monthly maximum and minimum temperature is predicted to be the highest
10
in May, with a rise of 2.8 and 2.6◦C (respectively) under A2, while under B2, a higher
maximum and minimum temperature shift is predicted for June (+2.1◦C) and
Septem-ber (+2.2◦C) respectively. At each horizon, the change in temperature is higher for the
wet season as compared to the dry season, thereby indicating that warming will be stronger during the wet season. The mean annual maximum temperature rise ranges
15
from 0.7 up to 1.9◦C over the period of 60 yr while the minimum temperature rise
ranges from 0.8 up to 2.1◦C. The increase in average annual minimum temperature is
predicted to be higher than the increase in maximum temperature in the basin.
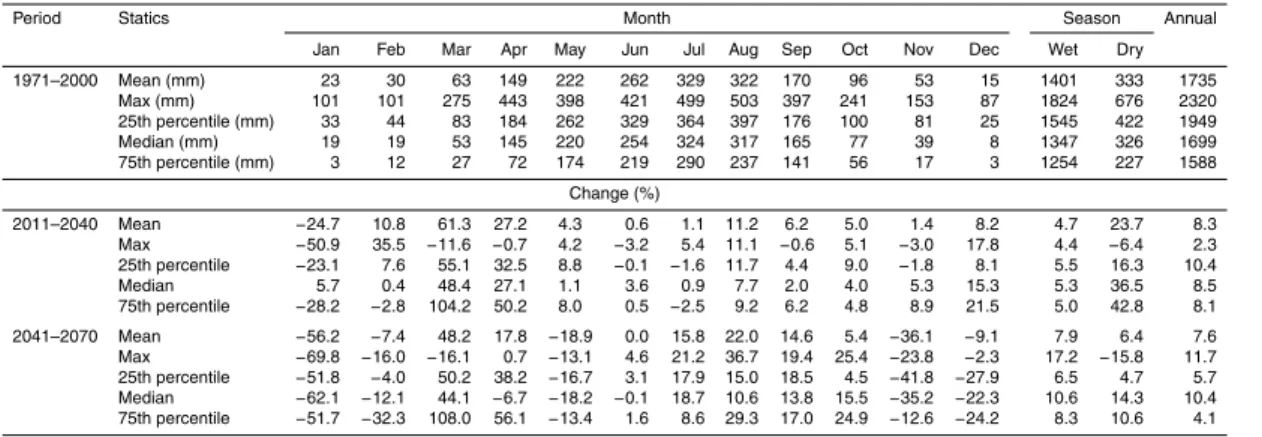
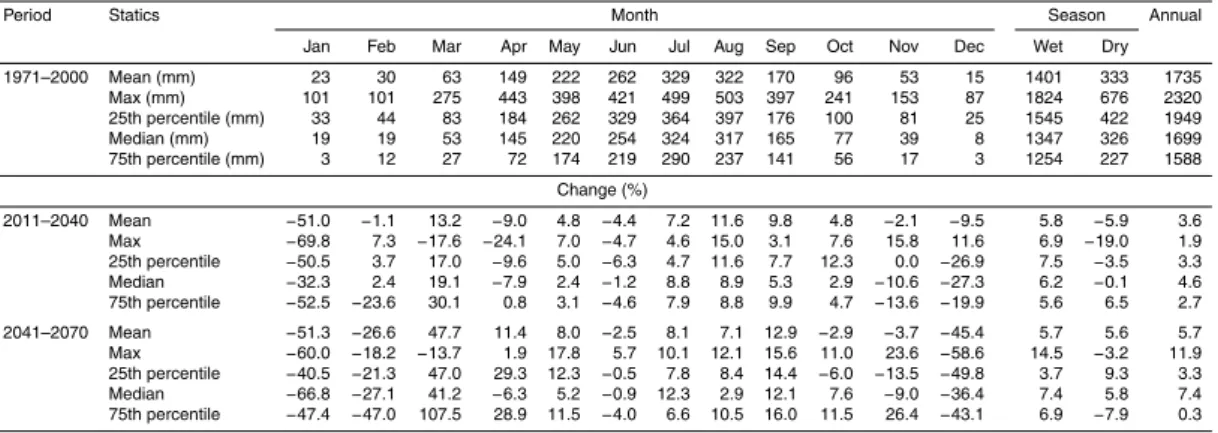
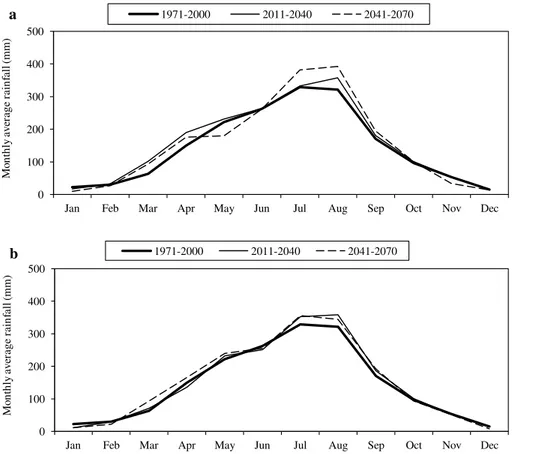
Figure 2 and Tables 3a and b present a comparison of monthly mean rainfall for the present (1971–2000) and A2 and B2 scenarios. Under A2 scenario for the 2011–2040
20
HESSD
9, 3339–3384, 2012Impact of climate change on sediment
yield in the Mekong River Basin
B. Shrestha et al.
Title Page
Abstract Introduction
Conclusions References
Tables Figures
◭ ◮
◭ ◮
Back Close
Full Screen / Esc
Printer-friendly Version
Interactive Discussion
Discussion
P
a
per
|
Dis
cussion
P
a
per
|
Discussion
P
a
per
|
Discussio
n
P
a
per
|
six months and increases for remaining months under scenario B2 for both horizons, with the highest increase taking place in March (47.7 %) and the highest decrease in January (51.3 %). The shift in peak rainfall from July to August is observed under A2 scenario, while for B2 scenario, this phenomenon is only obvious for the period of 2011–2040 (Fig. 2). The increase in precipitation can be seen in both seasons for
5
both scenarios except for the dry season during the 2011–2040 horizon of B2 scenario where precipitation decreases by almost 6 %. For the 2011–2040 period, the change in precipitation during the dry season is greater than during the wet season. Mean annual precipitation over the basin is predicted to rise from 7.6 to 8.3 % under A2 scenario and from 3.6 to 5.7 % for B2 scenario. These results indicate that, in general, there will be
10
an increase in the mean seasonal and annual precipitation over the basin.
Tables 3a and b also present future changes in maximum, 25th percentile, median and 75th percentile rainfall as compared to the present period (1971–2000) for both scenarios. The increase is observed for seasonal as well as annual rainfall. The in-crease in the maximum, 25th percentile, median and 75th percentile rainfall indicates
15
that more intense rainfall events are to be expected in the future, which may result in increased high-flow events. Similarly, the increase in the 25th percentile, median and 75th percentile rainfalls during the dry season under A2 scenario implies that stream discharge may increase during the dry season.
4.2 Model calibration and validation
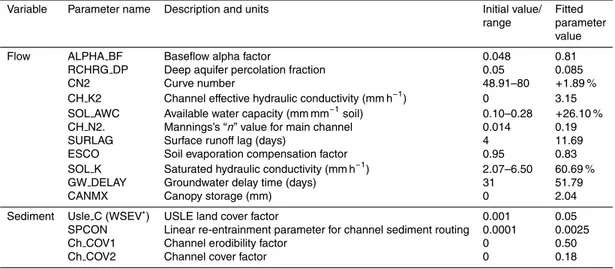
20
Table 4 presents the parameters that are used for the model calibration with their ini-tial values/range and the calibrated values. The most sensitive parameters for flow predictions were found to be the base flow alpha factor (ALPHA BF), recharge to deep aquifer (RCHRG DP), curve number (CN2), channel effective hydraulic con-ductivity (CH K2), available water capacity (SOL AWC), Manning’s “n” value for the
25
main channel (CH N2), surface runoff lag time (SURLAG), soil evaporation compen-sation factor (ESCO), saturated hydraulic conductivity (SOL K), groundwater delay time (GW DELAY) and canopy storage (CANMX). The most sensitive parameters for
HESSD
9, 3339–3384, 2012Impact of climate change on sediment
yield in the Mekong River Basin
B. Shrestha et al.
Title Page
Abstract Introduction
Conclusions References
Tables Figures
◭ ◮
◭ ◮
Back Close
Full Screen / Esc
Printer-friendly Version
Interactive Discussion
Discussion
P
a
per
|
Dis
cussion
P
a
per
|
Discussion
P
a
per
|
Discussio
n
P
a
per
|
sediment simulation were USLE land cover factor for wood and shrub land (WSEV), the linear re-entrainment parameter for channel sediment routing (SPCON), channel erodibility factor (Ch COV1) and channel cover factor (Ch COV2).
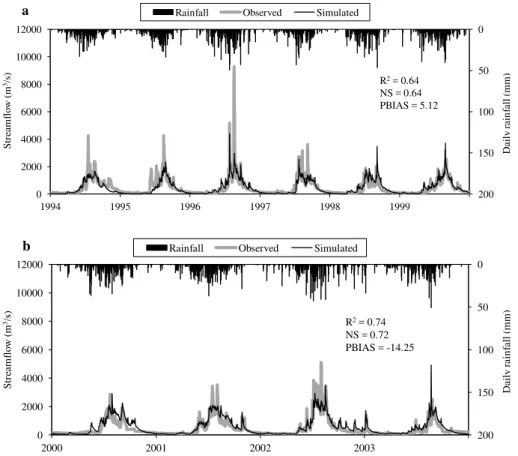
Figure 3a and b compare simulated daily streamflow with observed data for the cal-ibration and validation periods respectively. The simulated daily flow matches the
ob-5
served values for the calibration period withR2=0.64, NS=0.64 and PBIAS=5.12 %. For the validation period, the simulated and observed daily flows showed acceptable agreement as indicated by the values of R2, NS and PBIAS being 0.74, 0.72 and −14.25 % respectively. The results indicate that the Nam Ou SWAT model simulates the streamflow with reasonable accuracy. The model was able to replicate the base
10
flow well for both, the calibration and validation, periods. However, the model was not able to capture peak flows except for 1998 and 1999 during the calibration period and for 2000 and 2003 during the validation period. This mismatch in peak flows might be attributed to precipitation data and also errors in the observed streamflow data, espe-cially during high flows. The SWAT modeling study in the Mekong River basin carried
15
out by Rossi et al. (2009) had also reported that errors in gauging stations can at-tribute to less reliable matching of hydrographs, especially at sites along the Mekong’s tributaries. The errors in gauging stations vary across the flow range but are more pro-nounced at extreme low flows due to recording errors and at high flows due to rating errors (Rossi et al., 2009).
20
Figure 4 compares observed and simulated sediment yields. The R2 and NS val-ues are less than 0.6. However, the PBIAS value of 4.18 % indicates a good volume balance between simulated and observed sediment loads. The lower values of NS and R2 may be attributed to limitations in terms of the continuity and length of the records. Potter and Hiatt (2009) also reported lowerR2 and NS values for the daily
25
HESSD
9, 3339–3384, 2012Impact of climate change on sediment
yield in the Mekong River Basin
B. Shrestha et al.
Title Page
Abstract Introduction
Conclusions References
Tables Figures
◭ ◮
◭ ◮
Back Close
Full Screen / Esc
Printer-friendly Version
Interactive Discussion
Discussion
P
a
per
|
Dis
cussion
P
a
per
|
Discussion
P
a
per
|
Discussio
n
P
a
per
|
to assess changes in the sediment load of a river system is largely dependent upon the number and the location of the measuring stations, the amount of available data, reliability, accuracy, the temporal resolution of the data and the length of the record (Walling, 2008).
Figure 4 also shows that the model was not able to capture peak sediment events.
5
This under-prediction of peak events can be due to an uncertainty in the soil erosion model used in SWAT. SWAT simulates erosion based on the MUSLE, which was orig-inally developed to estimate annual soil loss from agricultural fields. Also, the topo-graphic factor (LS) derived from DEM may not be accurate due to inaccuracies in DEM (Babel et al., 2011). Jackson et al. (1986) and Johnson et al. (1986) reported that the
10
MUSLE tends to over-predict sediment yields for small events and under-predict the same for large events. The studied watershed is located in a tropical climate zone with intense rainfall and heavy storms which have more potential to erode surface soil, but the MUSLE does not account for such factors (as is also mentioned by Phomcha et al.. 2011).
15
The p-factor, which is the percentage of observations bracketed by 95 PPU, brack-ets 72 % of the observations andr-factor equal to 0.49 for daily discharge, while for sediment yields, thep-factor and r-factor were 83 % and 0.68 respectively. Figures 5 and 6 show the uncertainty analysis results for monthly discharge and sediment yield of the study basin. As illustrated, a majority of the observed data is inside or very close
20
to the predicted bands, thereby indicating good results. However, some peak events, mostly during the wet season (May–October), are outside the predicted bands for both discharge and sediment yields, and this implies the underestimation of these events by the model. For most cases, the uncertainty interval at the peaks is large. In general, the model performance, as represented by thep-factor and ther-factor, is reasonable.
25
Large uncertainties in some events may also be due to possible errors in the observed data (as discussed above) or due to inadequate climate or landuse representations, as outlined by Schuol et al. (2008). This might also be due to the conceptual model uncer-tainties because each hydrological model suffers from conceptual model uncertainties
HESSD
9, 3339–3384, 2012Impact of climate change on sediment
yield in the Mekong River Basin
B. Shrestha et al.
Title Page
Abstract Introduction
Conclusions References
Tables Figures
◭ ◮
◭ ◮
Back Close
Full Screen / Esc
Printer-friendly Version
Interactive Discussion
Discussion
P
a
per
|
Dis
cussion
P
a
per
|
Discussion
P
a
per
|
Discussio
n
P
a
per
|
and this is particularly true for large watershed models where many processes (natural or man-made) may not be adequately represented in the model (Schuol et al., 2008). In SUFI-2, the 95 PPUs are the combined outcome of the uncertainties in the conceptual model, parameters and input data. Nevertheless, these uncertainty sources are not separately evaluated but attributed as total model uncertainty to the parameters and
5
are presented in the final parameter ranges and corresponding model output ranges. Overall, the results above indicate that the SWAT model can be applied for a reason-able assessment of the climate change impact on river discharge and sediment yield in the basin.
4.3 Impact of climate change on sediment yield
10
Figure 7a and b show the mean annual discharge cycle for the present and future cli-mate for A2 and B2 scenarios and relative changes in mean future monthly discharges, as simulated by the SWAT model. The model simulation results show that for 2011– 2040 under A2 scenario, the discharge increases in all months with the highest change for March and April (about 40 %) and lowest change taking place in January and
Febru-15
ary (less than 3 %). In contrast, for 2041–2070, the discharge is predicted to decrease during November–February and May–June with the maximum decrease in February and May (nearly 16 %). The highest change in discharge is observed for April, with a 35 % increase. There is an increase in river discharge during July–December and a decrease during January–June for 2011–2040 under B2 scenario. In April, the
dis-20
charge is predicted to decrease by 25 %, which is the biggest change simulated by the model. For 2041–2070, there is an increase in the discharge in all the months except January and February. Interestingly, the highest change in discharge is observed in April, but in contrast to the 2011–2040 case, the discharge is predicted to increase by 26 %. The mean annual discharge cycle for the present and future climates for both
25
HESSD
9, 3339–3384, 2012Impact of climate change on sediment
yield in the Mekong River Basin
B. Shrestha et al.
Title Page
Abstract Introduction
Conclusions References
Tables Figures
◭ ◮
◭ ◮
Back Close
Full Screen / Esc
Printer-friendly Version
Interactive Discussion
Discussion
P
a
per
|
Dis
cussion
P
a
per
|
Discussion
P
a
per
|
Discussio
n
P
a
per
|
of streamflow are estimated for months in the wet season (mostly July–October). This suggests that the change will be more significant for the wet season than the dry sea-son. The variability observed in the intra-annual (monthly) change of streamflow can be attributed to the variable changes in inter-annual rainfall. The changes in monthly tem-perature and precipitation show that an increase in temtem-perature occurs for the basin in
5
all the months of the year but changes in precipitation vary from month to month within the basin, and most probably from sub-basin to sub-basin.
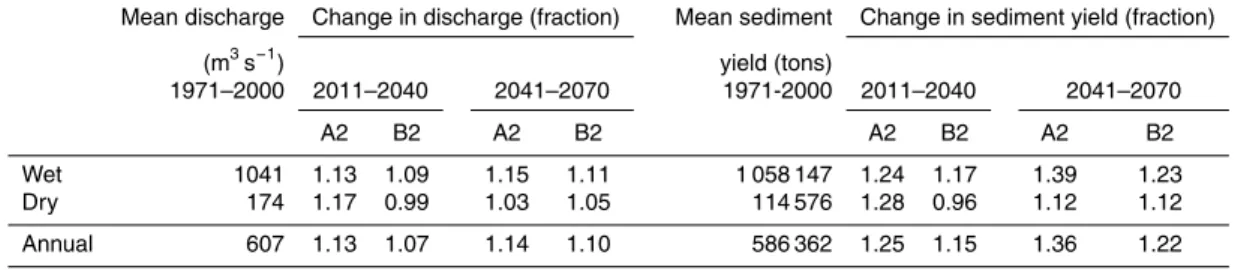
In general, the model predicts an increase in the mean seasonal as well as the mean annual flow in the future for both scenarios (as presented in Table 5). Moreover, changes in the A2 scenario will be more than those in the B2 scenario. The mean wet
10
and dry seasonal flows are predicted to increase by 1.09–1.15 and 1.03–1.17 times the present discharge rates respectively, leading to an overall increase (by 1.07–1.14 times the present discharge) in annual discharge. Therefore, the available water resources in the Nam Ou Basin can be expected to increase in the future. The increase in the wet season’s flow indicates that there will be greater flood discharges. This further
15
implies that in order to reduce the adverse effect of increased floods, proper flood water management strategies should be incorporated in the basin development plans. Also, the design and operation rules of the many reservoir dams that have been planned for hydropower purposes should be revisited in the light of these findings.
An increase in the dry season flow implies that more water will be available in the
20
basin for that season’s agricultural usage in Northern Laos. This is favorable to the 20-Yr Plan of the Lower Mekong Basin to increase the irrigation area during the dry season by 42.9 % in Northern Laos (Hoanh et al., 2010). Nevertheless, the increase in magnitude of discharge for the dry season is not so significant. Although changes in mean seasonal and annual discharge are important measures of change in a river
25
system (as mentioned by Guo and Jiang, 2008), it is interesting to notice that, for the study area, the intra-annual (monthly) changes in the river’s discharge are greater
(from −26 to 42 % for A2 and −25 to 25 % for B2) as compared to the mean
sea-sonal and annual discharge changes. The climate change impact study (using the
HESSD
9, 3339–3384, 2012Impact of climate change on sediment
yield in the Mekong River Basin
B. Shrestha et al.
Title Page
Abstract Introduction
Conclusions References
Tables Figures
◭ ◮
◭ ◮
Back Close
Full Screen / Esc
Printer-friendly Version
Interactive Discussion
Discussion
P
a
per
|
Dis
cussion
P
a
per
|
Discussion
P
a
per
|
Discussio
n
P
a
per
|
HadCM3 GCM) conducted by Kingston et al. (2011) in the Mekong River basin simi-larly observed greater changes in mean monthly river discharge (from−16 to 55 %). Such changes may be attributed to the complex and contrasting sub-basin changes in precipitation and evaporation, as outlined by Kingston et al. (2011). These results suggest that it is important for planners to keep in mind the monthly changes when
5
devising any water management strategies for the future.
Figure 8a and b show the mean annual sediment yield cycle for the present and future climatic conditions for scenarios A2 and B2 and relative changes in the mean monthly sediment for the future. For the period of 2011–2040, the A2 scenario pre-dicts a change in the mean monthly sediment yield that follows the same trend as
10
the discharge with the largest percentage change for April (51 %). For the 2041–2070 period, the sediment yield decreases during March and increases during November– December, with the maximum change taking place in August (61 %); this being in con-trast to the discharge change in same period. The change in intra-annual (monthly) sediment follows the same trend as discharge for the period of 2011–2040 for the B2
15
scenario. However, for the 2041–2070 period, the decrease in sediment yields by 26 % in March and the biggest change for September (almost 32 %) is observed in contrast to mean monthly discharge variations. Overall, the mean annual sediment cycle fol-lows the trend of the mean annual discharge cycle. Streamflow increase in August by 16–26 % and 11–16 % for A2 and B2 scenario (respectively) is predicted to increase
20
sediment yields by 34–61 % and 23–32 % (respectively). Further, it is interesting to no-tice that the intra-annual (monthly) changes in sediment yield range from−20 to 61 % for A2 and−53 to 35 % for B2, which are higher than the corresponding changes in discharge. This implies that the impact of climate changes on sediment yield is greater than on streamflow because sediment yield increases more than linearly with the flow
25
(Naik and Jay, 2011).
HESSD
9, 3339–3384, 2012Impact of climate change on sediment
yield in the Mekong River Basin
B. Shrestha et al.
Title Page
Abstract Introduction
Conclusions References
Tables Figures
◭ ◮
◭ ◮
Back Close
Full Screen / Esc
Printer-friendly Version
Interactive Discussion
Discussion
P
a
per
|
Dis
cussion
P
a
per
|
Discussion
P
a
per
|
Discussio
n
P
a
per
|
the A2 scenario, the increase in the wet season’s sediment (24 to 39 %) and the dry season’s sediment (12 to 28 %) will result in a 25 to 36 % rise in the annual sediment yield for the basin. Similarly, a 15 to 22 % rise in the annual sediment yield is predicted due to changes in sediment yields in the wet (17 to 23 %) and dry (−4 to 12 %) seasons under scenario B2. The medians, 25th percentiles, 75th percentiles and maximum
5
values of annual sediment loads are also estimated to increase in the future, as shown in a box-whisker plot (Fig. 9). The results imply an overall increase in sediment loss from the basin in the future.
An increase in flow discharge will, in general, increase the mean monthly, seasonal and annual sediment loads, while a decrease in the flow discharge will decrease the
10
sediment loads for all scenarios, which is similar to the findings of the climate change impact study conducted by Phan et al. (2011) in the Song Cau watershed in northern Vietnam. Most interestingly, for the 2041–2070 A2 scenario, in the months of Novem-ber and DecemNovem-ber, sediment yield seems to increase even though water discharge de-creases. For this period, the rainfall also decreases but temperature increases (+1.6◦
15
and+1.9◦C respectively). This suggests that the rise in temperature may increase soil
loss. Through its influence on vegetation (Zhu et al., 2008; Li et al., 2011) and weath-ering (Zhu et al., 2011), increased temperature may aggravate the soil erosion rate, and consequently increase sediment flux. The study conducted by Li et al. (2011) in the lower Pearl River basin in China reported that an increase in temperature by 3◦C
20
increases the sediment load by almost 14 %. For the 2041–2070 phase of the B2 sce-nario, during March, although discharge increases, the sediment decreases. For this month, both rainfall and temperature increase. This indicates that increased rainfall does not necessarily increase soil loss. For March, it is interesting to note that a 47 % increase in rainfall and nearly+2◦C shift in mean temperature results in less than 1 %
25
increase in streamflow. This clearly proves the significant influence of increased evap-oration in the hydrological process of a basin. The decrease in sediment flux may be due to the significant influence of increased evapotranspiration under warmer climate, as mentioned by Bogaart et al. (2003) in their study. Increased evapotranspiration may
HESSD
9, 3339–3384, 2012Impact of climate change on sediment
yield in the Mekong River Basin
B. Shrestha et al.
Title Page
Abstract Introduction
Conclusions References
Tables Figures
◭ ◮
◭ ◮
Back Close
Full Screen / Esc
Printer-friendly Version
Interactive Discussion
Discussion
P
a
per
|
Dis
cussion
P
a
per
|
Discussion
P
a
per
|
Discussio
n
P
a
per
|
offset and over-weigh increased rainfall and consequently reduce the erosion poten-tial of rain. Nevertheless, the results indicate that the change of sediment yield and discharge in response to climate change do not always happen in the same direction. Changes in temperature and rainfall will affect the sediment transport capacity and erosion rate. This change in the sediment transport capacity and erosion rate causes
5
changes in the sediment flux in a river, which is also outlined by Zhu et al. (2008). Figure 10a shows the SWAT simulated sediment yield from various sub-basins of the study area for present climatic conditions. It is interesting to note that the northern and western sub-basins contribute most to sediment yield with an annual yield of more than 5 tons ha−1yr−1. Relative changes in annual average sediment yield from various
sub-10
basins due to climate change are presented in Fig. 10b. Under scenario A2, the change varies from−10 to 80 %, with an increase of more than 20 % for most of the sub-basins. Interestingly, the lowermost sub-basins (18 and 19) show decreased sediment loss for both periods. Similarly, the change varies from−30 to 45 % for the B2 scenario. The southern sub-basins show decreased sediment yield. In conclusion, the change in
15
precipitation and temperature is predicated to increase the sediment yield from most of the sub-basins, with the highest rise in northern sub-basins. Sediments are very important for the riverine ecosystems because of the attached nutrients. Increased sediments might change the nutrient loading into the river system, which can have significant implication on the water quality as well as the ecosystems.
20
Figure 11 is the longitudinal profile of the main stream, showing the locations of fu-ture reservoirs and their elevation relative to the basin outlet’s datum. It also shows the averages of simulated annual sediment load (1971–2000) at future reservoir stations and changes in future sediment yield as compared to the 1971–2000 period under sce-narios A2 and B2. Increase in mean annual sediment yield in each reservoir location
25
HESSD
9, 3339–3384, 2012Impact of climate change on sediment
yield in the Mekong River Basin
B. Shrestha et al.
Title Page
Abstract Introduction
Conclusions References
Tables Figures
◭ ◮
◭ ◮
Back Close
Full Screen / Esc
Printer-friendly Version
Interactive Discussion
Discussion
P
a
per
|
Dis
cussion
P
a
per
|
Discussion
P
a
per
|
Discussio
n
P
a
per
|
change in the future can have great implications for planned reservoirs and related sed-iment management. Increased sedsed-iment loads can intensify many problems linked to accelerated loss of reservoir storage through sedimentation and siltation or river chan-nels and water distribution systems, an associated loss of conveyance capacity and increased turbidity of river water (Walling, 2008). Loss of reservoir storage can reduce
5
the operational life and power generation capacity of the dam. This implies that there is a strong need for basin-wide sediment management strategies for the sustainability of the planned dams as well as for a robust river system.
5 Conclusions
This study assesses the impact of climate change on sediment yield in the Nam Ou
10
basin located in the northern part of Laos. The regional climate model predictions show that, on a seasonal and annual scale, there is an overall increase in both temperature and precipitation in the future for both A2 and B2 scenarios. However, the changes in monthly precipitation show both, increasing and decreasing, trends.
A SWAT model was used to simulate the present and future changes in sediment
15
yield in the study basin. Calibration, validation and uncertainty analyses for both, dis-charge and sediment, suggest that the SWAT model can be applied to simulate future changes in discharge and sediment yields due to eventual climate change. The delta change method or the change factor method was used as a downscaling method to generate future temperature and precipitation. Simulation results reveal that both
sea-20
sonal and annual discharge will increase in the future, leading to an increased sediment yield. Variability was observed in the intra-annual (monthly) change of streamflow and sediment which can be attributed to the variable change in inter-annual rainfall. In gen-eral, higher discharge and sediment flux are expected during the wet season although the percentage changes were observed to be higher in the dry months. The climate’s
25
impact on sediment yield is larger than on streamflow and the changes do not always
HESSD
9, 3339–3384, 2012Impact of climate change on sediment
yield in the Mekong River Basin
B. Shrestha et al.
Title Page
Abstract Introduction
Conclusions References
Tables Figures
◭ ◮
◭ ◮
Back Close
Full Screen / Esc
Printer-friendly Version
Interactive Discussion
Discussion
P
a
per
|
Dis
cussion
P
a
per
|
Discussion
P
a
per
|
Discussio
n
P
a
per
|
happen in the same direction. Overall results indicate that sediment loss from the basin will rise in the future.
The results of this study may be helpful to development planners, decision mak-ers and other stakeholdmak-ers when planning and implementing appropriate basin-wide sediment management strategies as well as water management strategies to adapt to
5
climate change. Moreover, the statistics of future sediment flux will be quite signifi-cant for hydropower developers as they will enable planners to reassess the design, operation and sedimentation of future dams. Although the impact of sedimentation in future reservoirs in the Mekong and its downstream is an important issue, an accurate assessment of the same has been a big challenge due to the scarcity and scantiness
10
of the observed data on sediment fluxes so far. Hence, the results of this study will also help planners devise more effective reservoir sediment management strategies.
The limitation of this study is that the uncertainties of RCM and erosion modeling have not been taken into account and landuse in the basin is assumed to remain the same in the future. Moreover, the change factor method used in this study does not
15
modify the temporal and spatial structure of precipitation data (Diaz-Nieto and Wilby, 2005); hence, the changes in variance of future climate variables are not reflected in the paper.
Acknowledgements. The research presented in this paper is part of the PRoACC (Post-doctoral Programme on Climate Change Adaptation in the Mekong River basin) programme
20
funded by the Netherlands Ministry of Development Cooperation (DGIS) through the UNESCO-IHE Partnership Research Fund. It was carried out jointly with UNESCO-UNESCO-IHE and Asian Insti-tute of Technology, Thailand. It has not been subjected to peer and/or policy review by DGIS or UNESCO-IHE, and, therefore, does not necessarily reflect the views of these institutions. The authors would like to extend their appreciation to the Mekong River Commission for providing
25
HESSD
9, 3339–3384, 2012Impact of climate change on sediment
yield in the Mekong River Basin
B. Shrestha et al.
Title Page
Abstract Introduction
Conclusions References
Tables Figures
◭ ◮
◭ ◮
Back Close
Full Screen / Esc
Printer-friendly Version
Interactive Discussion
Discussion
P
a
per
|
Dis
cussion
P
a
per
|
Discussion
P
a
per
|
Discussio
n
P
a
per
|
References
Abbaspour, K. C., Johnson, C. A., and Van Genuchten, M. T.: Estimating uncertain flow and transport parameters using a sequential uncertainty fitting procedure, Vadose Zone J., 3, 1340–1352, 2004.
Abbaspour, K. C., Yang, J., Maximov, I., Siber, R., Bogner, K., Mieleitner, J., Zobrist, J., and
5
Srinivasan, R.: Modelling hydrology and water quality in the Pre-Alpine/Alpine Thur water-shed using SWAT, J. Hydrol., 333, 413–430, 2007.
Akhtar, M., Ahmad, N., and Booij, M. J.: The impact of climate change on the water resources of Hindukush-Karakorum-Himalaya region under different glacier coverage scenarios, J. Hy-drol., 355, 148–163, 2008.
10
Arnold, J. G., Allen, P. M., and Bernhardt, G.: A comprehensive surface-groundwater flow model, J. Hydrol., 142, 47–69, 1993.
Arnold, J. G., Williams, J. R., and Maidment, D. R.: Continuous-time water and sediment routing model for large basins, J. Hydraul. Eng., 121, 171–183, 1995.
Arnold, J. G., Srinivasan, R., Muttiah, R., and Willams, J. R.: Large area hydrological modeling
15
and assessment part I: model development, J. Am. Water Resour. Assoc., 34, 73–89, 1998. Babel, M. S., Shrestha, B., and Perret, S.: Hydrological impact of biofuel production: A case
study of the Khlong Phlo Watershed in Thailand, Agr. Water Manage., 101, 8–26, 2011. Benaman, J., Christine, A. S., and Douglas, A. H.: Calibration and validation of soil and water
assessment tool on an agricultural watershed in upstate New York, J. Hydrol. Eng.-ASCE,
20
10, 363–374, 2005.
Bogaart, P. W., Van Balen, R. T., Kasse, C., and Vandenberghe, J.: Process-based modelling of fluvial system response to rapid climate change – I: model formulation and generic appli-cations, Quaternary Sci. Rev., 22, 2077–2095, 2003.
Boorman, D. B.: Climate, Hydrochemistry and Economics of Surface-water Systems (CHESS):
25
adding a European dimension to the catchment modeling experience developed under LOIS, Sci. Total Environ., 314–316, 411–437, 2003.
Chen, J., Brissette, F. P., and Leconte, R.: Uncertainty of downscaling method in quantifying the impact of climate change on hydrology, J. Hydrol., 401, 190–202, 2011.
Diaz-Nieto, J. and Wilby, R. L.: A comparison of statistical downscaling and climate change
30
factor methods: impacts on low flows in the river Thames, United Kingdom, Climatic Change, 69, 245–268, 2005.
HESSD
9, 3339–3384, 2012Impact of climate change on sediment
yield in the Mekong River Basin
B. Shrestha et al.
Title Page
Abstract Introduction
Conclusions References
Tables Figures
◭ ◮
◭ ◮
Back Close
Full Screen / Esc
Printer-friendly Version
Interactive Discussion
Discussion
P
a
per
|
Dis
cussion
P
a
per
|
Discussion
P
a
per
|
Discussio
n
P
a
per
|
Eastham, J., Mpelasoka, F., Mainuddin, M., Ticehurst, C., Dyce, P., Hodgson, G., Ali, R., and Kirby, M.: Mekong River Basin Water Resources Assessment: Impacts of Climate Change, CSIRO: Water for a Healthy Country National Research Flagship, CSIRO, Australia, 2008. Fowler, H. J., Blenkinsop, S., and Tebald, C.: Linking climate change modelling to impacts
stud-ies: recent advances in downscaling techniques for hydrological modeling, Int. J. Climatol.,
5
27, 1547–1578, 2007.
Green, W. H. and Ampt, G. A.: Studies on soil physics, 1. The flow of air and water through soils, J. Agr. Sci., 4, 11–24, 1911.
Guo, H., Hu, Q., and Jiang, T.: Annual and seasonal streamflow responses to climate and land-cover changes in the Poyang Lake basin, China, J. Hydrol., 355, 106–122, 2008.
10
Hanratty, M. P. and Stefan, H. G.: Simulating climate change effects in a Minnesota agricultural watershed, J. Environ. Qual., 27, 1524–1532, 1998.
Hargreaves, G. L., Hargreaves, G. H., and Riley, J. P.: Agricultural benefits for Senegal River Basin, J. Irrig. Drain. Eng., 111, 113–124, 1985.
Hay, L. E., Wilby, R. L., and Leavesly, H. H.: Comparison of delta change and downscaled GCM
15
scenarios for three mountainous basins in the United States, J. Am. Water Resour. Assoc., 36, 387–397, 2000.
Hoanh, C. T., Jirayoot, K., Lacombe, G., and Srinetr, V.: Impact of climate change and develop-ment on Mekong flow regime, First assessdevelop-ment-2009, MRC Technical Paper No. 29, Mekong River Comission, Vientiane, Lao PDR, 2010.
20
IPCC – Intergovernmental Panel on Climate Change: Climate change: AR4 synthesis report, Cambridge University Press, Cambridge, 2007.
Ishidaira, H., Ishikawa, Y., Funada, S., and Takeuchi, K.: Estimating the evolution of vegetation cover and its hydrological impact in the Mekong River basin in the 21st century, Hydrol. Process., 22, 1395–1405, 2008.
25
Jackson, W. L., Gebhardt, K., and Haveren, B. P. V.: Use of the modified universal soil loss equation for average annual sediment yield estimates on small rangeland drainage basin, in: Symposium on Drainage Basin Sediment Delivery, IASH, Albuquerque, New Mexico, USA, 1986.
Johnson, C. W., Gordon, N. D., and Hanson, C. L.: North-west rangeland sediment yield
anal-30
ysis by the MUSLE, T. Am. Soc. Agr. Biol. Eng., 26, 1889–1895, 1986.
HESSD
9, 3339–3384, 2012Impact of climate change on sediment
yield in the Mekong River Basin
B. Shrestha et al.
Title Page
Abstract Introduction
Conclusions References
Tables Figures
◭ ◮
◭ ◮
Back Close
Full Screen / Esc
Printer-friendly Version
Interactive Discussion
Discussion
P
a
per
|
Dis
cussion
P
a
per
|
Discussion
P
a
per
|
Discussio
n
P
a
per
|
Kiem, A. S., Ishidaira, H., Hapuarachchi, H. P., Zhou, M. C., Hirabayahi, Y., and Takeuchi, K.: Future hydroclimatology of the Mekong River basin simulated using the high-resolution Japan Meteorological Agency (JMA) AGCM, Hydrol. Process., 22, 1382–1394, 2008. Kingston, D. G., Thompson, J. R., and Kite, G.: Uncertainty in climate change
projec-tions of discharge for the Mekong River Basin, Hydrol. Earth Syst. Sci., 15, 1459–1471,
5
doi:10.5194/hess-15-1459-2011, 2011.
Li, Y., Chen, B.-M., Wang, Z.-G., and Peng, S.-L.: Effects of temperature change on water discharge, and sediment and nutrient loading in the lower Pearl River basin based on SWAT modeling, Hydrolog. Sci. J., 56, 68–83, 2011.
Lu, X. X.: Spatial variability and temporal change of water discharge and sediment flux in the
10
lower Jinsha tributary: impact of environmental changes, River Res. Appl., 21, 229–243, 2005.
Maurer, E. P., Adam, J. C., and Wood, A. W.: Climate model based consensus on the hydrologic impacts of climate change to the Rio Lempa basin of Central America, Hydrol. Earth Syst. Sci., 13, 183–194, doi:10.5194/hess-13-183-2009, 2009.
15
Mekong River Commission: Overview of the Hydrology of the Mekong Basin, Mekong River Commission, Vientiane, 2005.
Mekong River Commission: Integrated Basin Flow Management, Social Team 2006 Final Re-port, Water utilization program – environment program, Mekong River Commission, Vien-tiane, 2006.
20
Mekong River Commission: Existing, Under Construction and Planned/Proposed Hydropower Projects in the Lower Mekong Basin, September 2008, Map produced by the Mekong River Commission (MRC), available online at: http://www.mrcmekong.org/programmes/ hydropower.htm, last access: 10 September 2011, 2008.
Menzel, L. and Burger, G.: Climate change scenarios and runoffresponse in the Mulde
catch-25
ment (Southern Elbe, Germany), J. Hydrol., 267, 53–64, 2002.
Michael, A., Schmidt, J., Enke, W., Deutschlander, T., and Maltiz, G.: Impact of expected increase in precipitation intensities on soil loss results of comapritive model simulations, Catena, 61, 155–164, 2005.
Minville, M., Brissette, F., and Leconte, R.: Uncertainty of the impact of climate change on the
30
hydrology of a Nordic watershed, J. Hydrol., 358, 70–83, 2008.
Monteith, J. L.: Evaporation and the environment, in: The State and Movement of Water in Liv-ing Organisms, 19th Symposia of the Society for Experimental Biology, Cambridge University