AMTD
7, 3835–3861, 2014Quantifying amine permeation sources
N. A. Freshour et al.
Title Page
Abstract Introduction
Conclusions References
Tables Figures
◭ ◮
◭ ◮
Back Close
Full Screen / Esc
Printer-friendly Version Interactive Discussion
Discussion
P
a
per
|
D
iscussion
P
a
per
|
Discussion
P
a
per
|
Discuss
ion
P
a
per
|
Atmos. Meas. Tech. Discuss., 7, 3835–3861, 2014 www.atmos-meas-tech-discuss.net/7/3835/2014/ doi:10.5194/amtd-7-3835-2014
© Author(s) 2014. CC Attribution 3.0 License.
Atmospheric Measurement
Techniques
Open Access
Discussions
This discussion paper is/has been under review for the journal Atmospheric Measurement Techniques (AMT). Please refer to the corresponding final paper in AMT if available.
Quantifying amine permeation sources
with acid neutralization: calibrations and
amines measured in coastal and
continental atmospheres
N. A. Freshour, K. K. Carlson, Y. A. Melka, S. Hinz, B. Panta, and D. R. Hanson
Chemistry Department, Augsburg College, Minneapolis, MN 55454, USA
Received: 14 March 2014 – Accepted: 31 March 2014 – Published: 14 April 2014 Correspondence to: D. R. Hanson ([email protected])
AMTD
7, 3835–3861, 2014Quantifying amine permeation sources
N. A. Freshour et al.
Title Page
Abstract Introduction
Conclusions References
Tables Figures
◭ ◮
◭ ◮
Back Close
Full Screen / Esc
Printer-friendly Version Interactive Discussion
Discussion
P
a
per
|
D
iscussion
P
a
per
|
Discussion
P
a
per
|
Discuss
ion
P
a
per
|
Abstract
An acid titration method for quantifying amine permeation rates was used to calibrate an Ambient pressure Proton transfer Mass Spectrometer (AmPMS) that monitors am-bient amine compounds. The method involves capturing amines entrained in a N2flow by bubbling it through an acidified solution (∼10−5M HCl), and the amines are
quan-5
tified via changes in solution pH with time. Home-made permeation tubes had perme-ation rates (typically tens of pmol s−1) that depended on the type of amine and tubing and on temperature. Calibrations of AmPMS yielded sensitivities for ammonia, methyl amine, dimethyl amine, and trimethyl amine that are close to the sensitivity assuming a gas-kinetic, ion-molecule rate coefficient. The permeation tubes were also designed
10
to deliver a reproducible amount of amine to a flow reactor where nucleation with sul-furic acid was studied. The high proton affinity compound dimethyl sulfoxide (DMSO), linked to oceanic environments, was also studied and AmPMS is highly sensitive to it. AmPMS was deployed recently in two field campaigns and mixing ratios are reported for ammonia, alkyl amines, and DMSO and correlations between these species and
15
with particle formation events are discussed.
1 Introduction
Amines play an important role in atmospheric particle nucleation (Weber et al., 1996; Zhao et al., 2011; Ge et al., 2011; Zollner et al., 2012; Chen et al., 2012; Almeida et al., 2013) and they have a strong affinity for the particulate phase when it
con-20
tains strong acids (Angelino et al., 2001; Barsanti et al., 2009; Bzdek et al., 2010; Smith et al., 2010). Through their effects on the abundance and properties of aerosol, amines can influence cloud condensation nuclei which has important climate implica-tions. Techniques for measuring amines in the air include: (i) wet chemical techniques that trap gas-phase amines followed by their derivatization and then chromatographic
25
AMTD
7, 3835–3861, 2014Quantifying amine permeation sources
N. A. Freshour et al.
Title Page
Abstract Introduction
Conclusions References
Tables Figures
◭ ◮
◭ ◮
Back Close
Full Screen / Esc
Printer-friendly Version Interactive Discussion
Discussion
P
a
per
|
D
iscussion
P
a
per
|
Discussion
P
a
per
|
Discuss
ion
P
a
per
|
time-resolved measurements. Recent efforts using mass spectrometry (Eisele, 1988; Sellegri et al., 2005; Hanson et al., 2011; Yu and Lee, 2012) show real time capabilities for measuring gas-phase atmospheric amines. The development of mass spectrome-try techniques and other apparati require a continuous gas-phase source for reliable calibrations.
5
Permeation devices (Neuman et al., 2003; Brito and Zahn, 2011; Yu and Lee, 2012) can provide a continuous source of a desired substance, and homemade permeation tubes were constructed with various amine compounds and used to perform calibra-tions of AmPMS (Hanson et al., 2011). Base permeation rates were determined via trapping with an acid solution and quantification was accomplished with pH monitoring
10
during the acid-base titration.
AmPMS was deployed at Lewes DE in the summer of 2012 and in Lamont OK in the spring of 2013. Amine and ammonia abundances from these field studies are pre-sented. DMSO has been previously detected in a marine environment with a similar mass spectrometry system (Nowak et al., 2002) and a DMSO permeation tube was
15
constructed to calibrate a PTrMS (Hanson et al., 2009) and AmPMS. The mixing ratios of DMSO by AmPMS in a coastal environment are also presented. Ammonia and amine abundances and their correlations are compared and discussed. Also, the linkage be-tween particle formation events and gas-phase amine abundances are presented.
2 Experimental
20
Home-made permeation tubes (PTs) were constructed using 0.4 cm ID×0.6 cm OD Teflon (PTFE and FEP) tubing with the ends sealed with glass rods. The seals were made by inserting short lengths of glass rod (0.5 cm diameter) into the heated ends of a∼12 cm length of Teflon tubing, and quenching it in an ice water bath to facilitate the seal. A small amount (∼1 mL) of an amine-water solution was placed in the cooled
25
AMTD
7, 3835–3861, 2014Quantifying amine permeation sources
N. A. Freshour et al.
Title Page
Abstract Introduction
Conclusions References
Tables Figures
◭ ◮
◭ ◮
Back Close
Full Screen / Esc
Printer-friendly Version Interactive Discussion
Discussion
P
a
per
|
D
iscussion
P
a
per
|
Discussion
P
a
per
|
Discuss
ion
P
a
per
|
variable, believed to be due to poor end seals. There were differences in permeation rates of amines through PTFE and FEP with the general observation that permeation was better through PTFE than FEP.
The PTs were placed inside a∼20 cm length of 1/2 inch OD teflon tubing through which N2gas flowed, picking up amine vapor. The flow of N2was (i) 40–100 cm
3 min−1
5
(STP of 273 K and 1 atm, “sccm”) when used with the dynamic dilution system, (ii) up to several 1000 sccm when being used to calibrate AmPMS, and (iii) typically 20 sccm during acid-base titrations. Most experiments were performed with the permeation tube assembly at ambient temperature which generally varied less than 3◦C. Since per-meation/diffusion through plastics is known to be temperature dependent (e.g. Brito
10
and Zahn, 2011), a temperature-controlled aluminum enclosure around the permeation tube assembly was used in some experiments.
Ammonia, methyl amine, dimethyl amine and trimethyl amine were in the form of aqueous solutions (methyl, dimethyl, and trimethyl amine were ∼40 wt% in water, ammonia was ∼60 wt% in water, Sigma Aldrich and VWR). A permeation tube with
15
dimethyl sulfoxide was also fabricated and its permeation rate was deduced by com-parison to signals from a calibrated PTrMS (see Supplement).
2.1 Acid-base titration procedure
Amines were quantified by absorption into an acidified (starting pH of 5 or less) so-lution. Solutions were prepared using 18.2 MΩ deionized water (Milli-Q) with a small
20
amount of KCl (1 to 10 mM KCl) added to facilitate the pH measurement (VWR sympHony Epoxy, Gel Combination pH electrode or a Beckman–Coulter, Semi-Micro). Buffer solutions of pH 4 and 7 were used to calibrate the probes. Generally, a 40 (±1) mL aliquot of this solution was degassed of CO2etc. by bubbling N2gas (50– 100 sccm) whereupon the initial pH of 5-to-5.5 rose to 7 or higher. In some experiments
25
AMTD
7, 3835–3861, 2014Quantifying amine permeation sources
N. A. Freshour et al.
Title Page
Abstract Introduction
Conclusions References
Tables Figures
◭ ◮
◭ ◮
Back Close
Full Screen / Esc
Printer-friendly Version Interactive Discussion
Discussion
P
a
per
|
D
iscussion
P
a
per
|
Discussion
P
a
per
|
Discuss
ion
P
a
per
|
thoroughly to reduce the risk of contamination. Occasionally, more of the acid solution (up to an additional 0.5 mL in some runs) was needed to lower the pH to 5 possibly due to small amounts of basic contaminants; however the measured permeation rates were not noticeably affected.
Blank flows without a PT inline were also investigated to check for background base
5
levels (basic contaminants from surfaces etc.) Small increases in pH with time were observed but were not steady indicating an intermittent and decreasing source of base molecules consistent with a surface desorption rate that decreases with time. These pH changes were equivalent to a background rate of 0.1 to 1 pmol s−1. Background rates were observed to be higher than this when the gas-lines, flask and sealing materials
10
(Teflon, silicone, etc.) had been exposed to high levels of amine vapor: several pmol s−1 for time periods of an hour after which they decreased to pmol s−1 or less. Thorough cleaning of the flask and lines between runs and eliminating elastomers (silicone rubber seals) resulted in the best data, especially for low permeation rate tubes.
To check how well the solution scavenges the base, tandem experiments were
car-15
ried out with a second flask capturing any base in the effluent from the first flask (see the Supplement). The first flask was sealed (silicone rubber seal on the pH probe) so that the effluent gas from the first solution could be bubbled through the second so-lution. The pH of both solutions was monitored simultaneously. This tandem titration system verified that more than 95 % of the permeated ammonia was absorbed by the
20
first solution.
2.2 Addition of amines to AmPMS
Amines were introduced into AmPMS’ sampling line (a 1/4′′ tube between 30 and 100 cm in length) in several ways: (i) by entraining the small flow from the permeation tube into the sample flow, (ii) by placing the permeation tube in line with the sample
25
AMTD
7, 3835–3861, 2014Quantifying amine permeation sources
N. A. Freshour et al.
Title Page
Abstract Introduction
Conclusions References
Tables Figures
◭ ◮
◭ ◮
Back Close
Full Screen / Esc
Printer-friendly Version Interactive Discussion
Discussion
P
a
per
|
D
iscussion
P
a
per
|
Discussion
P
a
per
|
Discuss
ion
P
a
per
|
flowing through the AmPMS detection region (Zollner et al., 2012; Panta et al., 2012). The sample flow was either outdoor air or humidified N2(∼30 % RH, determined from the relative flows of fully humidified and of dry N2). Note that an additional length of 1/4′′OD tubing of up to 6 m length was needed (inlet line) when sampling outdoor air.
The sampling line arrangement for AmPMS has been changed from its initial
de-5
ployment (Hanson et al., 2011) so that the sample flow does not go through a three way valve before entering the instrument. Also gas cylinders are not required for field deployment as the ion source flow is taken from a catalytic converter. Details of this arrangement, the zero-ing procedure, and tests of a∼4 m long inlet line are presented in the Supplement.
10
Calibration data was treated by comparing the mixing ratio calculated from the per-meation rate and the total sample flow rate to the mixing ratio from AmPMS signals, assuming a high sensitivity. Signals were converted to mixing ratios using:
XMR=ln(1+sXH+/s0)/(N1 pptkt) (1)
15
wheresXH+ ands0are the signals due to analyte and reagent ions, respectively, when analyteX is present, k and t are the ion-molecule rate coefficient and drift time, re-spectively, andN1 pptis the number density for a mixing ratio of 1 pptv at ambient pres-sure and temperature. For low values of the ratio sXH+ over s0, a standard sensitivity for the instrumentStyp is given by assuming there is no breakup of the XH+ ion, and
20
k takes a value of 2×10⁻⁹cm3s−1: Styp=s0ktN1 ppt (Sunner et al., 1988; Viggiano et al., 1988; Hanson et al., 2011). The value oft, typically 1 ms, is set by the geometry of the drift region and the electric field. For typical conditions within the instrument, N1 ppt=2.45×10
7
cm−3pptv−1and Styp is 5 Hz pptv −1
fors0=10 5
Hz. At mixing ratios ≤1000 pptv, (1) simplifies to the following equation with less than a 5 % error:
25
XMR=sXH+/(s0N1 pptkt)=sXH+/Styp (2)
AMTD
7, 3835–3861, 2014Quantifying amine permeation sources
N. A. Freshour et al.
Title Page
Abstract Introduction
Conclusions References
Tables Figures
◭ ◮
◭ ◮
Back Close
Full Screen / Esc
Printer-friendly Version Interactive Discussion
Discussion
P
a
per
|
D
iscussion
P
a
per
|
Discussion
P
a
per
|
Discuss
ion
P
a
per
|
mass dependent ion throughput and detection by including a factor in Eqs. (1) and (2) in front of thesXH+ term (Hanson et al., 2011).
3 Results
3.1 Permeation rates
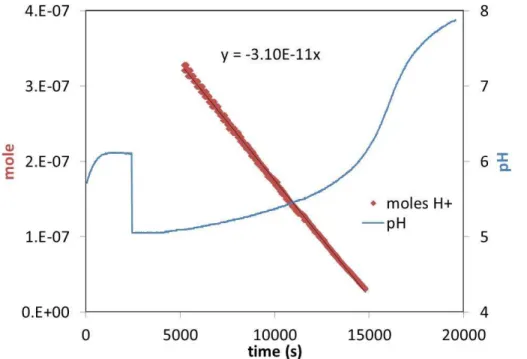
Figure 1 depicts a titration calibration of an ammonia PT showing pH (right axis) and
5
moles H+ (left axis) over time. Moles H+ vs. time are well fit by a linear line and the slope of the line is the moles of base per second captured by the solution, which is 31 pmol s−1 for the data in Fig. 1. The precision of the slope, assessed by manually altering the fitted line, is a few % for data with pH<6; most titrations resulted in data well described by a linear relationship with a precision better than∼10 %. A slowdown
10
in the uptake of the base by the solution for pH>6 was generally observed and the linear fits were restricted to pH<6. Some titrations yielded poor linear relationships with time; these were due to leaking supply lines or to insufficient time for the PT to reach steady state with the flow over it. Some runs were constricted to pH<5.5: poor behavior at higher pH was attributed to contaminated KCl. Abrupt changes in pH were
15
occasionally observed possibly due to contaminants introduced with the degas lines or pH probes. Recently, results from runs for pH≥5 have been erratic, and initial acid levels have been increased to pH∼4.3: runs take longer (up to 50 h) but the permeation rates using the pH<5 data have a lower variability than rates deduced from pH>5. The better performance may be due to the longer times of the runs but also to the
20
higher acid content which minimizes contaminant problems.
A number of PTs were used to calibrate AmPMS with rates that ranged from 3 pmol s−1 for trimethyl amine to 300 pmol s−1 for an ammonia PT. Individual PTs with the same compound can have quite different permeation rates, in part due to fabrica-tion differences. Permeation rates were observed to be time dependent and
temper-25
AMTD
7, 3835–3861, 2014Quantifying amine permeation sources
N. A. Freshour et al.
Title Page
Abstract Introduction
Conclusions References
Tables Figures
◭ ◮
◭ ◮
Back Close
Full Screen / Esc
Printer-friendly Version Interactive Discussion
Discussion
P
a
per
|
D
iscussion
P
a
per
|
Discussion
P
a
per
|
Discuss
ion
P
a
per
|
dependent, i.e. FEP vs. PTFE. Typical permeation rates are shown in Table 1. Some ammonia PTs constructed of PTFE had permeation rates up to 300 pmol s−1, much higher than the FEP rates in Table 1. FEP PTs with trimethyl and triethyl amine had very low permeation rates.
3.2 Addition to AmPMS
5
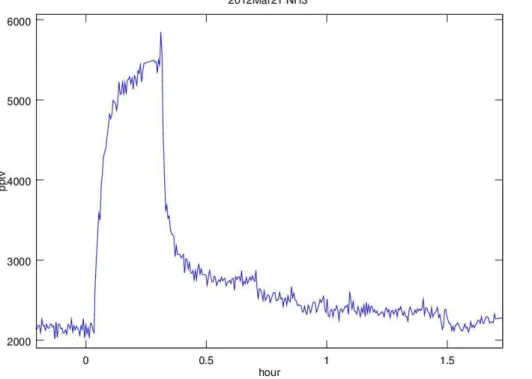
Shown in Fig. 2 is the gross AmPMS mixing ratio for NH3calculated from the signals using the typical sensitivity, Styp (background signal was not subtracted.) An addition of NH3 was initiated at∼0.05 h using a single stage dynamic dilution where 40 sccm of the 50 sccm flow over the PT was discarded and replaced by a flow of 40 sccm clean N2 (push) and then this flow was introduced into the sample line. AmPMS was
10
sampling at 2.1 sL min−1which, considering dilution, contained NH3at a mixing ratio of 3700 pptv. The signal rises to a net detection of about 3200 pptv at∼0.3 h whereupon NH3addition was terminated by setting the entire NH3perm tube flow to be discarded (the “push” gas remained). Degassing of NH3from surfaces (dilution system, sampling lines, and ion drift region) is apparent. The dilution system was taken offthe sampling
15
tee at about 1.4 h. For this calibration, the original configuration for AmPMS was used and sample gas passed through a three way valve before entering the ionization region which may adversely affect response times and surface displacement issues. See the Supplement for more on response times.
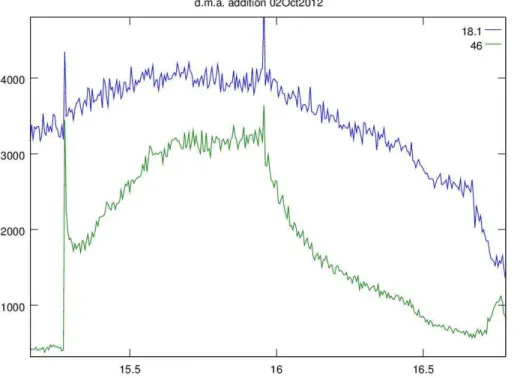
Figure 3 is a plot of mixing ratio vs. time for an addition of dimethyl amine to AmPMS
20
using the new sampling configuration (see the Supplement) first used for the Lewes campaign. The amine was introduced by placing a 13 pmol s−1 permeation tube in a flow of 6 sL min−1clean N2at 15.2 h. AmPMS subsampled this flow at∼1.5 L min
−1 , and it contained 2700 pptv dimethyl amine. After rising steadily for about 0.5 h, the net dimethyl amine mixing ratio reached 2500 pptv. A rise in the ammonia mixing ratio of
25
AMTD
7, 3835–3861, 2014Quantifying amine permeation sources
N. A. Freshour et al.
Title Page
Abstract Introduction
Conclusions References
Tables Figures
◭ ◮
◭ ◮
Back Close
Full Screen / Esc
Printer-friendly Version Interactive Discussion
Discussion
P
a
per
|
D
iscussion
P
a
per
|
Discussion
P
a
per
|
Discuss
ion
P
a
per
|
the mixing ratio declines to the 15 h level in about a half hour with about a 10 min decay constant. The instrument had not been cleaned after the Lewes campaign which is the likely reason for the slow response.
Tests with dimethyl and trimethyl amine were performed after the instrument was cleaned following the Oklahoma campaign and AmPMS showed a much quicker
re-5
sponse. Plots of two of these calibrations are shown in the Supplement and decays of the signal after the amines were removed were dominated by a∼20 s time constant. Also shown in the Supplement are experiments were methyl and trimethyl amines were added to outdoor air upstream of a ∼4 m length of the sample tube used in the field deployments. These experiments showed that there was a significant interaction of the
10
amines with the sample tube surfaces which tended to smooth out temporal variations in amine concentrations. Also shown in the Supplement are amine additions that show this interaction decreases significantly after cleaning the line.
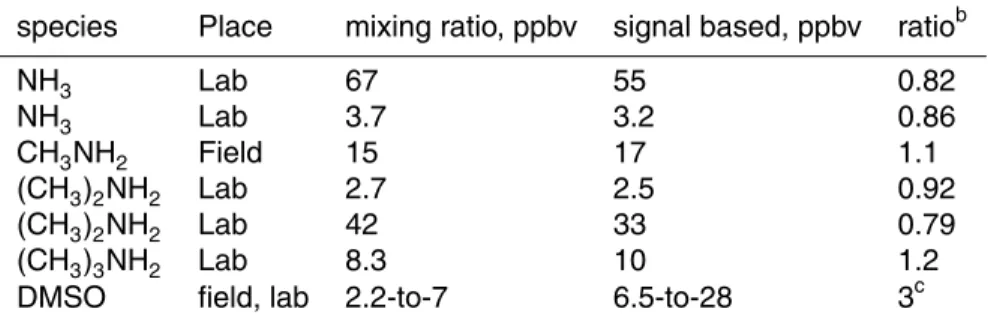
Calibrations of AmPMS for ammonia, methyl-, dimethyl-, and trimethyl amines show that the sensitivity is high for all of them. Shown in Table 2 is the signal-based mixing
15
ratio (Eq. 1) assuming a typical sensitivity (Styp) and the mixing ratio calculated from the permeation rate and the dilution factors. The last column is the ratio of the former to the latter. Note thats0=sNH+4+
P
ns(H2O)nH3O+ for the amines as they react with NH+4 (plus hydrates) as well as the water proton clusters;s0 for calculating the NH3 mixing ratio is the sum over only the water proton clusters signals. The results for NH3 and
20
the amines are consistent with the following assumptions: (i) a collisional ion molecule reaction rate coefficient of 2×10⁻⁹cm3s−1, (ii) an ion-molecule interaction time of about 1 ms, and (iii) little ion breakup or mass discrimination effects for the instrument.
DMSO is very efficiently detected by AmPMS. DMSO has a large dipole moment (Nelson et al., 1967) and proton affinity (Hunter and Lias, 1998) and the collisional rate
25
AMTD
7, 3835–3861, 2014Quantifying amine permeation sources
N. A. Freshour et al.
Title Page
Abstract Introduction
Conclusions References
Tables Figures
◭ ◮
◭ ◮
Back Close
Full Screen / Esc
Printer-friendly Version Interactive Discussion
Discussion
P
a
per
|
D
iscussion
P
a
per
|
Discussion
P
a
per
|
Discuss
ion
P
a
per
|
likely that the permeation rate of the DMSO tube was significantly underestimated (see the Supplement) and thus the Lewes data is presented using theStyp value to report mixing ratios.
Collisional dissociation during sampling of the ions was investigated and the signals for protonated amines were relatively insensitive to ion energy for typical conditions.
5
For example, a triethyl amine permeation tube was used to deliver triethyl amine to AmPMS while it was sampling outdoor air and the orifice and octopole bias voltages on AmPMS were varied. For typical conditions (30 and 12 V, respectively, at a pressure of∼0.25 torr) there was little evidence for ion breakup processes and even at aVorificeof 70 V significant signal at M·H+=102 u was still observed. We conclude that the alkyl
10
amines are detected without significant breakup for normal ion sampling conditions, consistent with the high sensitivity for detecting the alkyl amines at M·H+ discussed above.
3.3 Results from AmPMS field campaigns in Lewes, DE and Lamont, OK
3.3.1 Lewes, DE
15
Ammonia, alkyl amines, and DMSO were monitored by AmPMS in field campaigns conducted at Lewes, Delaware in July–August 2012 (see Bzdek et al., 2013) and at Lamont, Oklahoma in April–May 2013 (Southern Great Plains DOE site; http: //www.arm.gov/campaigns/sgp2013npfs). As mentioned previously and detailed in the Supplement, the sampling arrangement and zeroing procedure was changed from the
20
Atlanta 2009 (NCCN) campaign (Hanson et al., 2011). There were also slight diff er-ences in the sampling arrangement between these two campaigns: none of these changes significantly affected the sensitivity of AmPMS but they do affect the zero-ing procedure to obtain background signals. Also, the ion drift region was heated to ∼40◦C for the Lewes campaign to eliminate condensation which was not necessary in
25
AMTD
7, 3835–3861, 2014Quantifying amine permeation sources
N. A. Freshour et al.
Title Page
Abstract Introduction
Conclusions References
Tables Figures
◭ ◮
◭ ◮
Back Close
Full Screen / Esc
Printer-friendly Version Interactive Discussion
Discussion
P
a
per
|
D
iscussion
P
a
per
|
Discussion
P
a
per
|
Discuss
ion
P
a
per
|
Note that AmPMS does not distinguish isomers or isobaric species. Abundances de-rived from a signal at a given mass is assigned to a specific amine, however, keep in mind that this could include other species such as amides, which have been shown to be detected efficiently by AmPMS in chamber experiments (Hanson et al., 2011).
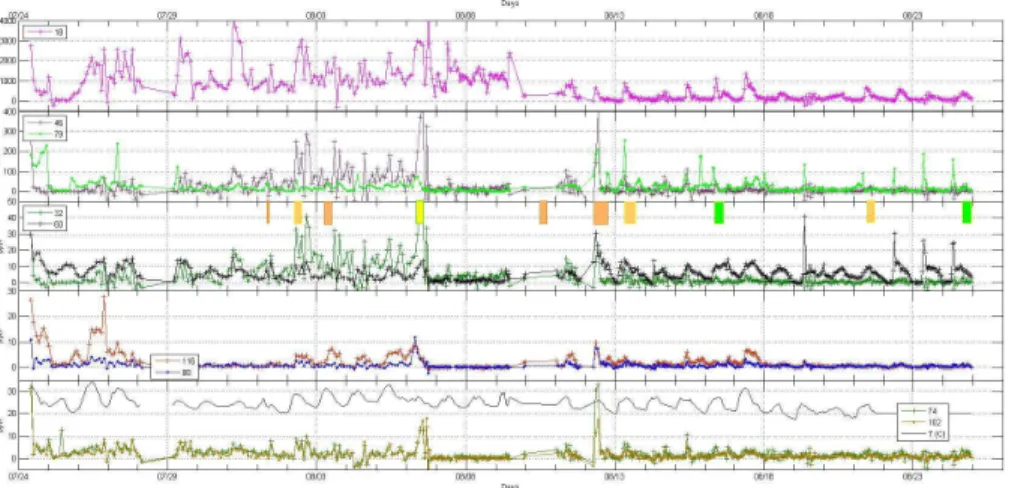
Levels of ammonia and alkyl amines were generally low in the semi-rural marine
5
environment of Lewes (DE), Fig. 4 (∼ hourly averages), compared to the urban and continental sites (Atlanta (Hanson et al., 2011) and OK, see Fig. 5). The semi-rural environment of Lewes had a five day period early in the campaign (1–5 August, Fig. 4) where methyl- and dimethyl-amines (averaging∼20 and∼100 pptv, respectively) were much higher than those observed at the urban and rural continental sites. A few
poul-10
try operations are within∼30 miles of the Lewes site. Trimethyl amine was in the 10 to 15 pptv range while the C4 and C5 amines were generally 5 ptv or less. After a few significant rain events (7–10 August), the weather changed with temperatures gener-ally cooler and humidity higher than the preceding week: methyl and dimethyl amines decreased to less than a few pptv and<10 pptv, respectively. On the other hand, TMA
15
levels rose after 11 August and it was generally the most abundant alkyl amine at ∼10 pptv during the day. Like the small amines, ammonia mixing ratios from the 9th of August on decreased significantly from those earlier in the campaign, perhaps also due to changes in the weather patterns.
Specific to Delaware is the detection of large amounts of DMSO (MH+=79 u).
Ma-20
rine plankton is known (Hines et al., 1993) to produce dimethyl sulfide (DMS), which in the atmosphere is oxidized to DMSO. Other DMSO sources have been postulated (Nowak et al., 2001). Note that the DMSO data in Fig. 4 was calculated usingStypdue to the uncertainty in the DMSO permeation rate. Spikes in DMSO occurred frequently and often at low tide and/or sunrise. The spikes in DMSO on 19, 22, 23, and 24 August
25
AMTD
7, 3835–3861, 2014Quantifying amine permeation sources
N. A. Freshour et al.
Title Page
Abstract Introduction
Conclusions References
Tables Figures
◭ ◮
◭ ◮
Back Close
Full Screen / Esc
Printer-friendly Version Interactive Discussion
Discussion
P
a
per
|
D
iscussion
P
a
per
|
Discussion
P
a
per
|
Discuss
ion
P
a
per
|
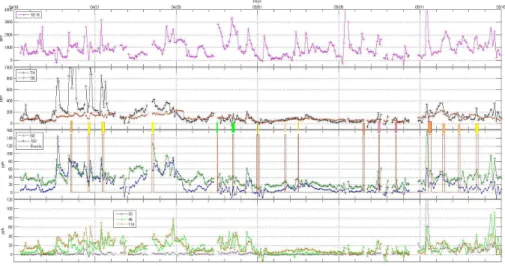
3.3.2 Lamont, OK
AmPMS was deployed in Oklahoma at the Atmospheric Radiation Measurement (ARM) facility between 16 April 2013 and 21 May 2013. Figure 5 shows the 2 h average mixing ratios of ammonia and the alkyl amines detected in the spring of 2013 in Oklahoma. The most abundant amines were the 4 and 5 carbon compounds at 74 u and 88 u
5
(or the isobaric amides.) These two sets of species often reached levels of several hundred pptv and spikes on 74 u reached ∼1 ppbv. Even the C6 and C7 amines (or amides, possibly oxidation products of the C4 and C5 amines) reached 50 pptv. On the other hand, the abundances of the smaller amines were relatively low: methyl amine was generally a few pptv or less while dimethyl amine and trimethyl amine abundances
10
were typically 20 and 50 pptv, respectively.
Occasionally, amines with high background signals had artifact spikes (see the nega-tive values) when abundances were small compared to backgrounds and uncertainties in backgrounds were high. The Supplement presents details on how the background data was obtained during these times. This procedure was instigated to address
stick-15
ing to surfaces within the system and the zeroing tubing. Also shown in the Supplement are amine specific time lags of∼10-to-60 min due to the 4 to 6 m inlet line. Therefore the Lewes and Oklahoma data are rendered as 1 or 2 h averages, which is the interval between background determinations. Note that for the Lewes data there was little dif-ference in the results from the two zeroing procedures and the normal procedure was
20
used most of the time. The Oklahoma data was split about even between the two pro-cedures and a possible bias due to insufficient time for AmPMS to reach background levels is discussed in the Supplement. This potential under-measurement error is esti-mated to be 30 % or less and applies to data obtained with the alternate procedure.
3.4 Correlations and comparisons of amine measurements
25
AMTD
7, 3835–3861, 2014Quantifying amine permeation sources
N. A. Freshour et al.
Title Page
Abstract Introduction
Conclusions References
Tables Figures
◭ ◮
◭ ◮
Back Close
Full Screen / Esc
Printer-friendly Version Interactive Discussion
Discussion
P
a
per
|
D
iscussion
P
a
per
|
Discussion
P
a
per
|
Discuss
ion
P
a
per
|
abundances (C3 and greater) in OK were correlated throughout the study (R2of∼0.4) suggesting they had similar sources while methyl and dimethyl amines were not well correlated to each other (R2=0.20) or to other amines. This contrasts with the Lewes data where the relationship between the smallest two amines was pronounced and well correlated (R2=0.8); also in Lewes the C4 through C7 amines were somewhat
5
correlated (R2∼0.3) while trimethyl amine had little correlation with other amines. This suggests different sources for the large vs. small amines in Lewes and probably an-other source altogether for trimethyl amine. Correlations of the amines with ammonia were generally weak except for the small amines and one large one: in Oklahoma, the largestR2was∼0.3 for both dimethyl and the C7 amines with ammonia, and in Lewes,
10
the methyl and dimethyl amines were somewhat correlated with ammonia (R2 of 0.38 and 0.24, resp.)
Ammonia was at the single digit ppbv level (1–2, with occasional spikes to 4 ppbv) at both the OK and DE sites yet there were extended time periods where very little ammo-nia was present, a few hundred pptv or less. This contrasts with Atlanta measurements
15
where ammonia levels rarely decreased below several hundred pptv (see Nowak et al., 2006, 2007). Signals at 79 u were very small in Oklahoma suggesting very little DMSO was present. Shown in Table 3 are the average amine/amide abundances observed at these three sites as well as in urban air for a three week period in Minneapolis. See Kieloaho et al. (2013) for additional comparisons of amines measured at urban and
20
rural sites.
A significant temperature dependence for trimethyl amine abundances has been re-ported in earlier studies in the summertime urban Atlanta (Hanson et al., 2011) and in the fall Kent OH boundary layer (Yu and Lee, 2012). In contrast, the spring time Oklahoma measurements show no correlation with temperature for the C3 and larger
25
AMTD
7, 3835–3861, 2014Quantifying amine permeation sources
N. A. Freshour et al.
Title Page
Abstract Introduction
Conclusions References
Tables Figures
◭ ◮
◭ ◮
Back Close
Full Screen / Esc
Printer-friendly Version Interactive Discussion
Discussion
P
a
per
|
D
iscussion
P
a
per
|
Discussion
P
a
per
|
Discuss
ion
P
a
per
|
to the C6 amine.) Little or no temperature dependence was also reported for the C2 and C3 amines in the summertime boreal forest (Kieloaha et al., 2013).
Diurnal behavior for the C3 and C6 amines in Atlanta (Hanson et al., 2011) showed late afternoon averages that were about 5 and 8 times early morning averages and most amines in Lewes and Oklahoma also exhibited diurnal behavior but the behavior
5
was weaker than the most abundant amines (C3 and C6) in Atlanta. The behavior of the amines in Oklahoma had the weakest diurnal patterns of the three sites.
In Lewes, all the amines were about a factor of two or three larger from 11:00 to 15:00 LST than their early morning averages (00:00–04:00 LST.) In Oklahoma, daytime hourly means (12:00 to 16:00) for the C3, C5 and C6 amines were about+50,+0 %,
10
+30 % higher, respectively, than the early morning hourly means (00:00 to 04:00 LST). The C1, C2, C4 and C7 amines had somewhat larger variations: they were all about a factor of two larger in the early afternoon than in the early morning, similar to what was observed in Lewes. This set of amines included the least (32 u) and most (74 u) abundant amines.
15
The diurnal behavior of ammonia in Oklahoma was the most distinct: its hourly me-dian was∼500 pptv from midnight to 8 a.m., rose quickly to 1400 pptv by 11 a.m. and dropped slowly to 600 pptv by 10 p.m. Plots of the diurnal behavior (hourly means, me-dians and select percentiles) of the amines and ammonia for the Oklahoma campaign are presented in the Supplement. Hourly medians showed smaller variations over the
20
course of the day than did the means.
Particle formation events indicated in the figures generally occur in the early after-noon at both sites and they are correlated with amine abundances. More information on the conditions of some of the Lewes events can be found in Bzedek et al. (2013) and details of the Oklahoma events will be presented in forthcoming publications
25
AMTD
7, 3835–3861, 2014Quantifying amine permeation sources
N. A. Freshour et al.
Title Page
Abstract Introduction
Conclusions References
Tables Figures
◭ ◮
◭ ◮
Back Close
Full Screen / Esc
Printer-friendly Version Interactive Discussion
Discussion
P
a
per
|
D
iscussion
P
a
per
|
Discussion
P
a
per
|
Discuss
ion
P
a
per
|
The more numerous and generally stronger nucleation events observed in Oklahoma compared to Delaware is apparently driven by the much higher abundance of amines. This highlights the role of amines in particle formation: amines at several hundred pptv levels can induce significant nucleation events even at low sulfuric acid abundances.
4 Conclusions
5
Calibrations of AmPMS for alkyl amines, quantitatively tied to acid-base titrations, show that AmPMS is as sensitive to amines as it has been assumed to be. The results of recent field campaigns show that the abundance of alkyl amines have a wide variability from site to site and temporally: they can range from single digit levels up to 100 s of pptv for some amines. Particle formation events are frequently concomitant with
10
enhanced amine levels (tens to hundreds of pptv) while some events occur at levels as low as single digit pptv, especially when sulfuric acid concentrations exceed 107cm−3. In contrast to the other sites discussed here, the Lewes, DE, site had at times methyl and dimethyl amines as the most abundant amines; this may be due to nearby poultry operations. DMSO was observed at this marine site and spikes in DMSO were
accom-15
panied by spikes in trimethyl amine suggesting a similar cause (low tide) or possibly a similar source.
The 4 to 6 m long sampling lines led to significant delays in the determination of amine levels; for some amines such as methyl amine and ammonia this delay grew to roughly an hour during the extent of the∼5 week campaigns. Shortening AmPMS’
20
AMTD
7, 3835–3861, 2014Quantifying amine permeation sources
N. A. Freshour et al.
Title Page
Abstract Introduction
Conclusions References
Tables Figures
◭ ◮
◭ ◮
Back Close
Full Screen / Esc
Printer-friendly Version Interactive Discussion
Discussion
P
a
per
|
D
iscussion
P
a
per
|
Discussion
P
a
per
|
Discuss
ion
P
a
per
|
Supporting information
Additional information is available on AmPMS sampling arrangement, zeroing proce-dures, response times and sampling line issues, calibration with DMSO, other ions of interest, amines diurnal behavior and correlation plots, ion breakup processes, and per-meation tube and acid-base system diagnostics. AmPMS data from the field studies in
5
Atlanta, Lewes, and Oklahoma are available upon request ([email protected]). The Oklahoma data set will also be available at DOE-ARM archives in late 2014.
Supplementary material related to this article is available online at http://www.atmos-meas-tech-discuss.net/7/3835/2014/
amtd-7-3835-2014-supplement.pdf.
10
Acknowledgements. Advice from V. Feng on the care and use of pH probes and caution re-garding pH measurements in the pH 6 range are gratefully acknowledged. P. McMurry of the University of Minnesota supplied particle formation data depicted in Figs. 4 and 5. This work was supported by NSF grants nos. 0943721 and 1068201 and also by the US DOE Office of Science, Biology and Environmental Research.
15
References
Almeida, J., Schobesberger, S., Kurten, A., Ortega, I. K., Kupiainen-Maatta, O., Praplan, A. P., Adamov, A., Amorim, A., Bianchi, F., Breitenlechner, M., David, A., Dommen, J., Donahue, N. M., Downard, A., Dunne, E., Duplissy, J., Ehrhart, S., Flagan, R. C., Franchin, A., Guida, R., Hakala, J., Hansel, A., Heinritzi, M., Henschel, H., Jokinen, T., Junninen, H., Kajos, M., Kan-20
AMTD
7, 3835–3861, 2014Quantifying amine permeation sources
N. A. Freshour et al.
Title Page
Abstract Introduction
Conclusions References
Tables Figures
◭ ◮
◭ ◮
Back Close
Full Screen / Esc
Printer-friendly Version Interactive Discussion
Discussion
P
a
per
|
D
iscussion
P
a
per
|
Discussion
P
a
per
|
Discuss
ion
P
a
per
|
Vaattovaara, P., Viisanen, Y., Virtanen, A., Vrtala, A., Wagner, P. E., Weingartner, E., Wex, H., Williamson, C., Wimmer, D., Ye, P. L., Yli-Juuti, T., Carslaw, K. S., Kulmala, M., Curtius, J., Baltensperger, U., Worsnop, D. R., Vehkamaki, H., and Kirkby, J.: Molecular understand-ing of sulphuric acid-amine particle nucleation in the atmosphere, Nature, 502, 359–363, doi:10.1038/nature12663, 2013.
5
Angelino, S., Suess, D. T., and Prather, K. A.: Formation of aerosol particles from reactions of secondary and tertiary alkylamines: characterization by aerosol time-of-flight mass spec-trometry, Environ. Sci. Technol., 35, 3130–3138, doi:10.1021/es0015444, 2001.
Barsanti, K. C., McMurry, P. H., and Smith, J. N.: The potential contribution of organic salts to new particle growth, Atmos. Chem. Phys., 9, 2949–2957, doi:10.5194/acp-9-2949-2009, 10
2009.
Brito, J. and Zahn, A.: An unheated permeation device for calibrating atmospheric VOC mea-surements, Atmos. Meas. Tech., 4, 2143–2152, doi:10.5194/amt-4-2143-2011, 2011. Bzdek, B. R., Ridge, D. P., and Johnston, M. V.: Amine exchange into ammonium bisulfate and
ammonium nitrate nuclei, Atmos. Chem. Phys., 10, 3495–3503, doi:10.5194/acp-10-3495-15
2010, 2010.
Bzdek, B. R., Horan, A. J., Pennington, M. R., DePalma, J. W., Zhao, J., Jen, C. N., Han-son, D. R., Smith, J. N., McMurry, P. H., and Johnston, M. V.: Quantitative and time-resolved nanoparticle composition measurements during new particle formation, Faraday Discuss., 165, 25–43, doi:10.1039/C3FD00039G, 2013.
20
Chen, M., Titcombe, M., Jiang, J., Jen, C., Kuang, C., Fischer, M. L., Eisele, F. L., Siep-mann, J. L., Hanson, D. R., Zhao, J., and McMurry, P. H.: Acid/base chemical reaction model for nucleation rates in the polluted atmospheric boundary layer, P. Natl. Acad. Sci. USA, 109, 18713–18718, doi:10.1073/pnas.1210285109, 2012.
Eisele, F. L.: First tandem mass spectrometric measurement of tropospheric ions, J. Geophys. 25
Res. D, 93, 716–724, 1988.
Ge, X., Wexler, A. S., and Clegg, S. L.: Atmospheric amines – Part I. A review, Atmos. Environ., 45, 524–546, doi:10.1016/j.atmosenv.2010.10.012, 2011.
Hanson, D. R., Koppes, M., Stoffers, A., Harsdorf, R., and Edelen, K.: Proton transfer mass spectrometry at 11 hPa with a circular glow discharge: sensitivities and applications, Int. J. 30
AMTD
7, 3835–3861, 2014Quantifying amine permeation sources
N. A. Freshour et al.
Title Page
Abstract Introduction
Conclusions References
Tables Figures
◭ ◮
◭ ◮
Back Close
Full Screen / Esc
Printer-friendly Version Interactive Discussion
Discussion
P
a
per
|
D
iscussion
P
a
per
|
Discussion
P
a
per
|
Discuss
ion
P
a
per
|
Hanson, D. R., McMurry, P. H., Jiang, J., Tanner, D., and Huey, L. G.: Ambient pressure proton transfer mass spectrometry: detection of amines and ammonia, Environ. Sci. Technol., 45, 8881–8888, doi:10.1021/es201819a, 2011.
Hines, M. E., Pelletier, R. E., and Crill, P. M.: Emissions of sulfur gases from marine and fresh-water wetlands of the Florida Everglades: rates and extrapolation using remote sensing, J. 5
Geophys. Res. D, 98, 8991–8999, doi:10.1029/92JD03019, 1993.
Hunter, E. P. L. and Lias, S. G.: Evaluated gas phase basicities and proton affinities of molecules: an update, J. Phys. Chem. Ref. Data, 27, 413–656, doi:10.1063/1.556018, 1998. Kieloaho, A. J., Hellen, H., Hakola, H., Manninen, H. E., Nieminen, T., Kulmala, M., and
Pih-latie, M.: Gas-phase alkylamines in a boreal Scots pine forest air, Atmos. Environ., 80, 369– 10
377, 2013.
Nelson Jr., R. D., Lide, D. R., and Maryott, A. A.: Selected values of electric dipole moments for molecules in the gas phase, Nat. Stand. Ref. Data Ser., Nat. Bur. Stand. (US), 10, 1–49, 1967.
Neuman, J. A., Ryerson, T. B., Huey, L. G., Jakoubek, R., Nowak, J. B., Simons, C., and Fehsen-15
feld, F. C.: Calibration and evaluation of nitric acid and ammonia permeation tubes by UV optical absorption, Environ. Sci. Technol., 37, 2975–2981, doi:10.1021/es026422l, 2003. Nowak, J. B., Davis, D. D., Chen, G., Eisele, F. L., Mauldin, III, R. L., Tanner, D. J.,
Cantrell, C., Kosciuch, E., Bandy, A., Thornton, D., and Clarke, A.: Airborne observations of DMSO, DMS, and OH at marine tropical latitudes, Geophys. Res. Lett., 28, 2201–2204, 20
doi:10.1029/2000GL012297, 2001.
Nowak, J., Huey, L., Eisele, F., Tanner, D., Mauldin, R., Cantrell, C., Kosciuch, E., and Davis, D.: Chemical ionization mass spectrometry technique for detection of dimethylsulfoxide and am-monia, J. Geophys. Res. D, 107, 4363, doi:10.1029/2001JD001058, 2002.
Nowak, J. B., Huey, L. G., Russel, A. G., Tian, D., Neuman, J. A., Orsini, D., Sjostedt, S., 25
Sullivan, A. P., Tanner, D. J., Weber, R. J., Nenes, A., Edgerton, E., and Fehsenfeld, F. C.: Analysis of urban gas phase ammonia measurements from the 2002 Atlanta Aerosl Nucle-ation and Real-Time CharacterizNucle-ation Experiment (ANARCHe), J. Geophys. Res. D, 111, D17308, 1–14, 2006.
Nowak, J. B., Neuman, J. A., Kozai, K., Huey, L. G., Tanner, D. J., Holloway, J. S., Ryerson, T. B., 30
AMTD
7, 3835–3861, 2014Quantifying amine permeation sources
N. A. Freshour et al.
Title Page
Abstract Introduction
Conclusions References
Tables Figures
◭ ◮
◭ ◮
Back Close
Full Screen / Esc
Printer-friendly Version Interactive Discussion
Discussion
P
a
per
|
D
iscussion
P
a
per
|
Discussion
P
a
per
|
Discuss
ion
P
a
per
|
Panta, B., Glasoe, W. A., Zollner, J. H., Carlson, K. K., and Hanson, D. R.: Computational fluid dynamics of a cylindrical nucleation flow reactor with detailed cluster thermodynamics, J. Phys. Chem. A, 116, 10122–10134, doi:10.1021/jp302444y, 2012.
Sellegri, K., Umann, B., Hanke, M., and Arnold, F.: Deployment of a ground-based CIMS ap-paratus for the detection of organic gases in the boreal forest during the QUEST campaign, 5
Atmos. Chem. Phys., 5, 357–372, doi:10.5194/acp-5-357-2005, 2005.
Smith, J. N., Barsanti, K. C., Friedli, H. R., Ehn, M., Kulmala, M., Collins, D. R., Scheck-man, J. H., Williams, B. J., and McMurry, P. H.: Observations of aminium salts in atmospheric nanoparticles and possible climatic implications, P. Natl. Acad. Sci. USA, 107, 6634–6639, doi:10.1073/pnas.0912127107, 2010.
10
Sunner, J., Nicol, G., and Kebarle, P.: Factors determining relative sensitivity of analytes in positive mode atmospheric pressure ionization mass spectrometry, Anal. Chem., 60, 1300– 1307, doi:10.1021/ac00164a012, 1988.
Viggiano, A. A., Morris, R. A., Dale, F., and Paulson, J. F.: Tropospheric reactions of H+(NH3)m(H2O)n with pyridine and picoline, J. Geophys. Res. D, 93, 9534–9538, 15
doi:10.1029/JD093iD08p09534, 1988.
Weber, R. J., Marti, J., McMurry, P. H., Eisele, F., Tanner, D. J., and Jefferson, A.: Measured atmospheric new particle formation rates. Implications for nucleation mechanisms, Chem. Eng. Commun., 151, 53–64, doi:10.1080/00986449608936541, 1996.
Yu, H. and Lee, S.: Chemical ionisation mass spectrometry for the measurement of atmospheric 20
amines, Environ. Chem., 9, 190–201, doi:10.1071/EN12020, 2012.
Zhao, J., Smith, J. N., Eisele, F. L., Chen, M., Kuang, C., and McMurry, P. H.: Observation of neutral sulfuric acid-amine containing clusters in laboratory and ambient measurements, Atmos. Chem. Phys., 11, 10823–10836, doi:10.5194/acp-11-10823-2011, 2011.
Zollner, J. H., Glasoe, W. A., Panta, B., Carlson, K. K., McMurry, P. H., and Hanson, D. R.: 25
AMTD
7, 3835–3861, 2014Quantifying amine permeation sources
N. A. Freshour et al.
Title Page
Abstract Introduction
Conclusions References
Tables Figures
◭ ◮
◭ ◮
Back Close
Full Screen / Esc
Printer-friendly Version Interactive Discussion
Discussion
P
a
per
|
D
iscussion
P
a
per
|
Discussion
P
a
per
|
Discuss
ion
P
a
per
|
Table 1.Typical permeation rates at room temperature.
N-base Temp. (K) Rate (pmol s−1) Methylaminea 300±3 30–75
Dimethylaminea 300±3 10–30 Ammoniaa 300±3 50–100 Trimethylamineb 300 10–15 Triethylamineb 300 ∼4
Mature permeation tubes only: older than 1 month, younger than 1 year.
AMTD
7, 3835–3861, 2014Quantifying amine permeation sources
N. A. Freshour et al.
Title Page
Abstract Introduction
Conclusions References
Tables Figures
◭ ◮
◭ ◮
Back Close
Full Screen / Esc
Printer-friendly Version Interactive Discussion
Discussion
P
a
per
|
D
iscussion
P
a
per
|
Discussion
P
a
per
|
Discuss
ion
P
a
per
|
Table 2.Laboratory and field (OK)acalibrations.
species Place mixing ratio, ppbv signal based, ppbv ratiob
NH3 Lab 67 55 0.82
NH3 Lab 3.7 3.2 0.86
CH3NH2 Field 15 17 1.1
(CH3)2NH2 Lab 2.7 2.5 0.92
(CH3)2NH2 Lab 42 33 0.79
(CH3)3NH2 Lab 8.3 10 1.2
DMSO field, lab 2.2-to-7 6.5-to-28 3c
aRecent deployment to DOE site, Southern Great Plains, Lamont, OK, in spring 2013. bRatio of sensitivity toS
typ.
AMTD
7, 3835–3861, 2014Quantifying amine permeation sources
N. A. Freshour et al.
Title Page
Abstract Introduction
Conclusions References
Tables Figures
◭ ◮
◭ ◮
Back Close
Full Screen / Esc
Printer-friendly Version Interactive Discussion
Discussion
P
a
per
|
D
iscussion
P
a
per
|
Discussion
P
a
per
|
Discuss
ion
P
a
per
|
Table 3.Average ammonia and amines/amides (pptv) measured by AmPMS.
site NH3 32u 46u 60u 74u 88u 102u 116u
Atlantaa 3000e 0 1 10 2 4 17 –
Lewes, DEb 800 5 28 6 3 1 2 2
Lamont, OKc 900 4 14 35 150 98 20 15
Minneapolisd 1470 4 42 19 14 20 5 4
aJuly/August 2009 (Hanson et al., 2011). bJuly/August 2012.
AMTD
7, 3835–3861, 2014Quantifying amine permeation sources
N. A. Freshour et al.
Title Page
Abstract Introduction
Conclusions References
Tables Figures
◭ ◮
◭ ◮
Back Close
Full Screen / Esc
Printer-friendly Version Interactive Discussion
Discussion
P
a
per
|
D
iscussion
P
a
per
|
Discussion
P
a
per
|
Discuss
ion
P
a
per
|
Fig. 2. NH3 mixing ratio measured with AmPMS plotted vs. time. Addition of NH3 at 0.05 h followed by its removal at 0.35 h. Gross signals were used to calculate mixing ratio using
Styp; no background subtraction was done. The NH3was introduced into the sample flow from
AMTD
7, 3835–3861, 2014Quantifying amine permeation sources
N. A. Freshour et al.
Title Page
Abstract Introduction
Conclusions References
Tables Figures
◭ ◮
◭ ◮
Back Close
Full Screen / Esc
Printer-friendly Version Interactive Discussion
Discussion
P
a
per
|
D
iscussion
P
a
per
|
Discussion
P
a
per
|
Discuss
ion
P
a
per
|