ACPD
13, 7175–7222, 2013Model for acid-base chemistry in nanoparticle growth
T. Yli-Juuti et al.
Title Page
Abstract Introduction
Conclusions References
Tables Figures
◭ ◮
◭ ◮
Back Close
Full Screen / Esc
Printer-friendly Version Interactive Discussion
Discussion
P
a
per
|
Dis
cussion
P
a
per
|
Discussion
P
a
per
|
Discussio
n
P
a
per
|
Atmos. Chem. Phys. Discuss., 13, 7175–7222, 2013 www.atmos-chem-phys-discuss.net/13/7175/2013/ doi:10.5194/acpd-13-7175-2013
© Author(s) 2013. CC Attribution 3.0 License.
Atmospheric Chemistry and Physics
Open Access
Discussions
Geoscientiic Geoscientiic
Geoscientiic Geoscientiic
This discussion paper is/has been under review for the journal Atmospheric Chemistry and Physics (ACP). Please refer to the corresponding final paper in ACP if available.
Model for acid-base chemistry in
nanoparticle growth (MABNAG)
T. Yli-Juuti1, K. Barsanti2, L. Hildebrandt Ruiz3,*, A.-J. Kieloaho1, U. Makkonen4, T. Pet ¨aj ¨a1, T. Ruuskanen1, M. Kulmala1, and I. Riipinen5
1
Department of Physics, University of Helsinki, Helsinki, Finland
2
Department of Civil and Environmental Engineering, Portland State University, Portland, OR, USA
3
Atmospheric Chemistry Division, National Center for Atmospheric Research, Boulder, CO, USA
4
Finnish Meteorological Institute, Helsinki, Finland
5
Department of Applied Environmental Science and Bert Bolin Centre for Climate Research, Stockholm University, Stockholm, Sweden
*
now at: McKetta Department of Chemical Engineering, The University of Texas at Austin, Austin, TX, USA
Received: 11 February 2013 – Accepted: 11 March 2013 – Published: 18 March 2013
Correspondence to: T. Yli-Juuti ([email protected])
ACPD
13, 7175–7222, 2013Model for acid-base chemistry in nanoparticle growth
T. Yli-Juuti et al.
Title Page
Abstract Introduction
Conclusions References
Tables Figures
◭ ◮
◭ ◮
Back Close
Full Screen / Esc
Printer-friendly Version Interactive Discussion
Discussion
P
a
per
|
Dis
cussion
P
a
per
|
Discussion
P
a
per
|
Discussio
n
P
a
per
|
Abstract
Climatic effects of newly-formed atmospheric secondary aerosol particles are to a large extent determined by their condensational growth rates. However, all the vapors con-densing on atmospheric nanoparticles and growing them to climatically relevant sizes are not identified yet and the effects of particle phase processes on particle growth
5
rates are poorly known. Besides sulfuric acid, organic compounds are known to con-tribute significantly to atmospheric nanoparticle growth. In this study a particle growth model MABNAG (Model for Acid-Base chemistry in NAnoparticle Growth) was devel-oped to study the effect of salt formation on nanoparticle growth, which has been pro-posed as a potential mechanism lowering the equilibrium vapor pressures of organic
10
compounds through dissociation in the particle phase and thus preventing their evapo-ration. MABNAG is a model for monodisperse aqueous particles and it couples dynam-ics of condensation to particle phase chemistry. Non-zero equilibrium vapor pressures, with both size and composition dependence, are considered for condensation. The model was applied for atmospherically relevant systems with sulfuric acid, one organic
15
acid, ammonia, one amine and water in the gas phase allowed to condense on 3– 20 nm particles. The effect of dissociation of the organic acid was found to be small under ambient conditions typical for a boreal forest site, but considerable for base-rich environments (gas phase concentrations of about 1010cm−3for the sum of the bases). The contribution of the bases to particle mass decreased as particle size increased,
20
except at very high gas phase concentrations of the bases. The relative importance of amine versus ammonia did not change significantly as a function of particle size. While our results give a reasonable first estimate on the maximum contribution of salt formation to nanoparticle growth, further studies on, e.g. the thermodynamic properties of the atmospheric organics, concentrations of low-volatility organic acids and amines,
25
ACPD
13, 7175–7222, 2013Model for acid-base chemistry in nanoparticle growth
T. Yli-Juuti et al.
Title Page
Abstract Introduction
Conclusions References
Tables Figures
◭ ◮
◭ ◮
Back Close
Full Screen / Esc
Printer-friendly Version Interactive Discussion
Discussion
P
a
per
|
Dis
cussion
P
a
per
|
Discussion
P
a
per
|
Discussio
n
P
a
per
|
1 Introduction
Atmospheric aerosol particles affect the climate by scattering solar radiation and by act-ing as cloud condensation nuclei (CCN). Both of these aerosol climate effects depend on particle size. A significant fraction of atmospheric aerosol particles may be formed by nucleation (Merikanto et al., 2009), but these nanometer sized particles need to
5
grow tens of nanometers to effectively act as climate forcers. During their growth a frac-tion of the nanoparticles are lost due to coagulafrac-tion to larger particles, and the survival probability to CCN sizes depends on how fast the particles grow relative to their co-agulation rate (Kerminen et al., 2004; Pierce and Adams, 2007). Therefore, correctly accounting for the nanoparticle growth is crucial for correct representation of aerosol
10
effects in climate models (Riipinen et al., 2011). This requires knowledge on the vapors condensing on the nanoparticles and the processes related to the nanoparticle growth. The chemical composition of atmospheric nanoparticles and vapors condensing on them are not fully resolved yet. Several studies indicate that the key compound in at-mospheric nucleation is sulfuric acid (Weber et al., 1995; Kulmala et al., 2006; Kuang
15
et al., 2008; Sipil ¨a et al., 2010), likely assisted by basic compounds (Kurten et al., 2008; Ortega et al., 2008; Berndt et al., 2010; Kirkby et al., 2011). However, at many locations sulfuric acid concentrations are too low to explain observed particle growth rates (Birmili et al., 2003; Boy et al., 2005; Fiedler et al., 2005; Stolzenburg et al., 2005; Smith et al., 2008; Riipinen et al., 2011; Kuang et al., 2012) and most of the particle
20
growth is likely due to condensation of organic vapors (Riipinen et al., 2012 and refer-ences therein). Importance of organic vapors is supported by the large organic fraction in larger, above 40 nm, particles measured with an Aerosol Mass Spectrometer (Allan et al., 2006; Jimenez et al., 2009) and the observations on the composition of smaller nanoparticles (e.g. O’Dowd et al., 2002; Smith et al., 2008, 2010; Riipinen et al., 2009;
25
ACPD
13, 7175–7222, 2013Model for acid-base chemistry in nanoparticle growth
T. Yli-Juuti et al.
Title Page
Abstract Introduction
Conclusions References
Tables Figures
◭ ◮
◭ ◮
Back Close
Full Screen / Esc
Printer-friendly Version Interactive Discussion
Discussion
P
a
per
|
Dis
cussion
P
a
per
|
Discussion
P
a
per
|
Discussio
n
P
a
per
|
the organic emissions peak as well (Dal Maso et al., 2005; Hirsikko et al., 2005; Yli-Juuti et al., 2011).
It has been approximated that the compounds growing atmospheric nanoparticles should have an equilibrium vapor pressure of 10−7Pa or less (Donahue et al., 2011; Pierce et al., 2011). These low-volatility organic compounds can be produced by gas
5
phase oxidation from the volatile organic compounds emitted to the atmosphere from biogenic and anthropogenic sources (Kroll and Seinfeld, 2008). However, many of the oxidation products of organic vapors identified in the atmosphere have higher satura-tion vapor pressures than required for condensasatura-tion on nanoparticles (Goldstein and Galbally, 2007), and short chain organic acids as well as aliphatic amines that have
10
higher saturation vapor pressures have been observed in nanoparticles (Smith et al., 2010; Laitinen et al., 2011). This suggests that gas phase oxidation and reversible con-densation is not the only processes explaining nanoparticle growth (see also Donahue et al., 2011; Pierce et al., 2011) but particle phase processes, like polymerization (Lim-beck et al., 2003) and salt formation (Barsanti et al., 2009), may have an important role
15
in lowering the volatility of condensing organic compounds. The importance of diff er-ent particle phase processes probably depends on particle size. While polymerization is likely important for larger than 20 nm particles, salt formation is thought to be more important for the growth of the smallest, sub-20 nm, particles (Riipinen et al., 2012).
Numerous different amines have been detected in the atmosphere – both in the gas
20
and particle phases. The low molecular weight aliphatic amines, such as dimethylmine (DMA) or trimethylamine (TMA), are the most abundant (for a review on atmospheric observations of amines see Ge et al., 2011a). Low molecular weight aliphatic amines are highly water soluble compounds and can therefore dissolve into aqueous aerosol particles. Many of them, e.g. DMA, are strong bases and can thus compete with
ammo-25
ACPD
13, 7175–7222, 2013Model for acid-base chemistry in nanoparticle growth
T. Yli-Juuti et al.
Title Page
Abstract Introduction
Conclusions References
Tables Figures
◭ ◮
◭ ◮
Back Close
Full Screen / Esc
Printer-friendly Version Interactive Discussion
Discussion
P
a
per
|
Dis
cussion
P
a
per
|
Discussion
P
a
per
|
Discussio
n
P
a
per
|
et al., 2010). Both laboratory studies (Murphy et al., 2007; Berndt et al., 2010; Smith et al., 2010) and theory (Murphy et al., 2007; Barsanti et al., 2009) suggest that amines participate also in the growth of the particles formed by nucleation. Most of the contri-bution of amines in particle growth is assumed to be due to formation of aminium salts; however, non-salt contribution of amines on particle mass has also been observed,
pre-5
sumably due to partitioning of low-volatility oxidation products of amines into particle phase (Murphy et al., 2007).
In this study we investigate the effect of acid-base chemistry in the growth of atmo-spheric nanoparticles based on state-of-the-art thermodynamics of amine-containing systems. We developed a new particle growth model MABNAG (Model for Acid-Base
10
chemistry in NAnoparticle growth) which accounts for acid dissociation and base pro-tonation in the particle phase. Using the model we study the potential role of salt for-mation on particle growth rates, with particular focus on organic salts. The aim is to make an upper limit estimate of the possible effects that salt formation could have on nanoparticle growth. With this in mind we choose dimethylamine, which is a relatively
15
strong organic base, to represent all the amines involved in the particle growth and all the other condensing organic compounds we represent as one organic acid. We focus on four research questions: (1) What concentrations of organic acid and amine are needed to explain the atmospheric nanoparticle growth rates when acid-base chem-istry is taken into account and what should the saturation vapor pressure of the organic
20
acid be; (2) What are the relative roles of ammonia and amine in the salt formation and particle growth; (3) How does the relative humidity affect the salt formation and particle growth; and (4) How do the properties of the organic acid affect the salt formation and particle growth.
2 Model description 25
ACPD
13, 7175–7222, 2013Model for acid-base chemistry in nanoparticle growth
T. Yli-Juuti et al.
Title Page
Abstract Introduction
Conclusions References
Tables Figures
◭ ◮
◭ ◮
Back Close
Full Screen / Esc
Printer-friendly Version Interactive Discussion
Discussion
P
a
per
|
Dis
cussion
P
a
per
|
Discussion
P
a
per
|
Discussio
n
P
a
per
|
particles. In addition to condensation of vapors onto particles, particle phase acid dis-sociation and base protonation are taken into account in MABNAG. To calculate parti-cle phase chemistry MABNAG couples dynamic condensation calculations to the Ex-tended Aerosol Inorganics Model (E-AIM) http://www.aim.env.uea.ac.uk/aim/aim.php; Clegg et al., 1992; Clegg and Seinfeld, 2006a,b; Wexler and Clegg, 2002) which is
5
a phase equilibrium model. Using ambient vapor concentrations together with initial particle size and composition as inputs, MABNAG predicts the time evolution of the particle size and composition.
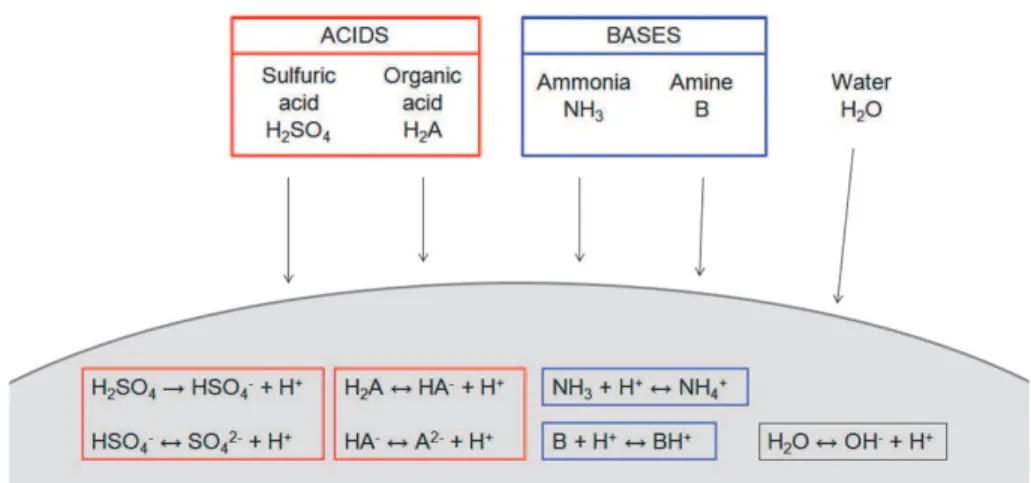
The condensing vapors can include both inorganic and organic compounds. Here MABNAG is applied for a system with five compounds in the gas phase: two acids,
10
two bases and water (Fig. 1). Acids are sulfuric acid and an organic di-acid. Bases are ammonia and an amine. All five gas phase compounds are allowed to condense onto the particle according to their abundance in the gas phase and their equilibrium vapor pressures.
The condensation of acids is calculated based on their mass fluxes in the gas phase.
15
The change of mass of each of the acids in the particle phase is calculated according to (Fuchs and Sutugin, 1970; Lehtinen and Kulmala, 2003)
dmi dt =
2π dp+di Dp+Diβm,iMi
RT pi−peq,i
(1)
whered is diameter, D is diffusion coefficient, Mi is the molar mass of vapor i,R is
gas constant,T is temperature, andpi andpeq,i are the ambient partial pressure and 20
equilibrium vapor pressure of vapori. Subscriptsp and i refer to the particle and the vapori, respectively. The mass flux in Eq. (1) is based on the vapor-molecule collision rate suggested by Lehtinen and Kulmala (2003) where the motion of particle and the volume of vapor molecule are accounted for. In Eq. (1) the Fuchs–Sutugin transition regime correction factor for mass transport (Fuchs and Sutugin, 1970) is
25
βm,i =
1+K ni
1+3α4m,i +0.377K ni+3α4m,iK n2i
ACPD
13, 7175–7222, 2013Model for acid-base chemistry in nanoparticle growth
T. Yli-Juuti et al.
Title Page
Abstract Introduction
Conclusions References
Tables Figures
◭ ◮
◭ ◮
Back Close
Full Screen / Esc
Printer-friendly Version Interactive Discussion
Discussion
P
a
per
|
Dis
cussion
P
a
per
|
Discussion
P
a
per
|
Discussio
n
P
a
per
|
and here it is calculated defining Knudsen (Kn) number as (Lehtinen and Kulmala, 2003)
K ni = 2λi
dp+di
, (3)
where the mean free path (λ) for condensation of vapori is
λi =
3 Dp+Di
¯
c2p+c¯2i1/2
. (4)
5
Herecpandci are the thermal speeds of the particle and vapor moleculei andαm,i is mass accommodation coefficient.
In this version of MABNAG, equilibrium between gas and liquid phase is assumed to hold for water and basic compounds and their amount in the particle during each time step is calculated according to
10
peq,i =pi (5)
wherei refers now to water or either of the bases. The characteristic time scaleτi of the
diffusion of vapori towards a given particle population is proportional to the inverse of the diffusion coefficient and transition regime correction factor fori, (Diβi)−1(Seinfeld
and Pandis, 2006; Riipinen et al., 2010; Saleh et al., 2011), thus decreasing with
de-15
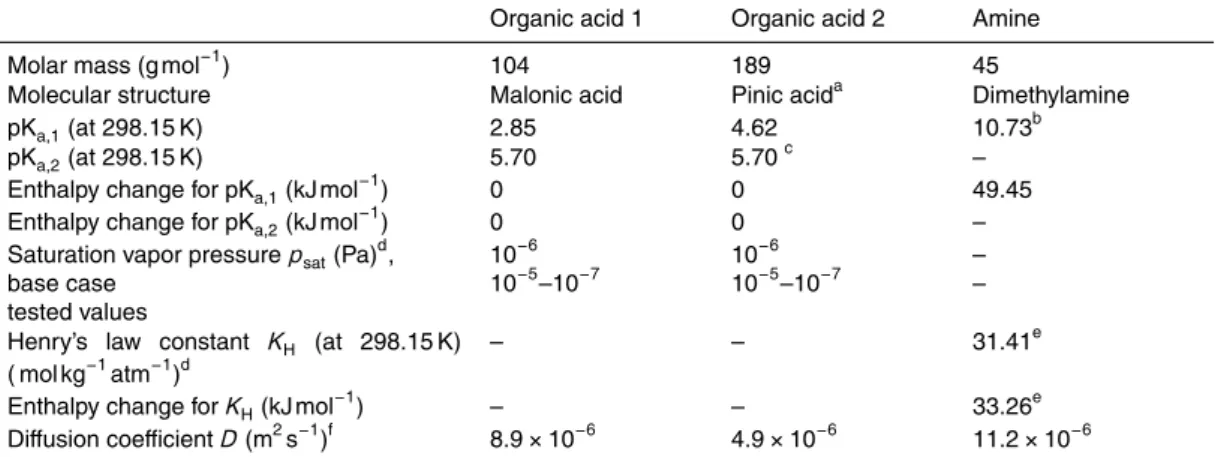
creasing molecular mass of the condensing vapor. Using the simple calculation above, ammonia is expected to equilibrate in similar time scales with water, amine two times slower and sulfuric acid and organic acid three to four times slower compared to water (see Table 1 for the properties of the organic compounds). The equilibrium assumption might thus slightly overestimate the condensation of amines, so it serves the purpose of
20
ACPD
13, 7175–7222, 2013Model for acid-base chemistry in nanoparticle growth
T. Yli-Juuti et al.
Title Page
Abstract Introduction
Conclusions References
Tables Figures
◭ ◮
◭ ◮
Back Close
Full Screen / Esc
Printer-friendly Version Interactive Discussion
Discussion
P
a
per
|
Dis
cussion
P
a
per
|
Discussion
P
a
per
|
Discussio
n
P
a
per
|
This assumption should, however, be carefully tested in future studies where more de-tailed analysis on the condensation of specific compounds are investigated (e.g. if used for interpretation of laboratory experiments).
Particle phase chemistry and particle size affect condensation through the equilib-rium vapor pressures (e.g. Seinfeld and Pandis, 2006)
5
peq,i =γi({Xj})·Xi·psat,i(T)·exp
4σvi RT dp
!
, (6)
whereγi is activity coefficient which depends on the composition of particle,Xi andXj are molar fraction of condensing speciesi and the other compoundsj in the particle, andpsat,i is the saturation vapor pressure above pure liquidi. The exponential term in
Eq. (7) is the size dependent Kelvin term whereσandvi are the surface tension of the
10
solution and molar volume ofi in the liquid.
In the particle phase, acid dissociation and base protonation are taken into account. The organic acids included in this study were di-acids. Thus, the organic acid (H2A) has two dissociation products (HA− and A2−) as does sulfuric acid
H2A→HA−+H+ (R1a)
15
HA−→A2−+H+ (R1b)
In this study the amine was dimethylamine (DMA) which is an organic base (B) that has one protonation product (BH+) as does ammonia
B+H+→BH+. (R2)
The fraction of dissociated acids and protonated bases are defined by the acid
dis-20
ACPD
13, 7175–7222, 2013Model for acid-base chemistry in nanoparticle growth
T. Yli-Juuti et al.
Title Page
Abstract Introduction
Conclusions References
Tables Figures
◭ ◮
◭ ◮
Back Close
Full Screen / Esc
Printer-friendly Version Interactive Discussion
Discussion
P
a
per
|
Dis
cussion
P
a
per
|
Discussion
P
a
per
|
Discussio
n
P
a
per
|
model. Also water dissociation to OH− and H+ ions is taken into account. Thus in total, 12 different species are considered in the liquid phase chemistry calculations.
The particle phase acid dissociation/base protonation and composition dependence of equilibrium vapor pressures in MABNAG are calculated with E-AIM (Clegg et al., 1992; Clegg and Seinfeld, 2006a,b; Wexler and Clegg, 2002). E-AIM is a
thermody-5
namic phase equilibrium model which can be used for systems with gas, aqueous, hy-drophobic liquid and solid phases. In MABNAG, E-AIM is set to allow only the gas and aqueous phases. For mixtures of inorganic and organic compounds, E-AIM considers all the compounds when calculating activity of water. However, interactions between inorganic and organic compounds are neglected. The activity coefficients of water and
10
solutes are first calculated based on separate purely inorganic and organic aqueous solutions of same molalities of solutes as in the mixed inorganic-organic mixture. The water activity is then calculated as a product of water activity coefficients of the inor-ganic and orinor-ganic solutions (Eq. (9) in Clegg and Seinfeld, 2006a; Clegg et al., 2001). For solutes the activity coefficients are assumed to be the same as in the purely
in-15
organic or organic solution. In this study the group contribution method UNIFAC with standard set of parameters (Fredenslund et al., 1975; Hansen et al., 1991; Wittig et al., 2003; Balslev and Abildskov, 2002) was chosen as the activity model for the neutral form of the organic compounds in E-AIM. The activity coefficients of water and inor-ganic ions are calculated according to Pitzer, Simonson and Clegg equations (Clegg
20
et al., 1992) in E-AIM. The same method is applied also for the organic ions. However, due to the lack of data for organic ions the interaction parameters of inorganic ions are used for organic ions: HSO−4 and SO24− for singly and doubly charged organic anions, respectively, and NH+4 for singly charged organic cations.
E-AIM is an equilibrium model and therefore, while MABNAG calculates the
dynam-25
ACPD
13, 7175–7222, 2013Model for acid-base chemistry in nanoparticle growth
T. Yli-Juuti et al.
Title Page
Abstract Introduction
Conclusions References
Tables Figures
◭ ◮
◭ ◮
Back Close
Full Screen / Esc
Printer-friendly Version Interactive Discussion
Discussion
P
a
per
|
Dis
cussion
P
a
per
|
Discussion
P
a
per
|
Discussio
n
P
a
per
|
are corrected for Kelvin effect in MABNAG by multiplying with the exponential term in Eq. (6). For bases and water this requires using E-AIM iteratively to find the equilibrium described in Eq. (5) according to gas phase partial pressures and equilibrium vapor pressures presented in Eq. (6).
3 Model calculations 5
3.1 Modeled system and the properties of compounds
The system modeled in this study contained sulfuric acid, one organic acid, ammonia, one amine and water in the gas phase and all of them were allowed to condense on the particle. The properties of dimethylamine (DMA) were used for the amine (Ge et al., 2011b), and for the organic acid two model compounds with different properties were
10
tested (Table 1). Organic acid 1 resembles malonic acid being the smaller and stronger of the organic acids whereas organic acid 2 is larger and weaker acid like pinic acid. For both of the organic acids different saturation vapor pressures were tested (Table 1). This was done since saturation vapor pressures of different organic acids vary over several orders of magnitude (Goldstein and Galbally, 2007). The lower limit, 10−7Pa
15
(≈2.6×107cm−3), corresponds to the previous estimates on saturation vapor pressure required for condensation onto atmospheric nanoparticles without particle phase pro-cesses taking place (Pierce et al., 2011). The upper limit 10−5Pa (≈2.6×109cm−3) ap-proximately corresponds to the saturation vapor pressures of larger dicarboxylic acids, e.g. pinic acid, but is significantly lower than what is measured for short-chain organic
20
acids, like malonic acid (Pope et al., 2010).
In this study all organic compounds, except amines, were grouped in one and treated as a single organic acid in the model. While there can be other organic compounds condensing on atmospheric nanoparticles this assumption was made in order to have an upper limit estimate for the contribution of the salts. For the same reason, in many
25
ACPD
13, 7175–7222, 2013Model for acid-base chemistry in nanoparticle growth
T. Yli-Juuti et al.
Title Page
Abstract Introduction
Conclusions References
Tables Figures
◭ ◮
◭ ◮
Back Close
Full Screen / Esc
Printer-friendly Version Interactive Discussion
Discussion
P
a
per
|
Dis
cussion
P
a
per
|
Discussion
P
a
per
|
Discussio
n
P
a
per
|
the organic acid. Also grouping all amines in one and using the properties of DMA as representative of this organic base supports the aim of making an upper limit estimate of salt formation.
The properties related to liquid phase chemistry and gas-liquid equilibrium for in-organic compounds are built into E-AIM. Particle density and surface tension were
5
assumed to be independent of particle composition and valuesρ=1500 kg m−3 and σ=30 mN m−1were used, respectively. For each compoundi the molar volume in liq-uid was approximated asvi=Mi/ρ. Mass accommodation coefficients of all the
com-pounds were assumed to be 1.0.
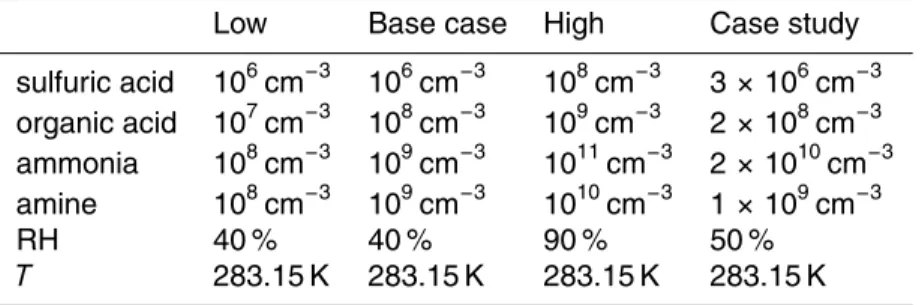
3.2 Inputs in simulations 10
In all simulations the model was initialized with 20 molecules of sulfuric acid, 20 molecules of organic acid and equilibrium amount of ammonia, amine and water which gave an initial particle diameter of approximately 2.5 nm (4500–7000 u). Gas phase concentrations of acids and bases, relative humidity (RH) and temperature were varied in simulations according to Table 2. Within a simulation ambient conditions were
as-15
sumed to stay constant in order to separate size dependence from time dependence. The simulations were set to run for 12 h time periods or, in case of fast growth, until par-ticle diameter was 40 nm. Focus was in sub-20 nm growth as organic salt formation is expected to be more important in this size range compared to larger particles (Riipinen et al., 2012). Also, after 20 nm the simulated particle composition changed only little
20
giving no reason to continue the model runs to much larger sizes. Five types of simulations were done:
1. Concentrations of organic acid and amine needed for realistic atmospheric parti-cle growth rates were studied based on a set of simulations where concentrations of organic acid and amine were varied within the higher and the lower limit in
Ta-25
ACPD
13, 7175–7222, 2013Model for acid-base chemistry in nanoparticle growth
T. Yli-Juuti et al.
Title Page
Abstract Introduction
Conclusions References
Tables Figures
◭ ◮
◭ ◮
Back Close
Full Screen / Esc
Printer-friendly Version Interactive Discussion
Discussion
P
a
per
|
Dis
cussion
P
a
per
|
Discussion
P
a
per
|
Discussio
n
P
a
per
|
were used. These simulations were repeated for several values of saturation va-por pressure of organic acid (10−7–10−5Pa).
2. Effect of basic vapor concentrations on the dissociation of organic acid and par-ticle growth rate (GR) was studied based on simulations where ammonia and amine concentrations were varied (see Table 2). This allowed also for studies
5
on the relative role of the two bases. For these calculations the base case val-ues of sulfuric acid concentration,T and RH were used (Table 2). Concentration and saturation vapor pressure of the organic acid were set to 3×108cm−3 and 10−6Pa based on the results of the simulations set 1 (see also the Sect. 4). Other properties of organic acid were as for organic acid 1 (Table 1).
10
3. Effect of water on the particle growth was studied based on simulations where RH was varied. For these simulations the base case values of sulfuric acid, ammonia and amine were used (Table 2), concentration and saturation vapor pressure of the organic acid were set to 3×108cm−3 and 10−6Pa and other properties of organic acid were as for organic acid 1 (Table 1).
15
4. To investigate the effect of the chemical and physical properties of the organic acid a set of simulations was done where one or several properties of the organic acid were varied from those of organic acid 1 to those of organic acid 2 (Table 1). For these simulations the base case values of sulfuric acid, ammonia and amine were used (Table 2) and concentration and saturation vapor pressure of the organic
20
acid were set to 3×108cm−3and 10−6Pa.
5. A set of simulations were done for a case study day, 23 July 2010, at Hyyti ¨al ¨a. First, the average ambient conditions (Table 2, see Appendix A for details of the measurements) with varied saturation vapor pressure were used in the model and, second, the organic acid and amine concentrations were varied in the
25
ACPD
13, 7175–7222, 2013Model for acid-base chemistry in nanoparticle growth
T. Yli-Juuti et al.
Title Page
Abstract Introduction
Conclusions References
Tables Figures
◭ ◮
◭ ◮
Back Close
Full Screen / Esc
Printer-friendly Version Interactive Discussion
Discussion
P
a
per
|
Dis
cussion
P
a
per
|
Discussion
P
a
per
|
Discussio
n
P
a
per
|
the simulated and measured GR. For these simulations properties of organic acid 1 were used.
The base case values and the limits of ambient conditions are based on typical con-ditions at the Hyyti ¨al ¨a measurement station (Hari and Kulmala, 2005). For details see Appendix A.
5
The GR calculated from the simulated particle growth was compared to GR calcu-lated based on particle distributions measured at Hyyti ¨al ¨a. For Hyyti ¨al ¨a, particle growth rates are most often calculated based on total particle population measured with Diff er-ential Mobility Particle Sizer (DMPS; Aalto et al., 2001) or based on naturally charged particle population measured with one of the ion spectrometers, Air Ion Spectrometer
10
(Mirme et al., 2007) or Balanced Scanning Mobility Analyzer (Tammet, 2006). While the DMPS setup used in Hyyti ¨al ¨a is equipped with a dryer and thus measures dry particle size the two ion spectrometers measure wet particle size. Studies using and comparing the GRs from the different instruments show that in most of the cases, except in condi-tions with very high RH, the difference between GRs calculated from dry and wet sizes
15
is small and does not affect the results significantly (Dal Maso et al., 2005; Hirsikko et al., 2005; Yli-Juuti et al., 2011). In this study the GR from the model simulations was thus calculated based on the dry particle size.
4 Results and discussion
4.1 The effect of organic acid and amine concentrations – simulation set 1 20
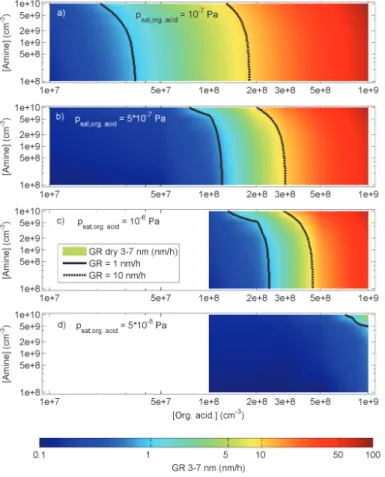
Figure 2 shows the predicted GR of particles 3–7 nm in diameter as a function of gas phase concentrations of amine and organic acid with four different saturation vapor pressures of organic acid. The concentration ranges on the x- and y-axis represent reasonable organic acid and amine concentrations, respectively, at Hyyti ¨al ¨a (Table 2; see also Appendix A). These model runs correspond to the simulation set 1 described
25
ACPD
13, 7175–7222, 2013Model for acid-base chemistry in nanoparticle growth
T. Yli-Juuti et al.
Title Page
Abstract Introduction
Conclusions References
Tables Figures
◭ ◮
◭ ◮
Back Close
Full Screen / Esc
Printer-friendly Version Interactive Discussion
Discussion
P
a
per
|
Dis
cussion
P
a
per
|
Discussion
P
a
per
|
Discussio
n
P
a
per
|
The organic acid concentration required in the model to predict similar GRs as ob-served in the atmosphere depends strongly on the assumed saturation vapor pres-sure of the organic acid. Typically, GR of 3–7 nm particles varies at Hyyti ¨al ¨a within 1–10 nm h−1with the average 3.8 nm h−1 (Dal Maso et al., 2005; Hirsikko et al., 2005; Yli-Juuti et al., 2011). By assuming the psat,Org. acid of 1×10⁻⁷Pa growth rates
com-5
parable to measured values were predicted with about 1×108cm−3organic acid con-centrations which corresponds to the base case value in Table 2. Aspsat,Org. acid was increased, higher concentration of organic acid was naturally required in the model to reach the GRs observed in the atmosphere. Withpsat,Org. acid up to 1×10⁻⁶Pa MAB-NAG still predicted GRs to reach the values observed in atmosphere with reasonable
10
assumptions about the organic acid concentrations. Whenpsat,Org. acid was set higher than 1×10⁻⁶Pa unrealistically high organic acid concentrations, over 109cm−3, were needed to grow the particles with GRs equal to the atmospheric GRs.
The saturation vapor pressure of 10−6Pa is only one order of magnitude higher than the values derived without including any particle phase processes (e.g. Pierce et al.,
15
2011). This implies that the organic salt formation in not fully able to explain the ap-parent gap between the saturation vapor pressures required for the molecules to con-dense onto nanoparticles and those observed in laboratory for organic compounds. Since the range of organic acid concentrations considered here was rather wide the result is likely to apply also for many other environments, except for those with high
20
base concentrations (see Sect. 4.2).
The higher the amine concentration the lower the organic acid concentration needed to produce GRs comparable to atmospheric observations (Fig. 2). However, amine concentration affected the GR less than organic acid concentration. The GR of 3–7 nm particles was rather insensitive to changes in amine concentration below 109cm−3and
25
ACPD
13, 7175–7222, 2013Model for acid-base chemistry in nanoparticle growth
T. Yli-Juuti et al.
Title Page
Abstract Introduction
Conclusions References
Tables Figures
◭ ◮
◭ ◮
Back Close
Full Screen / Esc
Printer-friendly Version Interactive Discussion
Discussion
P
a
per
|
Dis
cussion
P
a
per
|
Discussion
P
a
per
|
Discussio
n
P
a
per
|
4.2 The role of ammonia and amine – simulation set 2
In most of the model calculations a major part of the particle growth was due to con-densation of the organic acid. Varying the concentrations of basic vapors affected the GR both due to the effect of dissociation of organic acid and due to the increase of particulate mass of the basic compounds. The effect of basic vapor concentrations
5
on dissociation of organic acid and the subsequent effect on the GR were studied based on the simulation set 2 where amine and ammonia concentrations were varied. For these simulations, organic acid concentration of 3×108cm−3 and psat,Org. acid of 10−6Pa were chosen as they gave GR values comparable to atmospheric values with base case concentrations of amine and ammonia.
10
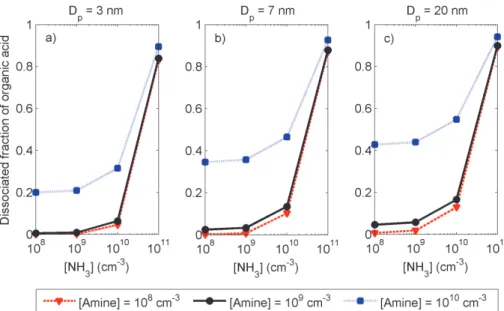
Figure 3 shows the fraction of organic acid that was predicted to dissociate in the particle phase. The difference in dissociated fraction between amine concentrations of 108cm−3 and 109cm−3 was very small and in both cases only less than 20 % of the organic acid dissociated unless ammonia concentration was very high, >1010cm−3. With amine concentration of 1010cm−3 a considerable fraction of organic acid
disso-15
ciated even at low ammonia concentrations. Amine, as a stronger base, enhances organic acid dissociation more effectively than ammonia: with amine concentration of 1010cm−3and base case concentration of ammonia 20–44 % of organic acid dissoci-ated in the particle phase, depending on particle size while with ammonia concentration of 1010cm−3and base case concentration of amine only 6–17 % of organic acid
disso-20
ciated. The fraction of dissociated organic acid was predicted to increase with particle size at each ammonia and amine concentration.
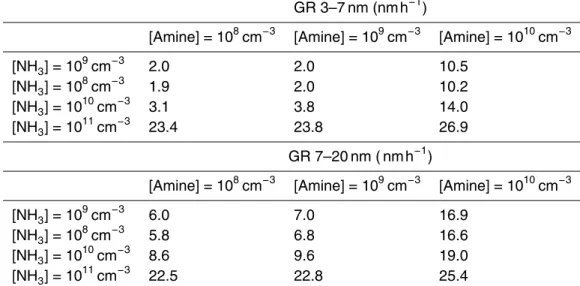
Particle growth rates calculated from simulations corresponding to Fig. 3 are re-ported in Table 3. The stronger effect of amine on dissociation of the organic acid is directly reflected in growth rates. Increasing amine concentrations from 109cm−3
25
ACPD
13, 7175–7222, 2013Model for acid-base chemistry in nanoparticle growth
T. Yli-Juuti et al.
Title Page
Abstract Introduction
Conclusions References
Tables Figures
◭ ◮
◭ ◮
Back Close
Full Screen / Esc
Printer-friendly Version Interactive Discussion
Discussion
P
a
per
|
Dis
cussion
P
a
per
|
Discussion
P
a
per
|
Discussio
n
P
a
per
|
particles. Also the GR of 7–20 nm particles was affected more by the change in amine concentration than by a similar change in ammonia concentration. The neutral fraction of the organic acid condenses reversibly on the particle, while the ionized fraction is effectively non-volatile. The relative change of these fractions between different base concentrations affects the GRs shown in Table 3. When most of the organic acid
re-5
mains in neutral form in the particle phase, the growth is limited by the Kelvin term and GR increases with particle size. When most of the organic acid is in the ionized form, organic acid condenses as if it was non-volatile, the Kelvin term does not limit the parti-cle growth and GR does not increase with partiparti-cle size. The latter is observed only with very high base concentrations (ammonia concentration 1011cm−3in the simulations).
10
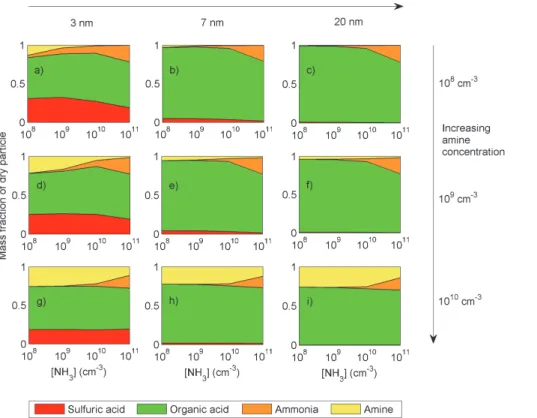
In addition to affecting the dissociation of the organic acid, the basic compounds af-fect the particle GR through their mass fluxes to the particle. However, the increase in GR with increasing base concentration is not only due to the increased mass fluxes of bases since the bases account for less than approximately 25 % of the dry particle mass. This is seen from Fig. 4 where the mass fractions of compounds are shown after
15
removing the contribution of water. In Fig. 4 for each acid/base the neutral form and its dissociation/protonation product(s) are grouped together in order to indicate the contri-bution of each of the condensing vapors. The dry mass fractions are presented to be consistent with particle composition measurements where typically particle water con-tent is not measured. With ammonia concentration one order of magnitude higher than
20
amine concentration the mass fractions of the two bases are approximately the same in the particle. With similar gas phase concentrations of amine and ammonia, amine mass is significantly higher in the particle phase. This is partly due to the difference in their strength as bases but also affected by their different molecular masses.
In most cases, the fraction of bases in the particle dry mass decreased as a function
25
ACPD
13, 7175–7222, 2013Model for acid-base chemistry in nanoparticle growth
T. Yli-Juuti et al.
Title Page
Abstract Introduction
Conclusions References
Tables Figures
◭ ◮
◭ ◮
Back Close
Full Screen / Esc
Printer-friendly Version Interactive Discussion
Discussion
P
a
per
|
Dis
cussion
P
a
per
|
Discussion
P
a
per
|
Discussio
n
P
a
per
|
sulfuric acid instead of the organic acid. However, at the highest amine and ammonia concentrations, 1010cm−3 and 1011cm−3, respectively there was little change in the mass fractions of base compounds during particle growth. At these conditions the con-trolling factor for the partitioning of the bases to the particle phase seems to be their high gas phase concentrations and the acid-base chemistry in the particle phase is
5
driven by the bases. Figure 4 shows model runs for base case sulfuric acid concentra-tion (106cm−3) but similar behavior in mass fractions of bases was observed with all sulfuric acid concentrations (106–108cm−3).
The mass fraction of sulfuric acid decreased as a function of particle size. The driving force for condensation is the difference between gas phase concentration and
equilib-10
rium vapor pressure of the condensing vapor (Eq. 1). For the smallest particles, the driving force for the condensation is comparable for the two acids. As the particles grow, driving force for condensation of organic acid becomes stronger due to the de-crease of its equilibrium vapor pressure (dede-crease of Kelvin effect) and its higher gas phase concentrations. Sulfuric acid is a much stronger acid compared to the organic
15
acid and therefore its dissociation is strongly preferred over dissociation of organic acid. As the underlying assumption in the model is that all the sulfuric acid, due to being so strong acid, will dissociate at least once, and all the sulfuric acid is forming salt in the particle phase. This further lowers the equilibrium vapor pressure of sulfuric acid making it effectively non-volatile and its condensation independent of the change
20
in equilibrium vapor pressure with particle size. The increase of the dissociated fraction of organic acid with increasing particle size (Fig. 3) is also related to the differences in the dissociation constants and gas phase concentrations of the two acids, and thus their competition of the bases. The ratio of organic acid to sulfuric acid in the particle increases with particle size and due to this more of the organic acid can dissociate in
25
the larger particles, while at the smaller particles the organic acid is not strong enough to compete of the bases with the sulfuric acid.
ACPD
13, 7175–7222, 2013Model for acid-base chemistry in nanoparticle growth
T. Yli-Juuti et al.
Title Page
Abstract Introduction
Conclusions References
Tables Figures
◭ ◮
◭ ◮
Back Close
Full Screen / Esc
Printer-friendly Version Interactive Discussion
Discussion
P
a
per
|
Dis
cussion
P
a
per
|
Discussion
P
a
per
|
Discussio
n
P
a
per
|
organosulfates, in the particle could further enhance the condensation of organic acid. This would probably not affect the condensation of sulfuric acid as the condensation of sulfuric acid on nanoparticles seems to be limited by its gas phase concentration, not the equilibrium vapor pressure.
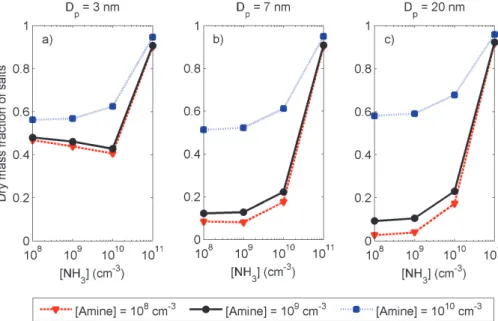
The mass fraction of salts in the particle varied both as a function of particle size and
5
gas phase concentrations of bases (Fig. 5). The variation with the base concentration was the largest in the larger particle sizes: depending on base concentration 3 % to 96 % of particle dry mass consisted of salts at 20 nm while at 3 nm the fraction of salts varied from 40 % to 95 %. The larger contribution of salts in particle mass of the smallest particles is due to differences in the contribution of sulfuric acid and organic
10
acid to the growth since in practice all of the non-salt dry mass of the particle was due to the neutral organic acid.
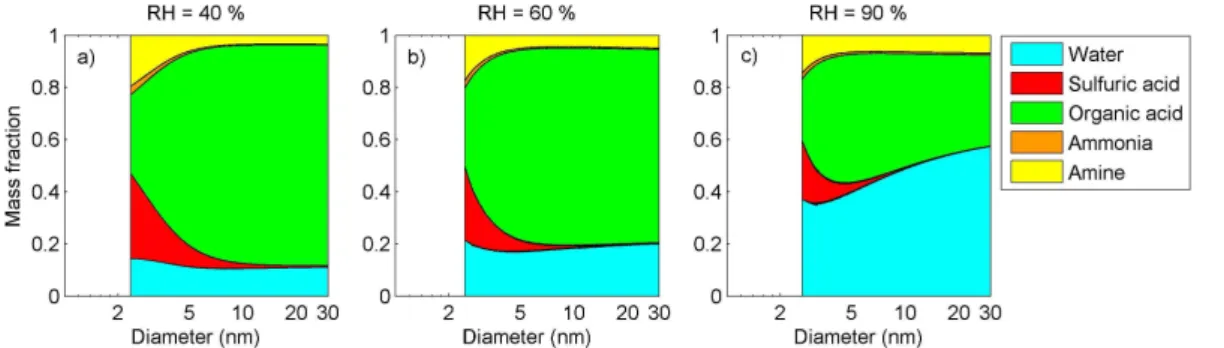
4.3 The effect of water – simulation set 3
The effect of RH on acid-base chemistry and particle growth was tested using simula-tion set 3 where RH was varied from 40 % to 90 %. Increasing RH from 40 % to 60 %
15
increased the mass fraction of water in the particle approximately by 30 % (Fig. 6a and b) and GR calculated from particle dry size increased from 2.0 nm h−1 to 6.9 nm h−1at size range 3–7 nm and from 7.0 nm h−1to 11.8 nm h−1at size range 7–20 nm. At RH of 90 % about half of the particle mass was water (Fig. 6c) and the GRs calculated based on particle dry size were 22.5 nm h−1 and 28.4 nm h−1 at size ranges 3–7 nm and 7–
20
20 nm, respectively. The GR was calculated based on the dry mass of the particle and therefore the increase in GR is not explained by the increase in particle water content. Instead, the increased amount of water in the particles at higher RH enhanced the con-densation of the other compounds: mass fraction of bases increased and consequently the dissociated fraction of organic acid also increased when RH increased.
25
ACPD
13, 7175–7222, 2013Model for acid-base chemistry in nanoparticle growth
T. Yli-Juuti et al.
Title Page
Abstract Introduction
Conclusions References
Tables Figures
◭ ◮
◭ ◮
Back Close
Full Screen / Esc
Printer-friendly Version Interactive Discussion
Discussion
P
a
per
|
Dis
cussion
P
a
per
|
Discussion
P
a
per
|
Discussio
n
P
a
per
|
to have a positive correlation with RH if concentrations of other vapors are constant. Such correlation is not seen in data from Hyyti ¨al ¨a (Yli-Juuti et al., 2011). This indicates that salt formation is likely not the limiting factor for the growth of the atmospheric 3– 20 nm particles – at least not with the thermodynamics considered here. However, the correlation with RH could be disturbed by possible changes in the concentrations of
5
other vapors (Hamed et al., 2011).
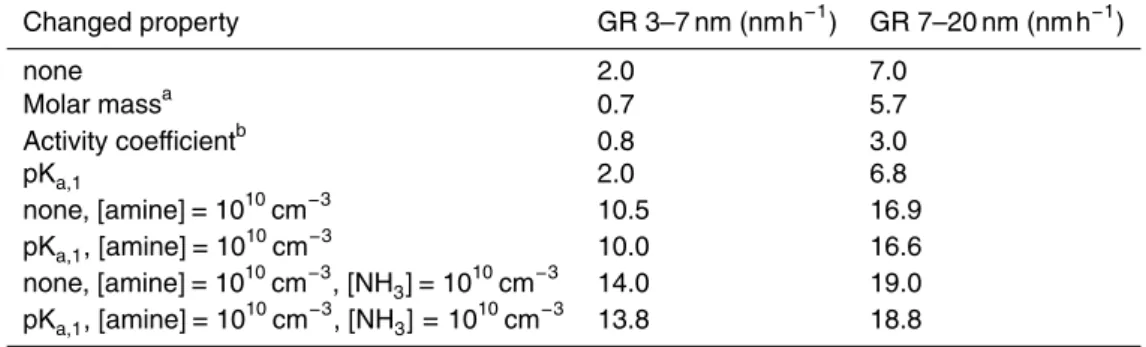
4.4 The effect of properties of organic acid – simulation set 4
For results presented so far the properties of organic acid 1 were used. Table 4 shows the GR in simulations where properties of the organic acid were varied from organic acid 1 to organic acid 2 (simulation set 4). Keeping all other properties as for organic
10
acid 1 but using the molar mass of organic acid 2 (higher molar mass) decreased the GR about 65 % for 3–7 nm particles and about 20 % for 7–20 nm particles. This is due to the decrease of diffusion coefficient with increased molecular mass. Also the molecular structure of the organic acid, which affects the calculation of the activity coefficients and thereby the equilibrium vapor pressure of the organic acid, affected the predicted GR.
15
Using the molecular structure of organic acid 2 decreased the GRs in both size ranges by about 60 %. Changing the strength of the organic acid had very minor effect the on GR: using the acid dissociation constant of organic acid 2 instead of organic acid 1 decreased the GR by only a few per cent. With base case gas phase concentrations the GR of 3–7 nm particles was not affected by this change in dissociation coefficient. Both
20
organic acids 1 and 2 are much weaker acids than sulfuric acid and it seems that they are too weak to drive the particle phase acid-base chemistry. The results suggest that the dissociation of organic acid is not sensitive to its dissociation constant but instead controlled by the available concentrations of the bases. The assumptions of properties of organic acid thus change the quantitative results but do not affect the conclusions
25
drawn from the model results.
ACPD
13, 7175–7222, 2013Model for acid-base chemistry in nanoparticle growth
T. Yli-Juuti et al.
Title Page
Abstract Introduction
Conclusions References
Tables Figures
◭ ◮
◭ ◮
Back Close
Full Screen / Esc
Printer-friendly Version Interactive Discussion
Discussion
P
a
per
|
Dis
cussion
P
a
per
|
Discussion
P
a
per
|
Discussio
n
P
a
per
|
may not capture all the properties of nanoparticles. To study this possibility, MABNAG was compared to the conceptual growth model introduced by Riipinen et al. (2012), which considers a system of two acids and two bases but includes no water in the particles. The relative stability of the salts was accounted for with effective mass ac-commodation coefficients based on quantum chemical results on the evaporation rates
5
of very small clusters (Kurten et al., 2008) instead of detailed thermodynamics. In the conceptual model diffusional fluxes of all the four compounds are calculated dynam-ically, and acids are allowed to exist in the particle phase in their acidic form or as salts formed with one of the bases in 1 : 1 molar ratio. Bases are allowed to exist in the particle phase only if they form salt with one of the acids and the excess base
10
molecules are evaporated from the particles. The two models, MABNAG and the con-ceptual model (Riipinen et al., 2012) give qualitatively similar results on the GRs with the same gas phase concentrations and initial composition of the particle (see Riipinen et al., 2012). However, MABNAG predicts less amine in the particle. This indicates that the bulk thermodynamics based MABNAG and the conceptual model based on
quan-15
tum chemistry calculations of cluster stabilities predict different behaviour for amine salts. The conceptual model, as it is based on stabilities of small (1–2 nm) molecular clusters, is more likely to work for the smallest, nanometer sized, particles but might fail in predicting particle composition at larger sizes. MABNAG, on the other hand, is more likely to work for larger particles but might fail when particles are very small. This is also
20
the reason why in this study MABNAG was initialized with particles of about 2.5 nm in-stead of trying to capture the cluster sizes. The differences in predictions from the two models suggest that MABNAG might lack important interactions between molecules at the smallest particle sizes. More quantitative comparisons of thermodynamic and quantum chemical approaches are thus highly desirable and make an excellent topic
25
ACPD
13, 7175–7222, 2013Model for acid-base chemistry in nanoparticle growth
T. Yli-Juuti et al.
Title Page
Abstract Introduction
Conclusions References
Tables Figures
◭ ◮
◭ ◮
Back Close
Full Screen / Esc
Printer-friendly Version Interactive Discussion
Discussion
P
a
per
|
Dis
cussion
P
a
per
|
Discussion
P
a
per
|
Discussio
n
P
a
per
|
4.5 Case study day – simulation set 5
For the case study day the gas phase concentrations of sulfuric acid and ammo-nia were obtained directly from measurements while organic acid and amine con-centrations were estimated based on measurements and were thus more uncertain. When the vapor concentrations from measurements (Table 2) were used and the
sat-5
uration vapor pressure of the organic acid was varied the best agreement between measured and modelled GR was found with psat,Org. acid of 10−6Pa (Fig. 7a). With psat,Org. acid≥10−5Pa the predicted GRs were order an of magnitude lower compared to measured values with the estimated gas phase concentrations and organic acid (>8×108cm−3) or amine (>1×1010cm−3) concentrations that are probably
unrealis-10
tically high were required in the model for particles to grow with the measured growth rates. On the other hand, withpsat,Org. acid≤10−7Pa lower organic acid gas phase con-centration compared to estimated value was needed in the model to reach the mea-sured GR. In this case the modelled GRs did not have the correct size dependence as equilibrium vapor pressure of organic acid was low enough compared to ambient
par-15
tial pressure for the Kelvin effect not to affect the GRs. In the atmosphere the organic acid concentration is likely to increase during the morning and early afternoon due to the photo-oxidation activity and hence the apparent increase of GR with particle size would be predicted even with the low saturation vapor pressure if the time profiles of condensing vapors would be taken into account. Therefore we conclude that the
con-20
densing organic acids should on average have saturation vapor pressures on the order of 10−6Pa or lower for the model to predict GRs that are consistent with measurements on the case study day. It should be noted that this low-volatile compound could be an organic compound of any type as salt formation does not seem to be driving its conden-sation. This is in agreement with the results shown above for the average conditions at
25
Hyyti ¨al ¨a.
ACPD
13, 7175–7222, 2013Model for acid-base chemistry in nanoparticle growth
T. Yli-Juuti et al.
Title Page
Abstract Introduction
Conclusions References
Tables Figures
◭ ◮
◭ ◮
Back Close
Full Screen / Esc
Printer-friendly Version Interactive Discussion
Discussion
P
a
per
|
Dis
cussion
P
a
per
|
Discussion
P
a
per
|
Discussio
n
P
a
per
|
predicted with MABNAG was reasonable compared to the measured GR when or-ganic acid concentration was within±50 % of estimated values. Particle growth was less sensitive to changes in amine concentration, but as amine concentration is not well constrained there is considerable uncertainty related to the effect of amine on the particle growth. Assuming lower amine concentration did not affect the predicted
5
particle growth much since ammonia was the main base even with the amine concen-tration estimated from measurements (Fig. 7b). Assuming higher amine concenconcen-tration increased the GR, partly due to enhanced dissociation of organic acid, and as a conse-quence a lower organic acid vapor concentration was needed to explain the measured particle growth. This effect is not very strong as order of magnitude increase in amine
10
concentration was needed for decreasing organic acid concentration by 50 % but still achieving GR comparable to the measured values.
With the concentrations estimated based on measurements the model predicted all the ammonia and amine was protonated in particle phase (Fig. 7c). Most of the sul-furic acid dissociated twice and was as SO24− in the particles. Ratio between HSO−4
15
and SO24− was rather constant during the growth. Most of the organic acid was in its non-dissociated form in the particle phase. The dissociated fraction of organic acid increased during particle growth from 18 % at the beginning to 39 % at 40 nm. The dissociated fraction of organic acid was dominated by the second dissociation product and only 2–3 % of organic acid was as its first dissociation product.
20
5 Conclusions
The particle growth model MABNAG was developed and applied for studying atmo-spheric nanoparticle growth. MABNAG considers the condensation of mixtures of or-ganic and inoror-ganic vapors together with water, calculates the acid-base chemistry in the particle phase thermodynamically and takes into account both the size and
com-25
ACPD
13, 7175–7222, 2013Model for acid-base chemistry in nanoparticle growth
T. Yli-Juuti et al.
Title Page
Abstract Introduction
Conclusions References
Tables Figures
◭ ◮
◭ ◮
Back Close
Full Screen / Esc
Printer-friendly Version Interactive Discussion
Discussion
P
a
per
|
Dis
cussion
P
a
per
|
Discussion
P
a
per
|
Discussio
n
P
a
per
|
According to the model predictions for typical ambient conditions at Hyyti ¨al ¨a, only a small fraction of organic acid dissociated in the particle phase and, thus, a rather low (10−6Pa) saturation vapor pressure of organic acid was required for reaching re-alistic atmospheric nanoparticle growth rates even though the acid dissociation was taken into account. It should be noted that here all the organic acids were grouped
5
as one model compound. Therefore the results suggest that on average the organic compounds should be less volatile than, e.g. malonic acid and that there is likely some larger, stickier, organic compounds also condensing on the atmospheric nanoparticles. However, the possibility of simultaneous condensation of organic acids or other type of organic compounds with higher saturation vapor pressure is not excluded.
10
Short chain organic acids have been observed to account for a large fraction of nanoparticle mass in the atmosphere (Smith et al., 2010). This would not be predicted in MABNAG since these compounds have even higher saturation vapor pressures than malonic acid. This suggests that there are other processes affecting the condensa-tion of the organic acids in addicondensa-tion to salt formacondensa-tion or that the acid-base chemistry
15
in the model does not capture the real system correctly. For instance, formation of organosulfates, amides, oligomerization and particle phase oxidation could produce low-volatility compounds in the particle but are not included in MABNAG. On the other hand, the small size-scale of the nanoparticle affect the behaviour of the compounds due to which bulk-based thermodynamics might not capture all the properties right for
20
nanoparticles.
Relative contributions of ammonia and amine to particle mass depended on their rel-ative gas phase concentrations. For all the particle sizes ammonia was the more impor-tant base when its gas phase concentration was one order of magnitude or more higher than the gas phase concentration of amine. Otherwise amine was more important base
25
ACPD
13, 7175–7222, 2013Model for acid-base chemistry in nanoparticle growth
T. Yli-Juuti et al.
Title Page
Abstract Introduction
Conclusions References
Tables Figures
◭ ◮
◭ ◮
Back Close
Full Screen / Esc
Printer-friendly Version Interactive Discussion
Discussion
P
a
per
|
Dis
cussion
P
a
per
|
Discussion
P
a
per
|
Discussio
n
P
a
per
|
of sulfuric acid. For base-rich condition the partitioning of the bases between gas and particle phase was, however, driven by their high gas phase concentration.
Results from MABNAG for typical conditions at Hyyti ¨al ¨a suggest that salt formation has a minor role on the condensation of organic acid on the nanoparticles. However, only an order of magnitude increase in the gas phase concentration of either of the
5
bases would make organic salt formation an important process for particle growth. Salt formation is also predicted to be more important at higher RH. For the condensation of sulfuric acid, ammonia and amine salt formation was predicted to be a crucial process since none of these three compounds existed in the particle phase in their neutral form. In total the salts were predicted to account for 50 %, 13 % and 11 %, respectively, of the
10
mass of particle 3 nm, 7 nm and 20 nm particles in the typical gas phase concentration at Hyyti ¨al ¨a. At elevated base concentrations salts accounted for more than 90 % of particle mass.
Our results indicate that acid-base chemistry seems not to be the limiting process for the growth of 3–20 nm particles in the boreal forest conditions, and the formation of
15
organic salts is probably not enough to explain the observed very low-volatility of the organics condensing on atmospheric nanoparticles. The situation changes consider-ably and very steeply, however, for base-rich conditions (ammonia concentration larger than 1010cm−3for amine concentrations larger than 108cm−3) where acid-base chem-istry starts to dominate the organic vapour uptake. We believe that our results give
20
a reasonable first estimate on the upper limit of possible contribution of salt formation to nanoparticle growth, as they rely on the state-of-the-art thermodynamics of an atmo-spherically relevant chemical mixture. To confirm the details of the acid-base chemistry of the atmospheric nanoparticle growth, however, further studies on, e.g. the thermody-namic properties of the atmospheric organic compounds and amines, the atmospheric
25
ACPD
13, 7175–7222, 2013Model for acid-base chemistry in nanoparticle growth
T. Yli-Juuti et al.
Title Page
Abstract Introduction
Conclusions References
Tables Figures
◭ ◮
◭ ◮
Back Close
Full Screen / Esc
Printer-friendly Version Interactive Discussion
Discussion
P
a
per
|
Dis
cussion
P
a
per
|
Discussion
P
a
per
|
Discussio
n
P
a
per
|
Appendix A
Ambient conditions from measured data
This appendix describes the measurements which were used to estimate the am-bient conditions needed as inputs in MABNAG. The inputs required for MABNAG are the gas phase concentrations of all the condensing vapors, RH and
tempera-5
ture. In this study the data measured at Hyyti ¨al ¨a SMEAR II (Station for Measur-ing Ecosystem–Atmosphere Relations) research station, southern Finland was used. Hyyti ¨al ¨a is a background site situated on the boreal forest zone. The surroundings of the station are dominated by Scots pine (Hari and Kulmala, 2005).
The base case values and range of values used in simulation sets 1–4 were
es-10
timated based on the typical values for the atmospheric parameters measured at Hyyti ¨al ¨a. The case study day 23 July 2010 was during an intensive measurement cam-paign at Hyyti ¨al ¨a (Williams et al., 2011) and there were measurements for most of the quantities required as input for MABNAG.
A1 Sulfuric acid 15
Typical sulfuric acid vapor concentrations were estimated based on Pet ¨aj ¨a et al. (2009) where sulfuric acid concentrations were measured during spring and summer 2007. Base case value was taken to be the median day-time concentration of sulfuric acid on new particle formation event days (1×106cm−3). The maximum measured sulfuric acid concentration was approximately 1×107cm−3 which gave us the middle value
20
for sulfuric acid concentration. The highest concentration in our study, 1×108cm−3is highly overestimating the sulfuric acid concentration for Hyyti ¨al ¨a and is included in our analysis to represent sulfuric rich environments, e.g. Atlanta (McMurry et al., 2005).
On the case study day sulfuric acid concentration was measured with CIMS (Eisele and Tanner, 1991; Pet ¨aj ¨a et al., 2009). Sulfuric acid concentration varied between 1×
ACPD
13, 7175–7222, 2013Model for acid-base chemistry in nanoparticle growth
T. Yli-Juuti et al.
Title Page
Abstract Introduction
Conclusions References
Tables Figures
◭ ◮
◭ ◮
Back Close
Full Screen / Esc
Printer-friendly Version Interactive Discussion
Discussion
P
a
per
|
Dis
cussion
P
a
per
|
Discussion
P
a
per
|
Discussio
n
P
a
per
|
106cm−3and 4×106cm−3 during the time that the particles grew to reach 50 nm and the average concentration was 3×106cm−3.
A2 Organic acid
Oxidized organic vapor concentrations are rarely measured and therefore condens-able organic vapor concentrations could not be obtained directly from measurements.
5
Estimate for organic acid concentration can be obtained from the concentration of ox-idation products of monoterpenes. Rate of change of gas phase concentration of the oxidation products of monoterpenes (Cmonot.oxid.) can be estimated as (e.g. Dal Maso et al., 2005)
dCmonot.oxid.
dt =Q−CS·Cmonot.oxid. (A1)
10
whereQ is the sum of oxidation rates of monoterpenes by OH and O3 and CS is the condensation sink of oxidation products on particles. Equation (A1) assumes that only loss for the oxidation products is condensation on particle, CS is same for all the oxida-tion products and equilibrium vapor pressures of the oxidaoxida-tion products are negligible compared to the ambient gas phase concentrations. Therefore, Eq. (A1) can be used
15
only as an order of magnitude estimate. Assuming steady state the concentration of oxidation products is
Cmonot.oxid.= Q
CS. (A2)
For order of magnitude estimation the CS of monoterpene oxidation products can be approximated with the CS of sulfuric acid which is typically of the order of 10−3s−1 at
20
Hyyti ¨al ¨a (Dal Maso et al., 2005). Oxidation rate depends on the rate constants (kOH, kO3), gas phase concentration of oxidizing compounds OH and O3 (COH, CO
3) and monoterpene concentration (Cmonot.)
Q=kOHCOHCmonot.+kO3CO
ACPD
13, 7175–7222, 2013Model for acid-base chemistry in nanoparticle growth
T. Yli-Juuti et al.
Title Page
Abstract Introduction
Conclusions References
Tables Figures
◭ ◮
◭ ◮
Back Close
Full Screen / Esc
Printer-friendly Version Interactive Discussion
Discussion
P
a
per
|
Dis
cussion
P
a
per
|
Discussion
P
a
per
|
Discussio
n
P
a
per
|
Rate constants calculated as weighted averages based on typical relative abun-dances of different monoterpenes at Hyyti ¨al ¨a are estimated to be kOH=7.5× 10⁻¹¹cm3molecules−1s−1 and kO3=1.4×10⁻¹⁷cm3molecules−1s−1 (Yli-Juuti et al., 2011). OH concentrations of 3–6×105cm−3 have been reported for nucleation and growth periods at Hyyti ¨al ¨a (Pet ¨aj ¨a et al., 2009). Typical O3concentrations are 6×10¹¹–
5
1×1012cm−3 on the particle formation days (Lyubovtseva et al., 2005). Day time monoterpene mixing ratios at Hyyti ¨al ¨a during spring when the new particle forma-tion is most frequent are approximately 0.1 ppbv and throughout the year stays mostly below 0.4 ppbv (Lappalainen et al., 2009) which correspond to concentrations of 2.6×109cm−3 and 1×1010cm−3, respectively. Based on these rate constants and
10
concentrations typical concentration of monoterpene oxidation products would be of the order of 108cm3and maximum estimate would be 109cm−3. These were used as base case and maximum value for the organic acid. According to these calculations organic acid concentration was approximately 5 % of monoterpene concentration. The lower limit for organic acid concentration was taken to be 107cm−3 as concentrations
15
of at least this order of magnitude are needed to explain the particle growth rates ob-served in the atmosphere.
For the case study day monoterpene concentrations measured at Hyyti ¨al ¨a with Pro-ton Transfer Reaction Mass Spectrometer (PTR-MS) were used to estimate gas phase concentration of organic acid. There was a measurement break with PTR-MS in the
20
morning and the data was available only starting from 11:00. The median monoter-pene concentration between 11:00 and 18:00 was 3.9×109cm−3. This corresponds to organic acid concentration of approximately 2×108cm−3 when 5 % of monoterpenes are assumed to oxidize and form organic acid.
A3 Ammonia 25