Sarcopenia in Korean Females Aged 60 Years and Older
Using the Fourth Korea National Health and Nutrition
Examination Survey (KNHANES IV-2, 3), 2008–2009
Tae Ho Kim1, Hee-Jin Hwang2*, Sang-Hwan Kim3*
1Division of Endocrinology, Department of Internal Medicine, Kwandong University College of Medicine, Gangneung, Republic of Korea,2Department of Family Medicine, Kwandong University College of Medicine, Gangneung, Republic of Korea,3Geriatric Center and Department of Family Medicine, Myongji Hospital, Goyang, Republic of Korea
Abstract
Context:It has been suggested that elevated serum ferritin is associated with several metabolic disorders. However, there is no reported study assessing any association between serum ferritin and sarcopenia despite the close relationship between sarcopenia and metabolic disorders.
Objective:We investigated whether serum ferritin was associated with sarcopenia in older Koreans.
Design and Setting:We conducted a cross-sectional study based on data acquired in the second and third years (2008–9) of the fourth Korean National Health and Nutrition Examination Survey.
Participants:In total, 952 men (mean age 69.0 years) and 1,380 women (mean age 69.3 years) aged 60 years and older completed a body composition study using dual energy X-ray absorptiometry.
Measurements: Serum ferritin levels were measured. Sarcopenia was defined as an appendicular skeletal mass as a percentage of body weight that was less than two standard deviations below the gender-specific mean for young adults.
Results:Serum ferritin levels were lower in women than in men. Women with sarcopenia showed a higher level of serum ferritin than women without sarcopenia (men: without sarcopenia 115.7 ng/mL and with sarcopenia 134.4 ng/mL vs. women: without sarcopenia 70.7 ng/mL and with sarcopenia 85.4 ng/mL). The prevalence of sarcopenia increased as the tertile of serum ferritin increased. However, statistical significance was only seen in elderly women (1sttertile 6.3%, 2ndtertile 8.0%, 3rdtertile 12.0%; p = 0.008). Without adjustment, compared with those in the lowest tertile of serum ferritin level, participants in the highest tertile had an odds ratio of 2.02 (95% confidence interval = 1.26–3.23) for sarcopenia in women. After adjusting for known risk factors, the OR for sarcopenia was 1.74 (95% CI = 1.02–2.97) in women. There was no statistically significant association between sarcopenia and serum ferritin tertiles in men.
Conclusions:Elevated serum ferritin levels were associated with an increased prevalence of sarcopenia in women but not in men from a representative sample of elderly Koreans.
Citation:Kim TH, Hwang H-J, Kim S-H (2014) Relationship between Serum Ferritin Levels and Sarcopenia in Korean Females Aged 60 Years and Older Using the Fourth Korea National Health and Nutrition Examination Survey (KNHANES IV-2, 3), 2008–2009. PLoS ONE 9(2): e90105. doi:10.1371/journal.pone.0090105 Editor:Stefan Kiechl, Innsbruck Medical University, Austria
ReceivedAugust 10, 2013;AcceptedJanuary 30, 2014;PublishedFebruary 25, 2014
Copyright:ß2014 Kim et al. This is an open-access article distributed under the terms of the Creative Commons Attribution License, which permits unrestricted use, distribution, and reproduction in any medium, provided the original author and source are credited.
Funding:The authors have no support or funding to report.
Competing Interests:The authors have declared that no competing interests exist. * E-mail: ydsfm3624@naver.com (HJH); fanink@naver.com (SHK)
Introduction
Loss of muscle mass, especially skeletal muscle mass, is an important age-related change in elderly people. The term ‘sarcopenia’ is used to describe progressive muscle mass losses associated with aging according to Rosenberg in 1989 [1], although many alternative definitions and criteria have been suggested to characterize ‘sarcopenia’. The reported prevalence of sarcopenia ranges from 7 to 24%, due to the lack of a generally
accepted definition and heterogeneity within study populations [2].
associated with of cardiovascular disease, independent of other cardiovascular risk factors [2].
Iron is one of the essential inorganic substance for normal body physiology. However, iron overload may be associated with adverse health outcomes [6]. Serum ferritin levels reflect iron stored in the body [7]. Several studies have demonstrated an association between serum ferritin levels and metabolic disorders. There was a positive association between serum ferritin levels and fasting serum glucose and insulin concentrations in Finnish men [8]. In several other studies, elevated serum ferritin levels were associated with insulin resistance [9,10], metabolic syndrome [11,12], type 2 diabetes [13], and cardiovascular disease [14,15]. Although we do not understand the connection between serum ferritin and metabolic disorders, chronic inflammation and oxidative stress have been suggested to be a link between elevated serum ferritin levels and the development of metabolic disorders [16]. Under oxidative stress, elevated serum ferritin may contribute to cellular or tissue damage leading to insulin resistance [17,18].
Similarly, chronic inflammation and oxidative stress are thought be important causes of the loss of muscle mass [19]. Several studies in rats have also reported the accumulation of iron in skeletal muscles with aging [20,21]. These observations are similar to those of metabolic disorders such as diabetes and metabolic syndrome. However, there is no reported study showing any association between serum ferritin levels and sarcopenia. In this study, we examined a national representative sample of elderly South Koreans to investigate the association between serum ferritin levels and sarcopenia.
Materials and Methods
Study Participants and Database
This study was based on data acquired in the second and third years (2008–9) of the fourth Korean National Health and Nutrition Examination Survey (KNHANES IV). The KNHANES has been conducted periodically since 1998 to examine the general health and nutritional status of Koreans. KNHANES IV was a cross-sectional and nationally representative survey conducted by the Division of Chronic Disease Surveillance, Korea Centers for Disease Control and Prevention, from July 2007 to December 2009. The survey consists of a health interview survey, a health behavior survey, a nutrition survey, and a health examination. Data were collected via household interviews and by direct standardized physical examinations conducted in specially equipped mobile examination centers. Food intake was evaluated by a 24-h recall method. The sampling frame was developed based on the 2005 population and housing census in Korea. Household units were selected by a stratified multistage probability sampling design for the South Korean population. Approximately 260,000 primary sampling units, each of which containd,60 households, were included in KNHANES IV. From primary sampling units, 200 sampling units were selected randomly in the second and third years of the KNHANES IV. Finally, 25,250 individuals aged.1 year were sampled (12,528 in 2008 and 12,722 in 2009); these individuals represented 7,682 households in 200 districts (3,707 in 2008 and 3,975 in 2009). From the initial 25,250 individuals sampled, 20,277 participated in the survey (9,744 in 2008 and 10,533 in 2009), giving a response rate of 80.3% (77.8% in 2008 and 82.8% in 2009).
We identified 2,725 subjects aged$60 years who completed the body composition examination using dual energy X-ray absorp-tiometry (DXA; Discovery-W, Hologic, Inc., Waltham, MA, USA). We excluded individuals who had liver cirrhosis, chronic
liver disease, or chronic renal disease (n= 59), who had known diagnoses of any malignancy (n= 152), whose serum liver enzyme activities were more than twice the normal range (ALT and AST;
.80 IU/L; n =48), who had increased WBC counts (.10,000 cells/mL;n= 81), who had probable hemochromatosis, based on abnormal values of serum ferritin (.500 ng/mL;n =30), and who had received treatment for anemia within the last 3 months (n =33). Because some individuals met more than one exclusion criterion, the total number eligible for the analysis was 2,332 (952 men, 1,380 women).
Height, weight, and blood pressure were measured. Body mass index (BMI) was calculated by dividing the weight (kilograms) by the height squared (square meters). Waist circumference measure-ments were taken at the end of the normal expiration to the nearest 0.1 cm, measuring from the middle point between the lower border of the rib cage and the iliac crest at the mid-axillary line. Blood samples were obtained in the morning following an overnight fast. The serum concentration of glucose was measured using a Hitachi automatic analyzer 7600 (Tokyo, Japan). The serum ferritin and insulin levels were measured using immunor-adiometric assays with a 1470 Wizard gamma-counter (Perkin-Elmer, Turku, Finland). All clinical analyses were performed by the Neodin Ministry of Health and Welfare. Homeostasis model assessment estimate of insulin resistance (HOMA-IR) was calcu-lated as fasting insulin (mIU/mL)6fasting glucose (mmol/L)/ 22.5.
Participants were questioned about their average amount and frequency of alcohol consumption in the month preceding the interview. Alcohol drinking status was categorized as non-drinking, low-risk non-drinking, and high-risk drinking. High-risk drinking was defined as more than seven drinks (men) or five drinks (women) at a time and more than 2 days per week. Those who drink less than seven drinks (men) or five drinks (women) at a time or drink less than 2 days per week were considered to be low risk drinkers. Participants were grouped as current smokers, past smokers, and non-smokers. Family incomes were defined as low, moderate-low, moderate-high, and high. Education status was categorized as below elementary, middle school, high school, and college or above. Participants also reported whether they had comorbidities, including hypertension, hyperlipidemia, diabetes mellitus, coronary heart disease, stroke, arthritis, osteoporosis, back pain, chronic lung disease, chronic liver disease, renal failure, cancer, peptic ulcers, and depression. Physical activity was ascertained by asking participants how often they engaged in exercise each week including a Korean version of the international physical activity questionnaire (IPAQ). Vigorous physical activity (PA) was defined as 3 or more days of vigorous activity of at least 20 minutes per day. Moderate PA or walking PA was defined as 5 or more days of moderate-intensity activity or walking of at least 30 minutes per day. Short forms of IPAQ identify the frequency and duration of moderate and vigorous-intensity physical activity, walking physical activity, and inactivity during the past week (http://www.ipaq.ki.se). Using the Ainsworth et al. Compendium, an average MET score was derived for each type of activity [22]. The following values continued to be used for the analysis of IPAQ data: Walking = 3.3 METs, Moderate PA = 4.0 METs and Vigorous PA = 8.0 METs. Using these values, four continuous scores were defined as Walking MET-minutes/week = 3.36
walking minutes6 walking days, Moderate MET-minutes/ week = 4.06moderate-intensity activity minutes6moderate days Vigorous MET-minutes/week = 8.06 vigorous-intensity activity
minutes6vigorous-intensity days and total physical activity
Definition of Sarcopenia
Whole and regional body compositions were measured by using whole body dual energy X-ray absorptiometry (DXA; Discovery-W, Hologic, Inc., Waltham, MA, USA). Appendicular skeletal muscle mass (ASM) was calculated as the sum of skeletal muscles in the arms and legs, assuming that all non-fat and non-bone tissue was skeletal muscle. We defined sarcopenia using ASM as a percentage of body weight (ASM/Wt), modified from the report of Janssen et al [23]. To establish the cut-off value for sarcopenia, two standard deviations (SD) below the gender-specific normal mean for the younger reference group (2,606 subjects, aged 19–39) in KNHANES IV was used [24]. The values were 29.33% (ASM/ Wt) in men and 23.06% (ASM/Wt) in women.
Ethical Issues
Because the KNHANES IV survey data are publicly available (http://knhanes.cdc.go.kr/knhanes/), ethical approval was not required for this study. Prior to the survey, all participants were informed that they had been randomly chosen to participate in the KNHANES IV survey with the right to refuse to be involved in further analyses, and signed informed consents were obtained. The data we used from the KNHANES database were fully anonymized.
Statistical Analysis
Data are expressed as means6SD or percentages. The clinical characteristics of the study population were analyzed by an independent t-test for continuous variables and a chi-square test for categorical variables. All analyses were performed separately for elderly men and women, including calculation of gender-specific tertiles for serum ferritin levels. The chi-square test was used to compare the differences in the prevalence of sarcopenia using different methods among tertile groups of serum ferritin levels. The relationships between ASM percent and clinical variables were examined using Spearman correlation analysis. We calculated the odds ratios (ORs) and 95% confidence intervals (CI) for sarcopenia in tertile groups of serum ferritin using logistic regression models after adjusting for age, BMI, waist circumfer-ence, comorbidity, protein intake, physical activity, hemoglobin, WBC count, vitamin D, and HOMA-IR. Due to their skewed distributions, energy intake, physical activity and HOMA-IR values were logarithmically transformed. To estimate p for trends, the ferritin tertile group variable was regarded as a continuous variable in the trend analysis. All statistical results were based on two-sided tests. Data were analyzed using the SPSS software (ver. 15.0 for Windows; SPSS Inc., Chicago, IL, USA).
Results
1. Clinical Characteristics of Subjects
Anthropometric characteristics of the subjects are provided in Table 1. The mean age was 69.066.3 years in men and 69.366.4 years in women (p = 0.354). The ASM percent was 37.663.2% in men and 29.863.1% in women (p,0.001). The proportions of subjects with very old age (.80 years; p = 0.007 in men; p = 0.002 in women), obesity (BMI.25 kg/m2; p,0.001 in both), and additional (.3) comorbidities (p = 0.016 in men; p,0.001 in women) were higher in men and women with sarcopenia in than those without sarcopenia. HOMA-IR was much higher in the sarcopenia group (p,0.001 in both), while the vitamin D level was lower in the sarcopenia group (p,0.001 in men, p = 0.001 in women). The serum ferritin level was much lower in women than men (men without sarcopenia 115.7 ng/mL and sarcopenia 134.4 ng/mL vs. women without sarcopenia 70.7 ng/mL and
with sarcopenia 85.4 ng/mL). Furthermore, women with sarco-penia showed a significantly higher level of serum ferritin than women without sarcopenia (p = 0.001; Table 2). We observed a positive association between ASM percent and serum ferritin (after log-transformation) in men and women (r =20.096, p = 0.003 in men, r =20.126, p,0.001 in women; Fig. 1).
2. Factors Associated with Sarcopenia in Older Koreans When we used ASM percentage as the definition of sarcopenia, the prevalence of sarcopenia increased as the tertile of serum ferritin increased. However, statistical significance was only seen in elderly women (1sttertile 6.3%, 2ndtertile 8.0%, 3rdtertile 12.0%; p = 0.008; Table 3).
Spearman correlation analysis showed that ASM percentage was negatively associated with ferritin level (r =20.111, p = 0.001 in men; r =20.104, p,0.001 in women), BMI (r =20.488, p,
0.001 in men; r =20.595, p,0.001 in women), waist circumfer-ence (r =20.523, p,0.001 in men; r =20.587, p,0.001 in women), body fat (r =20.862, p,0.001 in men; r =20.885, p,
0.001 in women), number of comorbidities (r =20.184, p,0.001 in men; r =20.197, p,0.001 in women), WBC count (r =2
0.182, p,0.001 in men; r =20.180, p,0.001 in women), hemoglobin level (r =20.107, p = 0.001 in men; r =20.138, p,
0.001 in women), and HOMA-IR (r =20.416, p,0.001 in men; r =20.344, p,0.001 in women), and it was positively associated with energy intake (r = 0.142, p,0.001 in men; r = 0.133, p,
0.001 in women), physical activity (r = 0.174, p,0.001 in men; r = 0.136, p,0.001 in women), and vitamin D levels (r = 0.258, p,0.001 in men; r = 0.144, p,0.001 in women) in men and women (Table 4).
3. Prevalence and Odds Ratios of Sarcopenia According to Serum Ferritin Quartiles
Logistic regression analyses were conducted to investigate the association between serum ferritin tertile and sarcopenia in the elderly population (Table 5). Men and women were divided into tertiles according to levels of serum ferritin (ng/mL; 1sttertile,#
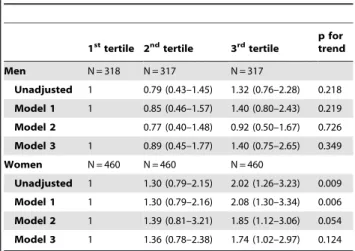
69.51, 2ndtertile, 69.52–130.40, 3rdtertile, .130.40 in men: 1st tertile, #45.90, 2nd tertile, 45.91–77.45, 3rd tertile, .77.45 in women). In comparison with individuals categorized in the serum ferritin 1sttertile, the OR (95% CI) for sarcopenia in individuals categorized in the serum ferritin 3rdtertile was 2.02 (1.26–3.23) in women, when not adjusted (p for trend = 0.009). The OR for sarcopenia was attenuated but remained statistically significant in women after adjusting for age and height (2.08 (1.30–3.34), p for trend = 0.006; Model 1). When adjusting for age and BMI (Model 2), OR for sarcopenia of individuals categorized in the serum ferritin 3rd tertile was 1.85 (1.12–3.06) in women (p for trend = 0.054). In Model 3, after adjusting for age, height, BMI, comorbidities, energy intake, physical activity, hemoglobin, WBC count, vitamin D, and HOMA-IR, the OR and 95% CI for sarcopenia with respect to the 3rdtertile was 1.74 (1.02–2.97) in women (p for trend = 0.124). There was no statistically significant association between sarcopenia and serum ferritin tertiles in men.
Discussion
Figure 1. Association between ASM percent and serum ferritin (after log-transformation) in both sexes (r =20.096, p = 0.003 in men, r =20.126, p,0.001 in women).
doi:10.1371/journal.pone.0090105.g001
Table 1.Clinical characteristics of subjects.
Variables Study population Reference groups
Men (N = 952) Women (N = 1380) P-value Men (N = 1001) Women (N = 1605) P-value
Age (years) 69.066.3 69.366.4 0.354 31.065.5 31.265.5 0.313
Anthropometrics
Height (cm) 165.365.9 151.565.9 ,0.001 173.265.9 160.465.5 ,0.001
Weight (kg) 64.169.8 55.668.7 ,0.001 71.4611.1 56.869.5 ,0.001
BMI (kg/m2) 23.4
63.0 24.263.2 ,0.001 23.863.3 22.163.5 ,0.001
Waist circum (cm) 85.069.1 83.369.5 ,0.001 81.969.1 74.169.4 ,0.001
Total fat mass (kg) 14.264.8 18.765.3 ,0.001 14.965.9 17.765.6 ,0.001
Total muscle mass (kg) 49.266.4 36.464.5 ,0.001 55.766.8 38.564.9 ,0.001
ASM (kg) 21.263.1 14.662.0 ,0.001 25.263.5 15.962.4 ,0.001
ASM/Height2(kg/m2) 7.7
60.9 6.360.7 ,0.001 8.460.9 6.260.8 ,0.001
Fat percent (%) 21.965.2 33.465.5 ,0.001 20.665.8 30.965.4 ,0.001
ASM percent (%) 37.663.2 29.863.1 ,0.001 35.563.1 28.262.6 ,0.001
from this cross-sectional study. Although the pathogenic connec-tion between serum ferritin and sarcopenia is not understood, oxidative stress and chronic inflammation may play role in the development and progression of sarcopenia.
Iron is a transition metal that can cause oxidative tissue damage by inducing free radical formation [25,26]. Free radicals have deleterious effects on many cellular structures, leading to cellular stress and subsequent tissue damage [26–28]. Merkel et al. reported that muscular iron accumulation decreased glucose uptake due to muscle damage [29]. Since Kondo et al. demon-strated the importance of iron overload in muscle atrophy by showing mitigation of oxidative damage and attenuation of muscle mass loss after iron chelation in hind limb immobilized rats [30], several studies have reported muscular iron accumulation with aging and atrophying conditions [20,21,31–33]. Iron accumula-tion in skeletal muscle has been suggested to contribute to the
pathogenesis of sarcopenia and acute muscle atrophy [34]. Hofer et al. reported increased non-heme iron levels to 233% in rat gastrocnemius muscles with age [32]. After hind limb suspension, further elevation of non-heme iron levels in older rats, but not in young rats, were also demonstrated. In the same study, free iron accumulation was found in atrophied fibers rather than normal fibers. These results suggested a causal relation between iron overload and loss of muscle mass. Xu et al. [33] also found that total non-heme iron levels increased progressively with age in the rat gastrocnemius muscle. This increase in non-heme iron levels was also correlated with both decreased muscle mass and grip strength.
According to the mitochondrial free radical theory of aging (MFRTA), mitochondrial dysfunction due to oxidative damage to mitochondrial DNA is a major mechanism in the aging process [35]. Iron accumulation within mitochondria may enhance
Table 2.Clinical characteristics of Korean elders according to sarcopenia.
Variables Men Women
Without sarcopenia (N = 875)
With sarcopenia
(N = 77) P-value
Without sarcopenia (N = 1259)
With sarcopenia
(N = 121) P-value
Age (over 80 years old) 54 (6.2) 11 (14.3) 0.007 548 (43.5) 70 (57.9) 0.002
BMI (over 25 kg/m2) 216 (24.7) 46 (59.7) ,0.001 440 (34.9) 91 (75.2) ,0.001
Hx of Smoking 717 (81.9) 60 (77.9) 0.383 124 (9.8) 11 (9.1) 0.789
Alcohol drinking (low risk and high risk)
618 (70.6) 56 (72.7) 0.698 490 (38.9) 30 (24.8) 0.002
Marital status (coupled) 803 (91.8) 72 (93.5) 0.592 573 (45.5) 68 (56.2) 0.024
Region (urban) 497 (56.8) 49 (63.6) 0.245 721 (57.3) 77 (63.6) 0.175
Family income (low) 355 (40.6) 35 (45.5) 0.404 642 (51.0) 63 (52.1) 0.822
Education (elementary) 419 (47.9) 35 (45.5) 0.682 1041 (82.7) 104 (86.0) 0.361
Comorbidity (3 or more) 200 (22.9) 27 (35.1) 0.016 612 (48.6) 84 (69.4) ,0.001
Energy intake (above average) 448 (51.2) 28 (36.4) 0.013 642 (51.0) 48 (39.7) 0.017 Protein intake (above average) 443 (50.6) 33 (42.9) 0.191 643 (51.1) 47 (38.8) 0.010 Physical activity (above average) 444 (50.7) 33 (42.9) 0.185 640 (50.8) 50 (41.3) 0.046
WBC count 6.1361.39 6.4261.47 0.080 5.6961.42 6.3261.53 ,0.001
Ferritina 115.7
682.1 134.4698.2 0.250 70.7650.3 85.4657.9 0.001
HOMA-IRa 2.25
61.45 3.1661.76 ,0.001 2.5861.94 4.26610.31 ,0.001
Vitamin D 23.367.7 19.566.9 ,0.001 20.0567.6 17.766.9 0.001
Data are mean6S.D or N (%).
aValues have been analyses after log-transformation.
doi:10.1371/journal.pone.0090105.t002
Table 3.Prevalence of the sarcopenia according to gender-specific tertile of serum ferritin.
tertile of serum ferritin (ng/ml)
Men (n = 952) 1sttertile (n = 318) 2ndtertile (n = 317) 3rdtertile (n = 317) P-value
Sarcopenia prevalence (%) 25 (7.9) 20 (6.3) 32 (10.1) 0.213
Women (n = 1380) 1sttertile (n = 460) 2ndtertile (n = 460) 3rdtertile (n = 460) P-value
Sarcopenia prevalence (%) 29 (6.3) 37 (8.0) 55 (12.0) 0.008
Data are N (%). P-values were calculated by chi-square test. Serum ferritin levels are as follows: for men-1stQ (
#69.51), 2ndQ (69.52–130.40), 3rdQ (130.40
,); for women-1stQ (
#45.90), 2ndQ (45.91–77.45), 3rdQ (77.45 ,), respectively.
susceptibility to apoptosis during the development of sarcopenia, through exacerbation of oxidative stress. Iron accumulation was also found in rat skeletal muscle and liver mitochondria with aging. Mitochondrial non-heme iron levels showed positive correlations with caspase-9 and caspase-3 activities, which are activated during cell apoptosis, and total muscle non-heme iron also showed a positive correlation with the extent of apoptotic DNA fragmentation [31].
Several studies have reported associations between serum ferritin levels and metabolic disorders, including hypertension, dyslipidemia, insulin resistance, type 2 diabetes, and obesity. Some possible mechanisms for the association between serum ferritin and metabolic disorders have been proposed. Elevated body iron may contribute to insulin resistance through oxidative stress and chronic inflammation [17]. Under oxidative stress, elevated serum ferritin may promote abnormal insulin secretion by pancreatic b-cells and impairment of insulin extraction by the liver [17,18]. Chronic oxidative stress is associated with dysfunction of b-oxidation of long chain fatty acids in the mitochondria and with b cell dysfunction in the pancreas [36,37]. Skeletal muscle damage by iron overload is also responsible for diminished insulin-mediated glucose disposal, independent of obesity [38]. Regarding the results above, serum ferritin levels could be a predictor of sarcopenia and an important bridge between sarcopenia and metabolic disorders. Further studies are required to confirm whether elevated serum
ferritin predicts sarcopenia, or whether it is merely a secondary marker of metabolic abnormalities.
In this study, the association between sarcopenia and serum ferritin levels was more prominent in elderly women than in elderly men. There are some possible explanations for this observation. Gavin et al. suggested the iron set-point theory [39] which states that healthy elderly individuals have different steady state levels of iron stores, which may be under genetic control. At steady state, iron absorption is limited to the minimal amounts necessary to cover basal iron losses. However, the age at which an individual reaches his or her iron stores set-point has not yet been determined. Garry et al. [40] suggested that this may occur at age ,40 years in men and after menopause in women. Thus, they considered that the time was not sufficient for postmenopausal women to have reached steady-state levels of iron stores, and thus, there was a significant increase in iron stores with age in women. Consistent with this, the use of hormone replacement therapy could delay reaching steady-state iron levels, due to continued blood loss through menstruation. From set-point theory, a significant increase in iron could explain the association between iron and sarcopenia, especially in elderly women. Also, many studies have shown more prominent correlations between serum ferritin levels and metabolic disorders and higher odds ratios for metabolic disorders according to serum ferritin concentrations in elderly women than in men [12,41–43].
When interpreting our results, several study limitations should be considered. First, the cross-sectional nature of this study made it impossible to assess any cause-and-effect relationships. Further prospective research is warranted to better understand causal relationships between serum ferritin levels and sarcope-nia. Second, because only community-dwelling individuals were included in this study, all participants were relatively healthy. Thus, the prevalence of sarcopenia may have been underesti-mated. Third, serum ferritin is an acute-phase reactant and may be increased under inflammatory conditions. Even though we excluded individuals who had increased WBC counts (.10,000 cells/mL) and adjusted for WBC counts to control for
Table 4.Correlation between appendicular skeletal muscle percentages (ASM%) and clinical variables.
Variables Men (N = 952) Women (N = 1380)
r P-value r P-value
Age (years) 20.081 0.012 20.004 0.888
Adiposity index
Height (cm) 0.057 0.080 0.031 0.246
Weight (kg) 20.376 ,0.001 20.487 ,0.001 Appendicular skeletal
muscle (kg)
0.158 ,0.001 0.176 ,0.001
Total fat mass (kg) 20.751 ,0.001 20.749 ,0.001 Body mass index (kg/m2)
20.488 ,0.001 20.595 ,0.001 Waist circumference (cm) 20.523 ,0.001 20.587 ,0.001 Body fat (%) 20.862 ,0.001 20.885 ,0.001 Clinical parameters
Number of comorbidity 20.184 ,0.001 20.197 ,0.001 Physical activity
(MET2min/week)
0.174 ,0.001 0.136 ,0.001
Energy intake (Cal/day) 0.142 ,0.001 0.133 ,0.001 Protein intake (g/day) 0.069 0.034 0.179 0.003 Iron intake (mg/day) 0.025 0.449 0.028 0.304 HOMA-IRb
20.416 ,0.001 20.344 ,0.001 Vitamin D (ng/ml) 0.258 ,0.001 0.144 ,0.001 Ferritin (ng/mL) 20.111 0.001 20.104 ,0.001 Hemoglobin (g/dL) 20.107 0.001 20.138 ,0.001 WBC count (* 103)
20.182 ,0.001 20.180 ,0.001 Correlation coefficients (r) and P-values were calculated using the Spearman correlation analysis.
doi:10.1371/journal.pone.0090105.t004
Table 5.Odds ratios of the sarcopenia among Korean elders according to the tertile of serum ferritin.
1sttertile 2ndtertile 3rdtertile p fortrend
Men N = 318 N = 317 N = 317
Unadjusted 1 0.79 (0.43–1.45) 1.32 (0.76–2.28) 0.218 Model 1 1 0.85 (0.46–1.57) 1.40 (0.80–2.43) 0.219 Model 2 0.77 (0.40–1.48) 0.92 (0.50–1.67) 0.726 Model 3 1 0.89 (0.45–1.77) 1.40 (0.75–2.65) 0.349
Women N = 460 N = 460 N = 460
Unadjusted 1 1.30 (0.79–2.15) 2.02 (1.26–3.23) 0.009 Model 1 1 1.30 (0.79–2.16) 2.08 (1.30–3.34) 0.006 Model 2 1 1.39 (0.81–3.21) 1.85 (1.12–3.06) 0.054 Model 3 1 1.36 (0.78–2.38) 1.74 (1.02–2.97) 0.124 Model 1: Adjusted for age and height.
Model 2: Adjusted for age and body mass index.
Model 3: Adjusted for age, height, BMI, comorbidity, log(energy intake), log(physical activity), hemoglobin, WBC count, Vitamin D and log(HOMA-IR). Serum ferritin levels are as follows: for men-1sttertile (
#69.51), 2ndtertile
(69.52–130.40), 3rdtertile (130.40
,); for women-1sttertile (
#45.90), 2ndtertile
(45.91–77.45), 3rdtertile (77.45
confounding factors, we could not adjust for CRP as an inflammatory marker because it was not checked the KNHANES IV. Fourth, even though the European Working Group on Sarcopenia in Older People (EWGSOP) developed a practical clinical definition and diagnostic criteria for age-related sarcopenia using the presence of both low muscle mass and low muscle function (strength and performance) [44], most previous studies have used the term ‘sarcopenia’ to indicate only indicating low muscle mass. In this study, we used a definition of sarcopenia in which ASM was taken as a percentage of body weight because this showed a closer association with metabolic parameters than when defined by ASM/height2 [45]. Finally, because of the nature of the survey questionnaires, we could not exclude the effects of information bias.
Despite these limitations, the present study has several strengths. First, we used data from a reliable nationally representative database, including ASM, which was measured
directly with DXA. Second, strict quality controls were applied to the study procedures within KNHANES.
In conclusion, we have demonstrated that elevated serum ferritin levels were associated with an increased prevalence of sarcopenia in a representative sample of older Korean women but not in older Korean men. Prospective studies are needed to understand the role of ferritin in sarcopenia and to determine whether elevated iron stores precede the development of sarcopenia and whether a threshold exists above which ferritin levels are associated with an increased risk.
Author Contributions
Conceived and designed the experiments: THK HJH SHK. Performed the experiments: SHK. Analyzed the data: THK SHK. Contributed reagents/ materials/analysis tools: THK HJK SHK. Wrote the paper: THK.
References
1. Rosenberg IH (1989) Summary comments. Am J Clin Nutr 50: 1231–1233. 2. Chin SO, Rhee SY, Chon S, Hwang YC, Jeong IK, et al. (2013) Sarcopenia is
independently associated with cardiovascular disease in older Korean adults: the Korea National Health and Nutrition Examination Survey (KNHANES) from 2009. PLoS One 8: e60119.
3. Kalyani RR, Metter EJ, Ramachandran R, Chia CW, Saudek CD, et al. (2012) Glucose and insulin measurements from the oral glucose tolerance test and relationship to muscle mass. J Gerontol A Biol Sci Med Sci 67: 74–81. 4. Kim YS, Lee Y, Chung YS, Lee DJ, Joo NS, et al. (2012) Prevalence of
sarcopenia and sarcopenic obesity in the Korean population based on the Fourth Korean National Health and Nutritional Examination Surveys. J Gerontol A Biol Sci Med Sci 67: 1107–1113.
5. Kim KS, Kim SK, Sung KM, Cho YW, Park SW (2012) Management of type 2 diabetes mellitus in older adults. Diabetes Metab J 36: 336–344.
6. Heeney MM, Andrews NC (2004) Iron homeostasis and inherited iron overload disorders: an overview. Hematol Oncol Clin North Am 18: 1379–1403, ix. 7. Cook JD, Flowers CH, Skikne BS (2003) The quantitative assessment of body
iron. Blood 101: 3359–3364.
8. Tuomainen TP, Nyyssonen K, Salonen R, Tervahauta A, Korpela H, et al. (1997) Body iron stores are associated with serum insulin and blood glucose concentrations. Population study in 1,013 eastern Finnish men. Diabetes Care 20: 426–428.
9. Sheu WH, Chen YT, Lee WJ, Wang CW, Lin LY (2003) A relationship between serum ferritin and the insulin resistance syndrome is present in non-diabetic women but not in non-diabetic men. Clin Endocrinol (Oxf) 58: 380–385. 10. Kim CH, Kim HK, Bae SJ, Park JY, Lee KU (2011) Association of elevated
serum ferritin concentration with insulin resistance and impaired glucose metabolism in Korean men and women. Metabolism 60: 414–420.
11. Park SK, Ryoo JH, Kim MG, Shin JY (2012) Association of serum ferritin and the development of metabolic syndrome in middle-aged Korean men: a 5-year follow-up study. Diabetes Care 35: 2521–2526.
12. Jehn M, Clark JM, Guallar E (2004) Serum ferritin and risk of the metabolic syndrome in U.S. adults. Diabetes Care 27: 2422–2428.
13. Jiang R, Manson JE, Meigs JB, Ma J, Rifai N, et al. (2004) Body iron stores in relation to risk of type 2 diabetes in apparently healthy women. JAMA 291: 711– 717.
14. Haidari M, Javadi E, Sanati A, Hajilooi M, Ghanbili J (2001) Association of increased ferritin with premature coronary stenosis in men. Clin Chem 47: 1666–1672.
15. Williams MJ, Poulton R, Williams S (2002) Relationship of serum ferritin with cardiovascular risk factors and inflammation in young men and women. Atherosclerosis 165: 179–184.
16. Furukawa S, Fujita T, Shimabukuro M, Iwaki M, Yamada Y, et al. (2004) Increased oxidative stress in obesity and its impact on metabolic syndrome. J Clin Invest 114: 1752–1761.
17. Wilson JG, Lindquist JH, Grambow SC, Crook ED, Maher JF (2003) Potential role of increased iron stores in diabetes. Am J Med Sci 325: 332–339. 18. Ferrannini E (2000) Insulin resistance, iron, and the liver. Lancet 355: 2181–
2182.
19. Schrager MA, Metter EJ, Simonsick E, Ble A, Bandinelli S, et al. (2007) Sarcopenic obesity and inflammation in the InCHIANTI study. J Appl Physiol 102: 919–925.
20. Jung SH, DeRuisseau LR, Kavazis AN, DeRuisseau KC (2008) Plantaris muscle of aged rats demonstrates iron accumulation and altered expression of iron regulation proteins. Exp Physiol 93: 407–414.
21. Altun M, Edstrom E, Spooner E, Flores-Moralez A, Bergman E, et al. (2007) Iron load and redox stress in skeletal muscle of aged rats. Muscle Nerve 36: 223– 233.
22. Ainsworth BE, Haskell WL, Whitt MC, Irwin ML, Swartz AM, et al. (2000) Compendium of physical activities: an update of activity codes and MET intensities. Med Sci Sports Exerc 32: S498–504.
23. Janssen I, Heymsfield SB, Ross R (2002) Low relative skeletal muscle mass (sarcopenia) in older persons is associated with functional impairment and physical disability. J Am Geriatr Soc 50: 889–896.
24. Baumgartner RN (2000) Body composition in healthy aging. Ann N Y Acad Sci 904: 437–448.
25. Cooksey RC, Jouihan HA, Ajioka RS, Hazel MW, Jones DL, et al. (2004) Oxidative stress, beta-cell apoptosis, and decreased insulin secretory capacity in mouse models of hemochromatosis. Endocrinology 145: 5305–5312. 26. Wolff SP (1993) Diabetes mellitus and free radicals. Free radicals, transition
metals and oxidative stress in the aetiology of diabetes mellitus and complications. Br Med Bull 49: 642–652.
27. Andrews NC (1999) Disorders of iron metabolism. N Engl J Med 341: 1986– 1995.
28. Beard JL (2001) Iron biology in immune function, muscle metabolism and neuronal functioning. J Nutr 131: 568S–579S; discussion 580S.
29. Merkel PA, Simonson DC, Amiel SA, Plewe G, Sherwin RS, et al. (1988) Insulin resistance and hyperinsulinemia in patients with thalassemia major treated by hypertransfusion. N Engl J Med 318: 809–814.
30. Kondo H, Miura M, Kodama J, Ahmed SM, Itokawa Y (1992) Role of iron in oxidative stress in skeletal muscle atrophied by immobilization. Pflugers Arch 421: 295–297.
31. Seo AY, Xu J, Servais S, Hofer T, Marzetti E, et al. (2008) Mitochondrial iron accumulation with age and functional consequences. Aging Cell 7: 706–716. 32. Hofer T, Marzetti E, Xu J, Seo AY, Gulec S, et al. (2008) Increased iron content
and RNA oxidative damage in skeletal muscle with aging and disuse atrophy. Exp Gerontol 43: 563–570.
33. Xu J, Knutson MD, Carter CS, Leeuwenburgh C (2008) Iron accumulation with age, oxidative stress and functional decline. PLoS One 3: e2865.
34. Marzetti E, Lees HA, Wohlgemuth SE, Leeuwenburgh C (2009) Sarcopenia of aging: underlying cellular mechanisms and protection by calorie restriction. Biofactors 35: 28–35.
35. Miquel J, Economos AC, Fleming J, Johnson JE Jr (1980) Mitochondrial role in cell aging. Exp Gerontol 15: 575–591.
36. Yao D, Shi W, Gou Y, Zhou X, Yee Aw T, et al. (2005) Fatty acid-mediated intracellular iron translocation: a synergistic mechanism of oxidative injury. Free Radic Biol Med 39: 1385–1398.
37. Valko M, Leibfritz D, Moncol J, Cronin MT, Mazur M, et al. (2007) Free radicals and antioxidants in normal physiological functions and human disease. Int J Biochem Cell Biol 39: 44–84.
38. Srikanthan P, Hevener AL, Karlamangla AS (2010) Sarcopenia exacerbates obesity-associated insulin resistance and dysglycemia: findings from the National Health and Nutrition Examination Survey III. PLoS One 5: e10805. 39. Gavin MW, McCarthy DM, Garry PJ (1994) Evidence that iron stores regulate
iron absorption–a setpoint theory. Am J Clin Nutr 59: 1376–1380.
40. Garry PJ, Hunt WC, Baumgartner RN (2000) Effects of iron intake on iron stores in elderly men and women: longitudinal and cross-sectional results. J Am Coll Nutr 19: 262–269.
41. Vari IS, Balkau B, Kettaneh A, Andre P, Tichet J, et al. (2007) Ferritin and transferrin are associated with metabolic syndrome abnormalities and their change over time in a general population: Data from an Epidemiological Study on the Insulin Resistance Syndrome (DESIR). Diabetes Care 30: 1795–1801. 42. Yoon JH, Linton JA, Koh SB, Kang HT (2012) Serum ferritin concentrations
43. Lee BK, Kim Y, Kim YI (2011) Association of serum ferritin with metabolic syndrome and diabetes mellitus in the South Korean general population according to the Korean National Health and Nutrition Examination Survey 2008. Metabolism 60: 1416–1424.
44. Cruz-Jentoft AJ, Baeyens JP, Bauer JM, Boirie Y, Cederholm T, et al. (2010) Sarcopenia: European consensus on definition and diagnosis: Report of the
European Working Group on Sarcopenia in Older People. Age Ageing 39: 412– 423.