Association of Magnesium Intake with High
Blood Pressure in Korean Adults: Korea
National Health and Nutrition Examination
Survey 2007
–
2009
Mi-Kyeong Choi1, Yun Jung Bae2*
1Division of Food Science, Kongju National University, Yesan, Republic of Korea,2Division of Food Science and Culinary Arts, Shinhan University, Uijeongbu, Republic of Korea
*byj@shinhan.ac.kr
Abstract
Background
Magnesium is known to lower the risk of cardiovascular disease. However, studies on its relationship with hypertension, a single and common cause of various chronic diseases, are limited and their findings are not consistent. The purpose of the present study is to identify the relationship between magnesium intake and high blood pressure (HBP) risk in Koreans.
Methods
This research is a cross-sectional study based on the 2007~2009 Korean National Health and Nutritional Examination Survey data. This study investigated 11,685 adults aged over 20 to examine their general characteristics, anthropometry and blood pressure. Daily mag-nesium intake was analyzed using the 24-hour dietary recall method. To calculate the odds ratio (OR) of HBP risk (130/85 mmHg or over) according to the quartile of magnesium intake (mg/1000kcal) together with its 95% confidence interval (CI), multivariable logistic regres-sion analysis was performed.
Results
No significant association between dietary magnesium intake and the risk of HBP was found. In obese women, particularly, after adjusting relevant factors, the adjusted odds ratio of HBP prevalence in the highest magnesium intake quartile was 0.40 compared with the lowest magnesium intake quartile (95% CI = 0.25~0.63, P for trend = 0.0014). Women, especially obese women, were found to have a negative relationship of magnesium intake with HBP.
Conclusions
The present results indicate that sufficient magnesium intake could be useful in decreasing the high blood pressure risk of obese women.
OPEN ACCESS
Citation:Choi M-K, Bae YJ (2015) Association of Magnesium Intake with High Blood Pressure in Korean Adults: Korea National Health and Nutrition Examination Survey 2007–2009. PLoS ONE 10(6):
e0130405. doi:10.1371/journal.pone.0130405
Academic Editor:Tatsuo Shimosawa, The University of Tokyo, JAPAN
Received:February 5, 2015
Accepted:May 20, 2015
Published:June 15, 2015
Copyright:© 2015 Choi, Bae. This is an open access article distributed under the terms of the
Creative Commons Attribution License, which permits unrestricted use, distribution, and reproduction in any medium, provided the original author and source are credited.
Data Availability Statement:Data used in this study are from the Korean CDC (https://knhanes.cdc.go.kr/ knhanes/index.do). After creating an account at this site, interested readers can access the raw data from the 1998–2013 Korea National Health and Nutrition
Examination Survey.
Funding:The authors received no specific funding for this work.
Introduction
Cardiovascular diseases (CVD) are caused by abnormalities in the heart and blood vessels and mainly include conditions such as coronary heart disease, stroke, hypertension, peripheral vas-cular disease, rheumatic heart disease and heart failure [1]. Hypertension is a significant public health concern with world-wide distribution and is also the most common cardiovascular dis-ease risk factor [2]. In Korea, it is also reported that CVD accounts for 9.5% of total causes of death [3], and the prevalence rate of hypertension (systolic blood pressure (SBP) above 140 mmHg or diastolic blood pressure (DBP) of 90 mmHg / taking antihypertensive medication) of adults above 30 is 31.5% [4], thus, the risk of high blood pressure is quite severe. However, it is believed that hypertension rarely presented clear symptoms until blood pressure goes extremely high with concomitant complications.
The number of hypertension patients is steadily growing, and controlling high blood pres-sure and identifying its prevention factors are urgent tasks. Various dietary factors, such as obe-sity, aging, decreased physical activity and excessive sodium intake, are one of the causes of high blood pressure. Based on strong evidence, excessive sodium intake is a causal risk factor for hypertension, whereas a diet rich in fruit, vegetables, and low-fat dairy products and low in sodium and saturated fat has been recommended to prevent and reduce hypertension [5]. It is reported that the consumption of plant foods, in particular, leads to a reduction in systolic blood pressure [6]. Plant foods may confer beneficial effects on blood pressure control through their rich array of nutrients and constituents (e.g., fiber, magnesium, potassium, and other food components) and on satiety, body mass, and insulin sensitivity [6].
Magnesium is a major mineral that exists in the human body at a level of approximately 25 g. Magnesium, as a constituent of chlorophyll, is contained in large quantities of green leafy vegetables. In particular, magnesium given in conjunction with taurine lowers blood pressure, improves insulin resistance, retards atherogenesis, prevents arrhythmias, and stabilizes plate-lets [7]. In addition, a previous study reported that with regard to CVD diseases, magnesium prevents calcification of atherosclerotic plaques, and self-reported magnesium intake has an inverse correlation with arterial calcification [8]. Various epidemiologic, observational, and clinical trial data show that a diet high in magnesium (at least 500~1000 mg/day) lowers blood pressure; however, the conclusions are not consistent, and these studies are mostly conducted in Western countries, where plant food intake is not so popular [9,10].
Koreans have kept their traditional diet pattern, which consists mostly of plant foods, and the intake rate of plant food is up to 79.4% [4]. Therefore, considering that magnesium is mainly supplied through plant food, magnesium deficiency has not been a concern. However, according to the recent analysis of magnesium intake amount of Korean adults, men showed intakes of 301~321 mg/day (the rates of subjects with magnesium intakes lower than the EAR: 50.0~57.4%) and women 230~247 mg/day (the rates of subjects with magnesium intakes lower than the EAR: 53.5~62.6%) [11].
Subjects and Methods
Study population
The data analyzed in this study were obtained from the Korean National Health and Nutri-tional Examination Survey (KNHANES) performed between 2007 and 2009, which used a roll-ing samplroll-ing design involvroll-ing a complex, stratified, multistage, probability-cluster survey of a representative sample of the non-institutionalized civilian Korean population [12]. The survey data were compiled through a health interview (physical examination), health examination (anthropometric measurements and blood pressure measurement), and a nutrition survey. The KNHANES received ethical approval by the Institutional Review Board of the Korea Centers for Disease Control and Prevention (KCDC) (IRB No: 2007-02-CON-04-P, 2008-04EXP-01-C, 2009-01CON-03-2C), and written consent was obtained from all of the participants. In addi-tion, this survey was conducted according to the guidelines laid down in the Declaration of Helsinki.
Of 15,077 NHANES participants during 2007~2009 who were20 years of age and gave reli-able information on the nutrition survey, we excluded participants who did not report their diag-nosed hypertension status or who reported taking antihypertensive medication (n = 3,019), those who were pregnant (n = 102), those who did not provide socio-demographics information (smoking, alcohol intake, and physical activity) (n = 87), those with missing blood pressure data (n = 16), and those who reported implausible dietary intakes (lower than 500 kcal/day or greater than 5,000 kcal/day) (n = 168). Finally, 11,685 subjects aged 20 years and older were included in the analysis.
General Characteristics, Anthropometrics, and Blood Pressure
Measurements
The health examination included anthropometric measurements (height, body weight, and body mass index (BMI)) and blood pressure measurements. In the health interview, a question-naire including information on sex, age, smoking history, alcohol intake, physical activity, education level, income, and menopausal status was administered by trained interviewers. Metabolic Equivalent of Task values (METs) were used to classify physical activity as low, mid-dle, or high. METs are multiples of the resting metabolic rates and were calculated using the short form (version 2.0, April 2004) of the International Physical Activity Questionnaire.
Height was measured within 0.1 cm, and body weight was measured with a metric weight scale to the nearest 0.1 kg in light clothing without shoes. BMI was calculated as body weight in kilograms divided by height in meters squared. Three blood pressure measurements were taken at the mobile examination center by a trained and certified observer following the KNHANES protocol. Systolic and diastolic blood pressures (SBP and DBP) were three times on the right arm while the individual was in a seated position after at least 5 min of rest using a standard sphygmomanometer. The average of the second and third measurements for both SBP and DBP was used in the analysis.
Dietary Assessment and Magnesium Database
on magnesium content in the database. Foods not included in the magnesium content database were calculated by replacing them with similar foods in the database.
Dietary nutrient intakes were assessed by the provided energy and 11 nutrients based on the dietary reference intakes for Koreans. From these data, we selected nutrients including energy intake, carbohydrate, protein and fat intake as a percentage of energy, and crude fiber, calcium, sodium and potassium intake.
Statistical Analysis
All statistical analyses were performed using SAS software (version 9.3, SAS Institute Inc., Cary, NC, USA) through a“survey procedure”. The participants’characteristics were com-pared according to the magnesium intake (mg/1000 kcal) quartiles. Data were presented as mean±SE or as percentage (% and SE) and were age-adjusted. Multivariable logistic regression analysis was performed to estimate the odds ratio (OR) and 95% confidence interval (CI) of high blood pressure according to the magnesium intake quartiles, using the lowest quartile as the reference. High blood pressure was defined as SBP readings over 130 mmHg, or DBP over 85 mmHg. Although the typical diagnostic criterion for hypertension is SBP over 140 mmHg or DBP over 90 mmHg, the criterion of high blood pressure for diagnosing metabolic syn-drome was used so that the correlation with magnesium intake at an elevated blood pressure level before disease morbidity could be analyzed [15].
In addition, when analyzing the risk of high blood pressure by magnesium intake level through regression analysis in this study, an intake amount of magnesium per 1000 kcal was analyzed to exclude the risk of the conclusion being affected by the total energy intake. Indeed, when classifying the group according to raw intake of magnesium, a significant difference of energy intake by groups existed. ORs were initially calculated following adjustment for age (continuous), sex, and BMI (continuous) in model 1. In model 2, variables that were further adjusted for included education (elementary school or less, middle or high school, college or more), monthly household income (quartiles of household income), and physical activity (MET). Smoking status (never smoker, past smoker, current smoker) and frequency of alcohol consumption (none,<1 time/month, 2~4 times/month,2 times/week) were also adjusted. In addition, dietary factors such as total energy (kcal/day), carbohydrate (%energy), total fat (% energy), fiber (g/1000 kcal), calcium (mg/1000 kcal), and sodium (mg/1000 kcal) intakes were adjusted for as continuous variables in model 3.
Moreover, because the OR of having high blood pressure according to magnesium intake may be different between men and women, an analysis based on sex was performed. Because obesity is related to high blood pressure [16], the OR of high blood pressure according to obe-sity level by sex (BMI 25 kg/m2, as standard) was also calculated. The reported probability values were 2-sided and a p<0.05 was considered to be statistically significant.
Results
The general characteristic and daily dietary intakes by quartile of dietary magnesium intake are shown inTable 1. The mean magnesium intake was<107.73 mg/1,000 kcal in the lowest
quar-tile and177.70 mg/1,000 kcal in the highest quartile. No difference was observed in BMI among the quartiles, whereas age in the higher quartiles was significantly higher than that of the lowest quartiles (p<0.0001). Participants with higher magnesium intake had a significantly
lower current smoking rate (p<0.0001) and drinking rate (p = 0.0006), whereas education level
and household income in the highest quartile were significantly higher than those in the lowest quartile (p<0.0001). The total energy intake was significantly lower in the higher quartiles of
(g/1000 kcal), calcium (mg/1000 kcal), sodium (mg/1000 kcal), and potassium (mg/1000 kcal) were higher in the higher quartiles (p<0.0001). Total fat intake (%energy) was not significantly
different among the quartiles.
Table 1. Characteristics of participants according to magnesium intake.
Variables Magnesium intake P value
Quartile 1 Quartile 2 Quartile 3 Quartile 4
Magnesium intake (range, mg/1000kcal) <107.7 107.7–138.8 138.8–177.7 177.7
No. of subjects 2885 2906 2888 3006
Male (%) 54.4 50.8 51.2 44.7 <.0001
Agea(years) 40.4±0.4 41.5±0.4 42.3±0.3 44.2±0.3 <.0001
BMI (kg/m2) 23.5±0.1 23.3±0.1 23.4±0.1 23.5±0.1 0.1560
Education (%)
Elementary 16.9±0.9 14.8±0.8 13.2±0.7 15.3±0.8 <.0001
Middle/High 55.2±1.2 51.2±1.2 52.1±1.2 52.6±1.2
College 27.9±1.1 34.0±1.2 34.7±1.3 32.1±1.3
Household income (%)
Quartile 1 (Low) 17.7±1.1 12.3±0.8 10.7±0.7 12.3±0.8 <.0001
Quartile 2 27.4±1.3 25.5±1.1 23.5±1.1 23.3±1.2
Quartile 3 28.5±1.2 30.5±1.3 32.3±1.1 29.8±1.2
Quartile 4 (High) 26.4±1.3 31.8±1.3 33.5±1.3 34.6±1.6
Physical activityb(%)
Low 50.6±1.2 47.9±1.2 50.1±1.2 45.7±1.2 0.0429
Moderate 45.8±1.2 48.3±1.2 45.6±1.2 50.3±1.1
High 3.6±0.5 3.8±0.4 4.4±0.5 4.1±0.5
Smoker (%)
Never 46.9±1.1 52.6±1.2 53.3±1.1 57.5±1.1 <.0001
Past 19.6±1.0 18.3±0.8 20.3±0.9 19.1±0.9
Current 33.5±1.1 29.1±1.2 26.3±1.0 23.4±1.0
Frequency of alcohol (%)
None 20.9±0.8 19.4±0.9 22.5±1.0 23.9±1.0 0.0006
<1 time/month 27.4±1.1 29.7±1.0 30.0±1.0 30.6±1.0
2~4 times/month 25.6±1.1 27.1±1.0 25.4±1.1 24.1±1.0
2 times/week 26.1±1.1 23.8±1.0 22.1±0.9 21.4±1.0
Daily dietary intakes
Total energy (kcal) 2022.2±20.5 1971.4±18.4 1889.5±18.1 1742.6±15.8 <.0001
Carbohydrate (%Energy) 65.7±0.4 67.4±0.3 67.8±0.3 67.9±0.3 <.0001
Fat (%Energy) 16.4±0.2 16.4±0.2 16.7±0.2 16.7±0.2 0.4612
Protein (%Energy) 11.9±0.1 13.6±0.1 14.6±0.1 16.6±0.1 <.0001
Fiber (g/1000kcal) 2.9±0.0 3.7±0.0 4.3±0.1 5.4±0.1 <.0001
Calcium (mg/1000kcal) 179.6±2.5 230.6±2.8 280.0±3.1 362.5±3.6 <.0001
Sodium (mg/1000kcal) 1989.0±21.2 2425.3±24.4 2758.3±23.9 3417.4±38.3 <.0001
Potassium (mg/1000kcal) 1176.9±10.0 1470.5±8.6 1698.5±9.7 2061.7±15.7 <.0001
Data represent age-adjusted mean or prevalence (%)±SE, except for age. a Non-adjusted values.
b Defined as low (<600 MET-minutes per week), moderate (600 to<3000 MET-minutes per week), and high (3000 MET-minutes per week) levels of physical activity.
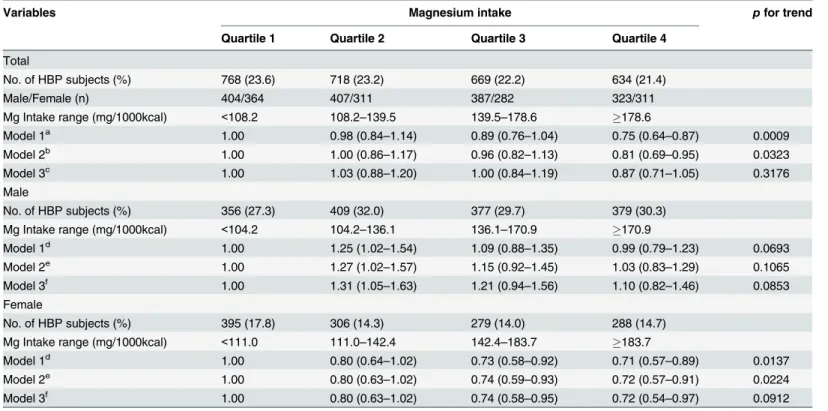
The relationships between magnesium intake and the risk of high blood pressure by gender are shown inTable 2. Among all of the participants, dietary magnesium was inversely associ-ated with the risk of high blood pressure (Model 1: 4th vs. 1st quartile, OR = 0.75, 95% CI = 0.64~0.87, P for trend = 0.0009), but there was no significant relation between dietary magnesium intake and high blood pressure risk after adjusting for potential confounders (Model 3). The intake of magnesium did not have a significant difference on OR for the risk of high blood pressure in both men and women. Considering the close correlation of obesity and high blood pressure, the OR of high blood pressure according to magnesium intake by obesity level was analyzed (Table 3). In the case of normal weight, magnesium intake amount did not have a significant difference on OR for the prevalence of high blood pressure in both men and women. However, in the case of obese women, subjects who ingested more magnesium had a
Table 2. Multivariate odds ratio for high blood pressure according to magnesium intake.
Variables Magnesium intake pfor trend
Quartile 1 Quartile 2 Quartile 3 Quartile 4
Total
No. of HBP subjects (%) 768 (23.6) 718 (23.2) 669 (22.2) 634 (21.4)
Male/Female (n) 404/364 407/311 387/282 323/311
Mg Intake range (mg/1000kcal) <108.2 108.2–139.5 139.5–178.6 178.6
Model 1a 1.00 0.98 (0.84
–1.14) 0.89 (0.76–1.04) 0.75 (0.64–0.87) 0.0009
Model 2b 1.00 1.00 (0.86
–1.17) 0.96 (0.82–1.13) 0.81 (0.69–0.95) 0.0323
Model 3c 1.00 1.03 (0.88
–1.20) 1.00 (0.84–1.19) 0.87 (0.71–1.05) 0.3176
Male
No. of HBP subjects (%) 356 (27.3) 409 (32.0) 377 (29.7) 379 (30.3)
Mg Intake range (mg/1000kcal) <104.2 104.2–136.1 136.1–170.9 170.9
Model 1d 1.00 1.25 (1.02
–1.54) 1.09 (0.88–1.35) 0.99 (0.79–1.23) 0.0693
Model 2e 1.00 1.27 (1.02–1.57) 1.15 (0.92–1.45) 1.03 (0.83–1.29) 0.1065
Model 3f 1.00 1.31 (1.05
–1.63) 1.21 (0.94–1.56) 1.10 (0.82–1.46) 0.0853
Female
No. of HBP subjects (%) 395 (17.8) 306 (14.3) 279 (14.0) 288 (14.7)
Mg Intake range (mg/1000kcal) <111.0 111.0–142.4 142.4–183.7 183.7
Model 1d 1.00 0.80 (0.64
–1.02) 0.73 (0.58–0.92) 0.71 (0.57–0.89) 0.0137
Model 2e 1.00 0.80 (0.63
–1.02) 0.74 (0.59–0.93) 0.72 (0.57–0.91) 0.0224
Model 3f 1.00 0.80 (0.63
–1.02) 0.74 (0.58–0.95) 0.72 (0.54–0.97) 0.0912
HBP: High Blood Pressure
a Model 1: Adjusted for age, sex, BMI (continuous).
b Model 2: Adjusted for education (elementary school or less, middle or high school, college or more), income (quartiles of household income), physical activity (MET), smoking status (never smoker, past smoker, current smoker), and frequency of alcohol (none,<1 time/month, 2~4 times/month,2 times/ week) in addition to model 1.
c Model 3: Adjusted for total energy (kcal/day), carbohydrate (%energy), proteins (%energy), fat (%energy),fiber (g/1000 kcal), calcium (mg/1000 kcal), sodium (mg/1000 kcal), and potassium (mg/1000 kcal) intakes as continuous variables in addition to model 2.
d Model 1: Adjusted for age and BMI (continuous).
e Model 2: Adjusted for education (elementary school or less, middle or high school, college or more), income (quartiles of household income), physical activity (MET), smoking status (never smoker, past smoker, current smoker), and frequency of alcohol (none,<1 time/month, 2~4 times/month,2 times/ week) in addition to model 1.
f Model 3: Adjusted for total energy (kcal/day), carbohydrate (%energy), proteins (%energy), fat (%energy),fiber (g/1000 kcal), calcium (mg/1000 kcal), sodium (mg/1000 kcal), and potassium (mg/1000 kcal) intakes as continuous variables in addition to model 2.
Table 3. Multivariate odds ratio for high blood pressure according to magnesium intake by obesity and menopause.
Variables Magnesium intake pfor trend
Quartile 1 Quartile 2 Quartile 3 Quartile 4
Male
Obesity (25kg/m2)
No. of HBP subjects (%) 131 (36.4) 184 (45.0) 176 (41.6) 148 (40.0)
-Mg Intake range (mg/1000kcal) <102.6 102.6–137.0 137.0–174.0 174.0
-Model 1a 1.00 1.43 (1.01
–2.01) 1.22 (0.85–1.73) 1.05 (0.72–1.52) 0.1344
Model 2b 1.00 1.36 (0.95
–1.93) 1.29 (0.89–1.88) 1.06 (0.72–1.56) 0.2361
Model 3c 1.00 1.42 (0.98
–2.06) 1.40 (0.92–2.14) 1.20 (0.72–1.99) 0.2101
Normal weight (<25kg/m2)
No. of HBP subjects (%) 228 (23.0) 222 (25.3) 211 (24.0) 221 (24.3)
-Mg Intake range (mg/1000kcal) <105.4 105.4–135.5 135.6–170.6 170.6
-Model 1a 1.00 1.09 (0.84
–1.41) 1.01 (0.77–1.32) 0.91 (0.68–1.21) 0.6099
Model 2b 1.00 1.14 (0.87–1.50) 1.06 (0.79–1.41) 0.96 (0.71–1.29) 0.6037
Model 3c 1.00 1.14 (0.86
–1.51) 1.06 (0.78–1.45) 0.93 (0.64–1.35) 0.5467
Female
Obesity (25kg/m2)
No. of HBP subjects (%) 150 (31.2) 127 (26.4) 108 (24.5) 82 (17.8)
-Mg Intake range (mg/1000kcal) <112.2 112.2–146.4 146.4–191.8 191.8
-Model 1a 1.00 0.79 (0.56
–1.13) 0.69 (0.47–1.00) 0.45 (0.32–0.64) <.0001
Model 2b 1.00 0.81 (0.56
–1.16) 0.70 (0.48–1.03) 0.46 (0.33–0.66) 0.0002
Model 3c 1.00 0.76 (0.53–1.10) 0.64 (0.41–0.99) 0.40 (0.25–0.63) 0.0014
Normal weight (<25kg/m2)
No. of HBP subjects (%) 247 (13.7) 187 (11.3) 163 (10.4) 199 (13.8)
-Mg Intake range (mg/1000kcal) <110.6 110.6–141.6 141.6–181.9 181.9
-Model 1a 1.00 0.87 (0.65–1.16) 0.83 (0.55–0.98) 0.94 (0.70–1.25) 0.1607
Model 2b 1.00 0.85 (0.63
–1.14) 0.72 (0.54–0.98) 0.93 (0.69–1.25) 0.1533
Model 3c 1.00 0.88 (0.66
–1.19) 0.77 (0.56–1.06) 1.02 (0.71–1.47) 0.1980
Menopause Premenopause
No. of HBP subjects (%) 102 (9.5) 92 (8.0) 94 (7.9) 105 (8.9)
-Mg Intake range (mg/1000kcal) <110.6 110.6–140.6 140.6–181.1 181.2
-Model 1a 1.00 0.73 (0.51
–1.03) 0.68 (0.49–0.95) 0.69 (0.49–0.97) 0.0867
Model 2b 1.00 0.70 (0.49–1.01) 0.70 (0.50–0.97) 0.69 (0.49–0.98) 0.1082
Model 3c 1.00 0.70 (0.48
–1.00) 0.70 (0.48–1.00) 0.67 (0.43–1.04) 0.1489
Postmenopause
No. of HBP subjects (%) 304 (37.5) 232 (32.0) 195 (29.9) 144 (25.9)
-Mg Intake range (mg/1000kcal) <113.2 113.2–148.7 148.7–195.1 195.1
-Model 1a 1.00 0.87 (0.65
–1.16) 0.80 (0.60–1.08) 0.66 (0.49–0.88) 0.0367
Model 2b 1.00 0.90 (0.67
–1.20) 0.83 (0.61–1.11) 0.66 (0.49–0.88) 0.0405
Model 3c 1.00 0.92 (0.68
–1.24) 0.85 (0.60–1.20) 0.70 (0.47–1.05) 0.3811
HBP: High Blood Pressure
a Model 1: Adjusted for age and BMI (continuous).
b Model 2: Adjusted for education (elementary school or less, middle or high school, college or more), income (quartiles of household income), physical activity (MET), smoking status (never smoker, past smoker, current smoker), and frequency of alcohol (none,<1 time/month, 2~4 times/month,2 times/ week) in addition to model 1.
c Model 3: Adjusted for total energy (kcal/day), carbohydrate (%energy), protein (%pro), fat (%energy),fiber (g/1000 kcal), calcium (mg/1000 kcal), sodium (mg/1000 kcal), and potassium (mg/1000 kcal) intakes as continuous variables in addition to model 2.
lower OR for the risk of high blood pressure after adjusting for various factors (Model 3: 4th vs. 1st quartile, aOR = 0.40, 95% CI = 0.25~0.63, P for trend = 0.0014).
Discussion
Based on the KNHANES analysis, the relationship between magnesium intake and high blood pressure risk was investigated in this study. There was no significant relation between dietary magnesium intake and high blood pressure risk after adjusting for potential confounders. However, when the obesity group and the normal-weight group were separated in the analysis, the obese female group, in particular, showed a significant negative correlation between mag-nesium intake and high blood pressure risk.
Many studies report that a high magnesium intake ranging from 500 to 1000 mg/day may reduce blood pressure [9,10,17]. It is known that magnesium lowers blood pressure by func-tioning as a calcium channel blocker. In other words, magnesium competes with the sodium binding site of smooth muscle cells, increases prostaglandin E, interacts with potassium, induces vasodilation, reduces intra-cell calcium and sodium contents and decreases blood pres-sure [18,19]. The negative relationship between magnesium intake and blood pressure is reported in epidemiological studies and observational studies. Song et al. [20] examined 28,349 middle-aged women in a follow-up observational study over a 10-year period and reported that the highest quartile of magnesium intake (434 mg/day) showed significantly lower hypertension risk than the lowest quartile (356 mg/day), which indicated that magne-sium intake had a significant negative correlation with hypertension prevalence. In this study, women’s magnesium intake was inversely related to the risk of high blood pressure. However, after adjusting for several confounding factors, the result was attenuated. Especially when potassium intake, one of the confounding factors, was adjusted, the inverse relationship of magnesium intake and the risk of high blood pressure did not appear. Green leafy vegetables richly contain magnesium and trace amounts of potassium. This seems to affect potassium intake, which in turn affects the relationship between magnesium intake and the risk of high blood pressure.
Ascherio et al. [21] reported that in women with hypertension, magnesium intake showed no significant correlation with hypertension risk. However, in women with normal-range blood pressure, the authors found a significant negative correlation between magnesium intake and blood pressure after adjusting for age, BMI, alcohol and energy intakes. The present study, based on the standard criteria for a hypertension diagnosis of 140/90 mmHg or over, found no significant relationship between magnesium intake and hypertension prevalence (data not shown). However, based on the criteria of 130/85 mmHg or over, which is used for metabolic syndrome diagnosis [15], magnesium intake showed a significant negative relationship with high blood pressure risk. The study findings are meaningful in signaling that, just as in previous studies, magnesium intake through daily meals plays an important role in high blood pressure prevention.
Nevertheless, Houston and Harper [25] emphasized magnesium intake for hypertension prevention or health improvement in the community. Klevay and Milne [26] reported that the current recommended magnesium level of 320 mg/day is appropriate for healthy cardiovascu-lar functioning. In Western countries, magnesium intake has decreased continuously from 500 mg/day in the 1900s to the current 175 mg/day [27]. Accordingly, the number of people with magnesium deficiency has also increased. Magnesium is a component of chlorophyll and is contained in many green leafy vegetables. Consequently, magnesium intake seems to be suffi-cient in the Korean diet style, which is centered on plant foods [13,28]. In Korea, the recom-mended magnesium intake for men aged between ages 19 and 20 is 340 mg; men aged 30 and over, 350 mg; and women aged 10 and over, 280 mg [29]. In the present study, the magnesium intake showing a negative relationship with high blood pressure risk in women was 183.7 mg/ 1000kcal/day in the highest quartile. In this study, daily total magnesium amount exceeds the recommended magnesium intake level. Other studies assessing daily magnesium intake found that 60 post-menopausal women had a daily intake of 345.9 mg [30], exceeding the recom-mended level whereas 30 women living in rural locations had 259.1 mg [31]; 139 adult women, 259.1 mg [13]; and 294 adult women, 85% of the recommended level, failing to meet the estab-lished reference criteria [32]. Therefore, to prevent or lower the risk of hypertension, it is deemed necessary to increase magnesium intake through daily meals. In the present study, magnesium intake was analyzed by considering energy intake (mg/1000 kcal). Accordingly, increasing magnesium density in the diet seems particularly effective in reducing high blood pressure risk.
In this study, the negative relationship between magnesium intake and high blood pressure risk was found in obese women only. To date, no research has been performed that explains such a mechanism, and each study has found only inconsistent outcomes. Nevertheless, Zhang et al. [33] reported in the JACC study examining 58,615 Japanese that an association of magne-sium intake with mortality rate due to congestive heart failure appeared only in women. To investigate whether the present study’s findings were possibly due to hormonal functions, we separated pre-menopausal women from post-menopausal women to analyze the relationship between magnesium intake and high blood pressure risk. Consequently, in the post-meno-pausal group, after adjusting for age, BMI, educational level, physical activities, smoking and drinking status, the aOR for high blood pressure risk of the highest magnesium intake quartile was significantly lower than that of the lowest quartile. However, after adjusting for energy, carbohydrate, protein, fat, fiber, calcium, sodium and potassium intakes related to blood pres-sure, magnesium intake showed no significant relationship with high blood pressure risk. Such a result indicates that the negative relationship in women between magnesium intake and high blood pressure risk was not primarily due to female hormones. Further research to elucidate this issue is required.
In addition, the relationship between magnesium intake and the risk of high blood pressure differs between sexes. Similarly, sodium sensitivity, one of the main dietary factors that affect high blood pressure, also differs between men and women [34–36]. In particular, the absolute amount of sodium intake is lower in women than in men, and sodium sensitivity is higher in women than in men [35]. Therefore, as complementary measures, the relationship between magnesium intake and risk of high blood pressure was analyzed separately between men and women, and the amount of sodium intake was set as the confounding factor for analysis. How-ever, we cannot precisely explain the difference in the relationship between magnesium intake and the risk of high blood pressure between men and women.
magnesium intake quartile was significantly lower than that of the lowest quartile (aOR = 0.69, 95% CI = 0.52~0.91, P for trend<0.01). In addition, the authors showed that the individual
metabolic syndrome diagonal indexes centering on insulin resistance had a significant negative relationship with magnesium intake. Liu et al. [39] examined 37,183 women in a randomized, double-blind, placebo-controlled trial and found that dairy product intake had a relationship with diabetes risk reduction. Their interpretation of the result was that because dairy products had high contents of magnesium, calcium, lactose and milk protein, they increased the feeling of fullness more than other food or beverages containing more sugar and therefore reduced the risk of overweight and obesity. Obesity is one of the diagonal indexes for metabolic syndrome and an independent and crucial risk factor of various diseases. Therefore, the present study analyzed the relationship between magnesium intake and high blood pressure risk according to the obesity levels of male and female participants. Consequently, in obese women, after adjust-ing for obesity-related factors, the high blood pressure risk of the highest magnesium intake quartile was significantly lower compared to that of the lowest quartile (aOR = 0.40, 95% CI = 0.25~0.63, P for trend = 0.0014). Such a result indicates that in obese women, sufficient magnesium intake could be effective in preventing or controlling high blood pressure.
The present study has some limitations in generalizing its findings. First, it did not perform the follow-up observation for high blood pressure risk according to magnesium intake levels and only analyzed these data using a cross-sectional design. Thus, the study findings may have a lower reliability than that of a prospective design despite the adjustment for interference fac-tors. Second, as mentioned above, the hypertension diagnosis criterion in the present study was lowered from 140/90 mmHg or over to 130/85 mmHg or over for the purpose of protec-tion. Therefore, any direct comparison with previous studies would be difficult. Third, follow-ing the present KNHANES in which the 24-hour dietary recall method was utilized to investigate the dietary intake levels, this study also used the method to analyze magnesium intake. Thus, it is possible that this research does not reflect the long-term magnesium intake status. However, because magnesium is a microelement, to reduce the risk of underestimating or overestimating its intake level in the food frequency questionnaire investigation, we used a magnesium content database among the diverse food data to accurately assess the intake levels. Ultimately, the present study has a strength in that it is the first study in Korea to identify the relationship between magnesium intake and high blood pressure risk in a large cohort of Kore-ans living in a mixed dietary environment, i.e., a traditional diet focused on plant foods with high magnesium content together with a Westernized diet.
In conclusion, this study found a negative relationship between magnesium intake and high blood pressure in obese women. These findings suggest that sufficient magnesium intake may reduce high blood pressure risk in obese women.
Acknowledgments
We thank all of the physicians and participants of the study for their co-operation and gener-ous participation.
Author Contributions
References
1. World Health Organization. 2013 [cited 19 November 2013] Cardiovascular diseases-Fact sheet N° 317. Available:http://www.who.int/mediacentre/factsheets/fs317/en/.
2. Damasceno A, Azevedo A, Silva-Matos C, Prista A, Diogo D, Lunet N (2009) Hypertension prevalence, awareness, treatment, and control in mozambique: Urban/rural gap during epidemiological transition. Hypertension 54:77–83. doi:10.1161/HYPERTENSIONAHA.109.132423PMID:19470872 3. National Statistical Office. Death and death rate by causes. Seoul: National Statistical Office; 2013.
4. The Ministry of Health and Welfare, Korean Center for Disease Control and Prevention. National health statistics. Seoul: Korea Center for Disease Control and Prevention; 2013
5. Zhao D, Qi Y, Zheng Z, Wang Y, Zhang XY, et al. (2011) Dietary factors associated with hypertension. Nat Rev Cardiol 8:456–465. doi:10.1038/nrcardio.2011.75PMID:21727918
6. Steffen LM, Kroenke CH, Yu X, Pereira MA, Slattery ML, Li HJ, et al. (2005) Associations of plant food, dairy product, and meat intakes with 15-y incidence of elevated blood pressure in young black and white adults: the Coronary Artery Risk Development in Young Adults (CARDIA) Study. Am J Clin Nutr 82:1169–1177. PMID:16332648
7. Yamori Y, Taguchi T, Mori H, Mori M (2010) Low cardiovascular risks in the middle aged males and females excreting greater 24-hour urinary taurine and magnesium in 41 WHO-CARDIAC study popula-tions in the world. J Biomed Sci 17:S21. doi:10.1186/1423-0127-17-S1-S21PMID:20804596
8. Hruby A, O'Donnell CJ, Jacques PF, Meigs JB, Hoffmann U, McKeown NM (2014) Magnesium intake is inversely associated with coronary artery calcification: the Framingham Heart Study. JACC Cardio-vasc Imaging 7:59–69. doi:10.1016/j.jcmg.2013.10.006PMID:24290571
9. Jee SH, Miller ER 3rd, Guallar E, Singh VK, Appel LJ, Klag MJ (2002) The effect of magnesium supple-mentation on blood pressure: a meta-analysis of randomized clinical trials. Am J Hypertens 15:691–
696. doi:10.1016/S0895-7061(02)02964-3PMID:12160191
10. Touyz RM (2003) Role of magnesium in the pathogenesis of hypertension. Mol Aspects Med 24:107–
136. doi:10.1016/S0098-2997(02)00094-8PMID:12537992
11. Choi MK, Bae YJ (2013) Relationship between dietary magnesium, manganese, and copper and meta-bolic syndrome risk in Korean adults: the Korea National Health and Nutrition Examination Survey (2007–2008). Biol Trace Elem Res 156:56–66. doi:10.1007/s12011-013-9852-zPMID:24218228 12. The Ministry of Health and Welfare, Korean Center for Disease Control and Prevention. National health
statistics. Seoul: Korea Center for Disease Control and Prevention; 2009
13. Bae YJ, Kim MH, Choi MK (2010) Analysis of magnesium contents in commonly consumed foods and evaluation of its daily intake in Korean independent-living subjects. Biol Trace Elem Res 135:182–199.
doi:10.1007/s12011-009-8511-xPMID:19756403
14. Institute National Rural Resources Development, Administration RD. Food composition tables. 7th ed. Seoul: Hyoil; 2006
15. Grundy SM, Cleeman JI, Daniels SR, Donato KA, Eckel RH, Franklin BA, et al. (2005) Diagnosis and management of the metabolic syndrome: an American Heart Association/National Heart, Lung, and Blood Institute Scientific Statement. Circulation 112:2735–2752. doi:10.1161/CIRCULATIONAHA.
105.169404PMID:16157765
16. Kang YS (2013) Obesity associated hypertension: new insights into mechanism. Electrolyte Blood Press 11:46–52. doi:10.5049/EBP.2013.11.2.46PMID:24627704
17. Resnick LM (1997) Magnesium in the pathophysiology and treatment of hypertension and diabetes mellitus. Where are we in 1997? Am J Hypertens 10:368–370. doi:10.1016/S0895-7061(97)00021-6
PMID:905669
18. Touyz RM (2006) Magnesium and hypertension. Curr Opin Nephrology Hypertens 15:141–144. doi:
10.1097/01.mnh.0000214773.34480.d4PMID:16481880
19. Sonita B, Touyz RM (2007) Magnesium transport in hypertension. Pathophysiology 14:205–211. doi:
http://dx.doi.org/10.1016/j.pathophys.2007.09.005PMID:18029156
20. Song Y, Sesso HD, Manson JE, Cook NR, Buring JE, Liu S (2006) Dietary magnesium intake and risk of incident hypertension among middle-aged and older US women in a 10-year follow-up study. Am J Cardiol 98:1616–1621. doi:http://dx.doi.org/10.1016/j.amjcard.2006.07.040PMID:17145221 21. Ascherio A, Hennekens C, Willett WC, Sacks F, Rosner B, Manson J, et al. (1996) Prospective study of
nutritional factors, blood pressure, and hypertension among US women. Hypertension 27:1065–1072.
doi:10.1161/01.HYP.27.5.1065PMID:8621198
23. Cappuccio FP, Markandu ND, Beynon GW, Shore AD, Sampson B, MacGregor GA (1985) Lack of effect of oral magnesium on high blood pressure: a double blind study. Br Med J 291:235–238. PMID:
3926135
24. Mancia G, De Backer G, Dominiczak A, Cifkova R, Fagard R, Germano G, et al. (2007) 2007 ESH-ESC practice guidelines for the management of arterial hypertension: ESH-ESH-ESC task force on the man-agement of arterial hypertension. J Hypertens 25:1751–1762. doi:10.1097/HJH.0b013e3282f0580f
PMID:17762635
25. Houston MC, Harper KJ (2008) Potassium, magnesium, and calcium: their role in both the cause and treatment of hypertension. J Clin Hypertens (Greenwich) 10:3–11. doi:10.1111/j.1751-7176.2008.
08575.xPMID:18607145
26. Klevay LM, Milne DB (2002) Low dietary magnesium increases supraventricular ectopy. Am J Clin Nutr 75:550–554. PMID:11864862
27. Altura BM (1994) Importance of Mg in physiology and medicine and the need for ion selective elec-trodes. Scand J Clin Lab Invest 54:5–9. PMID:7939385
28. McNeill DA, Ali PS, Song YS (1985) Mineral analyses of vegetarian, health, and conventional foods: magnesium, zinc, copper, and manganese content. J Am Diet Assoc 85:569–557. PMID:3989172 29. The Korean Nutrition Society. Dietary reference intake for Koreans. Seoul: The Korean Nutrition
Soci-ety; 2010
30. Sung CJ, Choi YH, Kim MH, Choi SH, Cho KO (2002) A study of nutrient intake and serum levels of osteocalcin, Ca, P, and Mg and their correlation to bone mineral density in Korean postmenopausal women residing in rural area. Korean J Community Nutr 7:111–1200
31. Sung CJ (1990) A study of Mg status in adult Korean rural women on self-selected diet. Korean J Nutr 23:25–36.
32. Bae YJ, Choi MK (2011) Magnesium intake and its relevance with antioxidant capacity in Korean adults. Biol Trace Elem Res 143:213–225. doi:10.1007/s12011-010-8883-yPMID:20978866 33. Zhang W, Iso H, Ohiraa T, Dateb C, Tamakoshic A, JACC Study Group (2012) Associations of dietary
magnesium intake with mortality from cardiovascular disease: The JACC study. Atherosclerosis 221:587–595. doi:10.1016/j.atherosclerosis.2012.01.034PMID:22341866
34. He J, Gu D, Chen J, Jaquish CE, Rao DC, Hixson JE, et al. (2009) Gender difference in blood pressure responses to dietary sodium intervention in the GenSalt study. J Hypertens 27:48–54. PMID:
19145767
35. Bursztyn M, Ben-Dov IZ (2013) Sex differences in salt-sensitivity risk approximated from ambulatory blood pressure monitoring and mortality. J Hypertens 31:900–905. doi:10.1097/HJH.
0b013e32835f29f4PMID:23449016
36. Miura K, Okuda N, Turin TC, Takashima N, Nakagawa H, Nakamura K, et al. (2010) Dietary salt intake and blood pressure in a representative Japanese population: baseline analyses of NIPPON DATA80. J Epidemiol 20:S524–530. doi:10.2188/jea.JE20090220PMID:20351473
37. Ford ES, Li C, McGuire LC, Mokdad AH, Liu S (2007) Intake of dietary magnesium and the prevalence of the metabolic syndrome among U.S. adults. Obesity (Silver Spring) 15:1139–1146. doi:10.1038/
oby.2007.628PMID:17495189
38. He K, Liu K, Davilgus ML, Morris SJ, Loria CM, Van Horn L, et al. (2006) Magnesium intake and inci-dence of metabolic syndrome among young adults. Circulation 113:1675–1682. doi:10.1161/
CIRCULATIONAHA.105.588327PMID:16567569
39. Liu S, Choi HK, Ford E, Song Y, Klevak A, Buring JE, et al. (2006) A prospective study of dairy intake and the risk of type 2 diabetes in women. Diabetes Care 29:1579–1584. doi:10.2337/dc06-0256