www.ccarevista.ufc.br ISSN 1806-6690
Prediction of oil content in the mesocarp of fruit from the macauba
palm using spectrometry
1Predição do teor de óleo do mesocarpo nos frutos de macaúba usando espectrometria
Sofrimento Fenias Savanto Matsimbe2*, Sergio Yoshimitsui Motoike3, Francisco Assis de Carvalho Pinto4, Helio
Garcia Leite5 e Gustavo Eduardo Marcatti6
ABSTRACT - In the present work a model was developed for the prediction of the oil content of the mesocarp of fruit from the macauba palm, using visible and near infrared spectrometry. Reference values were determined the by Soxhlet method. The model was calibrated using spectral data from the mesocarp of macauba fruit by partial least squares regression, considering nine latent variables. The results of the calibration series were consistent with those of the validation series, registering an The coefficient of determination between the reference method and the developed model, systematic error between the predicted values and the measured values and root mean square error, for calibration and validation with independent data, respectively, equal to 0.8223, -9.2-14 and 5.917 and 0.7760, 7.081 and -0.064. VIS-NIR spectroscopy is a viable tool in the evaluation of genotypes in breeding programs for the macauba palm.
Key words:Acrocomia aculeata. Quantification of the oil. VIS-NIR model calibration.
RESUMO -No presente trabalho, foi desenvolvido um modelo para a predição do teor de óleo do mesocarpo nos frutos
de macaúba, usando a espectrometria do visível e infravermelho próximo. Os valores de referência foram determinados pelo método soxhlet. O modelo foi calibrado usando dados espectrais do mesocarpo dos frutos de macaúba pela regressão por mínimos quadrados parciais, considerando nove variáveis latentes. Os resultados da série da calibração foram consistentes com os da série da validação, registrando o coeficiente de determinação entre o método referencia e o modelo desenvolvido, erro sistemático entre os valores preditos e os valores mensurados e a raiz quadrada do erro médio quadrático entre o método referência e o modelo desenvolvido, de 0,8223, -9,2-14 e 5,917 e de 0,7760, -0,064 e 7,081, para a calibração e validação respectivamente. A espectrometria VIS-NIR é viável como ferramenta de avaliação de genótipos em programas do melhoramento de macaúba.
Palavras-chave:Acrocomia aculeata. Quantificação do óleo. Calibração de modeloVIS-NIR.
*Autor para correspondência
1Recebido para publicação em 24/09/2012; aprovado em 23/09/2014
Parte da Dissertação de Mestrado do primeiro autor apresentada...
2Departamento de Agronomia, Instituto de Investigação Agrária de Moçambique, Maputo, Moçambique, [email protected] 3Departamento de Fitotecnia, Universidade Federal de Viçosa, Viçosa, MG, Brasil, [email protected]
4Departamento de Engenharia Agrícola, Universidade Federal de Viçosa, Viçosa, MG, Brasil, [email protected] 5Departamento de Engenharia Florestal, Universidade Federal de Viçosa, Viçosa, MG, Brasil, [email protected]
6Programa de Pós-Graduação em Ciência Florestal, Departamento de Engenharia Florestal, Universidade Federal de Viçosa, Viçosa, MG,
INTRODUCTION
The macaúba [Acrocomia aculeata (Jacq.) Lodd.
Ex Mart.] is a rustic oilseed which, due to the high oil content of its fruit, has high productivity and great potential. Oil from the mesocarp, which is rich in oleic acid (COCININI, 2012; COIMBRA; JORGE, 2011), is of great demand in the food industry, and especially the energy industries because of its suitability for biodiesel production. Oil extracted from the endosperm is rich in lauric acid (BORA; ROCHA, 2004; COIMBRA; JORGE, 2011), and is therefore a valuable raw material in the cosmetic industry. Another application of economic importance is the use of its endocarp carbon in metallurgical and steelmaking operations.
Recently, studies aimed at the genetic improvement of the species have been set up at major research centres in Brazil. To assess the productive potential of different genotypes, qualitative and quantitative chemical analyses of the fruit of the macauba palm are required. However one of the difficulties faced by researchers is being able to access this information in the fruit due to the laborious and expensive processes of conventional methods of
evaluation (QUAMPAH et al., 2012). For example,
the evaluation of a single sample to determine the oil content using the standard method, Soxhlet, requires approximately 50 hours between prior preparation of the sample and the extraction itself, without taking into consideration that the solvent (n-hexane) used for extraction of the oil is toxic and polluting.
Accordingly, visible and near infrared (VIS-NIR) spectrometry is a tool for fast and efficient evaluation, which can be applied both to plant breeding and in industry. In several studies, the use of VIS-NIR spectrometry has been proposed in the development of models for the prediction of the oil content of various oilseeds: sunflower
(PÉREZ-VICHet al., 1998), rapeseed (VELASCOet al.,
1999a), Brassicaceae (VELASCOet al., 1999b), safflower
(ELFADLet al., 2010; RUDOLPHIet al., 2012), Jatropha
(VAKNINet al., 2011) and cotton (QUAMPAHet al., 2012).
However, to date there are no reports of its application on specific fruit fractions, such as palm mesocarp. The above studies have reported numerous benefits from spectrometric techniques, namely: speed, high precision, practicality and cost-effectiveness. Also the techniques allow for the assessment of more than one parameter in a single analysis, are non-destructive and do not require the use of chemical reagents or prior preparation of the samples (BAYE;
BECKER, 2004; ROSSELet al., 2005).
The aim of this work was to develop a model for predicting the oil content of the mesocarp of macauba fruit using VIS-NIR spectrometry.
MATERIAL AND METHODS
Samples
In the study, 840 fruits of the macauba were used, taken from various palm trees in natural populations in the towns of Acaiaca (20º23’33” S and 43º07’31” W, at an altitude of 601 m) and Piranga (20º41’46” S and 43º15’28” W, at an altitude of 606 m) in the state of Minas Gerais, Brazil. In each region, bunches were tagged at anthesis to monitor the development and maturation of the fruit. Ten bunches (one bunch per plant) were tagged in each population, giving a total of 20 bunches. Harvesting of the fruit started 314 days after anthesis, and was repeated at intervals ranging from 15 to 30 days, up to 495 days after anthesis. In total, nine harvests were carried out, with each harvest representing a maturation stage of the fruit. For each bunch six fruits were harvested, two for each position in the bunch: basal, median and apical. One sample unit consisted of two fruits per position per crop, totalling 420 samples. After harvesting, the samples were stored in a freezer at -20 °C until measurement of the spectral data.
Measurement of the spectral data and determination of the reference values
Spectral data were measured with the
FieldSpec®HandHeld 2™ spectroradiometer
(ANALYTICAL SPECTRAL DEVICES Inc, 2011), working in reflectance mode in the 325-1,075 nm wavelength band, at a sampling interval of 1.5 nm and accuracy of ± 0.1 nm. A white reference plate with approximately 100% reflectance across the spectrum (ANALYTICAL SPECTRAL DEVICES Inc, 2011) was used as the reference standard, and the integration time was optimised for 1.09 s by maximizing measurement of the spectral signal, in order to avoid saturation and minimize the occurrence of noisy spectra. Before each measurement, a portion of the epicarp was removed from each fruit in order to expose the mesocarp to the optical probe of the spectroradiometer. Measurement of reflectance was carried out by placing the fruit in a suitable container, so as to minimise the occurrence of noise related to the scattering of light. After measurement, the reflectance
spectra were processed using theViewSpec Pro™ software
to obtain the reflectance values used in adjustment of the VIS-NIR model, while the samples were again stored in the freezer at -20 °C until determination of the reference values for oil content using the Soxhlet method.
of sample per cartridge. Extraction of the oil and later determination of the reference values were carried out using the Soxhlet method, considered the standard method for quantification of oil in fatty products (AMERICAN OIL CHEMIST’ SOCIETY, 1994). This method consists of a semi-continuous extraction in which the material to be extracted, generally fats and waxes, is more soluble in a hot solvent than at room temperature or when cold. The procedure includes steps of boiling followed by washing in order to obtain a residual extract from the sample (ANDERSON, 2004).
Adjustment of the VIS-NIR model
The model was adjusted using the 400-999 nm spectral band, due to the presence of significant noise in the 325-399 nm and 1,000-1,075 nm bands. Before adjusting the model, the spectral data were pre-treated using the technique of multiplicative signal correction (MSC)
(BLANCO et al., 2001; JIANGet al., 2007; MOGHIMI
et al., 2010). MSC is a treatment based on the separation of
multiplicative and additive effects of light dispersion in NIR measurements, minimising spectral variations that are not the
result of analyte concentration (BLANCOet al., 2001).
The VIS-NIR model to predict the oil content in the mesocarp was adjusted by correlating the spectral data with the reference values, using partial least squares regression
(PLSR) (FEUDALEet al., 2002; LIet al., 2002; LIUet
al., 2009; MEVIKet al., 2004) employing the R software
(R DEVELOPMENT CORE TEAM, 2012). Two thirds of the samples were used for the calibration set and for cross validation, and the rest for the external validation set. To avoid overfitting the model, the optimal number of latent variables (LVs) was determined, considering the minimum value for the root mean square error of cross validation (RMSECV) (BALBIN; SMIRNOV, 2011; MEVIK; CEDERKVIST, 2004; YENIAY; GÖTKAS, 2002). Cross-validation was used only to define the optimal number of latent variables.
Statistical analysis
To evaluate the predictive capacity of the adjusted models, different statistical parameters were used:
a) The accuracy of correlation (bias) between the reference method and the developed model, which represents the systematic error between the predicted values and the measured values, where values close to zero
indicate high accuracy of the model (ELFADLet al., 2010).
This parameter is given by estimator 1.
(1)
where:y
j= value measured by the Soxhlet method for
the sample j, j= the value predicted by the VIS-NIR
model for the sample j andn= number of samples.
b) The root mean square error (RMSE) between the reference method and the developed model, represented by RMSEC for the calibration or estimation set and RMSEP for the prediction or external validation set. The RMSE is given by estimator 2.
(2)
c) The relative percentage error (ER) between the reference method and the developed model, given by estimator 3.
(3)
d) The coefficient of determination (R2) between
the reference method and the developed model, which
was estimated for all sets: calibration (R2
c),
cross-validation (R2
cv) and prediction or external validation
(R2
p), employing estimator 4.
(4)
where: = mean measured value and = mean predicted
value.
RESULTS AND DISCUSSION
Variability of the macauba samples
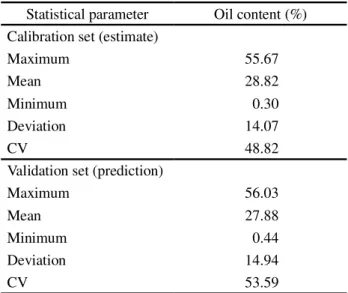
In Table 1 can be seen a summary of the analysis of variability in the samples used in adjusting the model. According to the results, the variation in oil content seen between the samples, from 0.30 to 55.67% for the calibration set and 0.44 to 56.03% for the validation set, suggests that the variability between samples was suitable for analysis.
Effect of pre-treatment of the spectral data
According to the results in Table 2, use of the original spectral data required 10 LVs to adjust the VIS-NIR model. While pre-treatment by MSC allowed adjustment of the VIS-NIR model using fewer VLs (nine), and with better predictive capability, as evidenced by the relatively low values for RMSEC (5.917) and RMSEP
(7.081) and the relatively high values for R2
c (0.8223)
and R2
p (0.7760). In spectrometry, physical effects
such as light and/or the state of the sample, affect the variability of the samples, contributing to the use of a large number of samples in the calibration set and resulting in complex models of low predictive capability
(BLANCOet al., 2001). The use of pre-treatments such
as MSC enables the correction of spectral variations that
are not induced by analyte concentration (BLANCOet
al., 2001; MOGHIMI et al., 2010) and consequently
improvements in the capability of the models.
Due to the results shown in Table 2, adjustment of the VIS-NIR model was performed using spectra pre-treated by MSC.
Table 2 - Summary of the effect of pre-treatment on the spectral data
Determining the number of latent variables to adjust the model
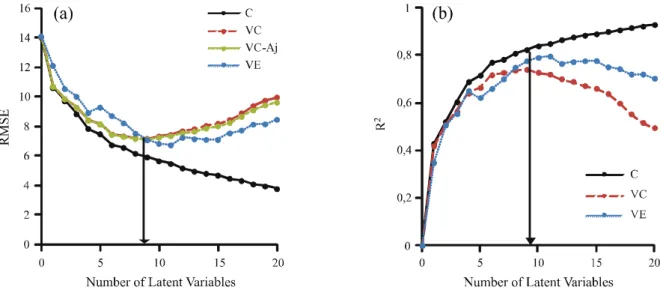
Figure 1 demonstrates that nine LVs were needed to adjust the best VIS-NIR model. The use of more than nine LVs leads to an over-adjusted model, characterised by a divergence in the trend of the RMSE, decreasing for calibration and decreasing for cross-validation
(Figure 1a), whereas R2 increased for the calibration
set and decreased for cross-validation (Figure 1b). This assumes that the use of many LVs, more than nine, increases the error and lowers the predictive
robustness of the VIS-NIR model. Quampah et al.
(2012), Liu et al. (2009), Sivakesava and Irudayaraj
(2002) and Swierenga et al. (1999) consider that
over-adjusted models can be avoided by selecting the optimal number of LVs using the minimum RMSECV,
with a relatively high R2.
Calibration and external validation
Table 3 summarises the statistics for the calibration set, which recorded values for the RMSEC of 5.917,
biasc of -9,2 and -15, and of 0.8223 for R2
c. These results
suggest the good predictive ability of the model. Quampah
et al. (2012), Moghimiet al. (2010) and Liuet al. (2009)
consider that the best model presents high values for R2
and low values for RMSEC and RMSEP.
Also in Table 3 are presented the statistical results of the external validation, which were consistent with the results
seen for the calibration set, recording values for R2
p of 0.7760
and RMSEP of 7.081. The value of biasp (-0.064) remained
close to zero, indicating that the accuracy seen for the calibration set was also maintained for the prediction set (external validation). Another relevant fact seen was the high consistency (83.56%) of the model, given by the ratio of RMSEC to RMSEP, showing this was optimized by including the best number of LVs. According to Roggo
et al. (2003), quantitative models are considered to be
of high accuracy when they present low values for bias
and RMSE. While Elfadl et al. (2010) consider that for
the model to be thought of as consistent the RMSEC to RMSEP ratio should be close to one.
Where: MSC = multiplicative signal correction, LVs = latent variables, RMSE = root mean square error (RMSEC for calibration and RMSEP for prediction) and R2 = coefficient of determination (R2
c for calibration and R2p for prediction)
Pre-treatment LVs RMSEC RMSEP R2
c R2p
Original spectra 10 6.592 7.214 0.7796 0.7651
MSC spectra 9 5.917 7.081 0.8223 0.7760
Table 1- Summary of the analysis of variability in the samples of macauba used for the calibration and validation sets
Statistical parameter Oil content (%)
Calibration set (estimate)
Maximum 55.67
Mean 28.82
Minimum 0.30
Deviation 14.07
CV 48.82
Validation set (prediction)
Maximum 56.03
Mean 27.88
Minimum 0.44
Deviation 14.94
Figure 1 - Graphical representation of the determination of the optimal number of LVs used to adjust the model, employing the RMSE (a) and R2 (b). Where:C = calibration, CV = cross-validation,VC-adj = adjusted cross-validation, EV = external
validation andLVs = latent variables
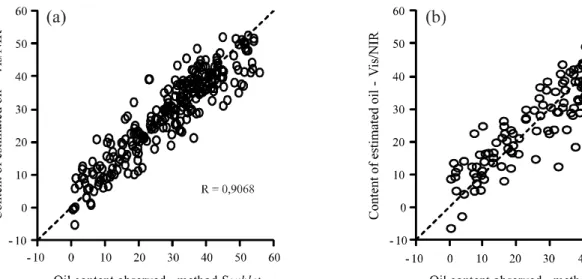
Presented in Figure 2 is a graphical visualisation of the correlation between the Soxhlet method and the VIS-NIR model. It can be seen that there is a linear correlation between the values predicted by the VIS-NIR model with the reference values, describing the same trend of a 45º line as the calibration set (Figure 2a). For the external validation, a significant correlation between the values predicted by the VIS-NIR model with the values obtained by the Soxhlet method (Figure 2b) was also observed.
The histograms shown in Figure 3 display the residual distribution for the calibration and external validation sets. The residuals were distributed between values of ± 100% in the sets, showing greater confinement between values of ± 5% and centralised on 0%, following a normal distribution.
The verified results were generally promising, indicating that VIS-NIR spectrometry has the potential to be applied as an alternative method in quantifying mesocarp oil in macauba fruit.
Table 3 - Summary of the statistics for calibration and external validation of the model for predicting the mesocarp oil content of macauba fruit
Where:LVs = latent variables,RMSE = root mean square error (RMSEC for calibration andRMSEP for prediction),R2 = coefficient of determination (R2
c for calibration andR 2
p for prediction) andbias = accuracy of correlation (biasc for calibration andbiasp for prediction)
Model LV
Modelled for oil contente (%)
Calibration (estimation) External validation (prediction)
R2
c RMSEC biasc R
2
p RMSEP biasp
VIS-NIR 9 0.8223 5.917 -9.2e-15 0.7760 7.081 -0.064
The VIS-NIR model developed in this work recorded a robustness of 82.23% for calibration and 77.60% for prediction in the 400-999 nm spectral band. In practice, this result is highly relevant, considering that this band coincides with the spectral coverage of most portable spectroradiometers. The practical advantage of using this band is in the possibility of conducting analyses both in the laboratory and directly in the field.
The work carried out on other oilseeds, aiming at the calibration of models for prediction of the oil content by spectrometry, and referred to here, have only reported results in the near infrared spectral region. Baye and Becker (2004) studied the potential of NIRS to access the profile of fatty acids and the
oil and protein content of seeds from the Vernonia
galamensis germplasm, finding an R2 of 0.71 for the prediction model of oil content. Spectral coverage was
in the 1,100-2,500 nm wavelength band. Elfadl et al.
(2012) with cotton (R2 = 0.99) were other authors who have reported interesting results working in the spectral band of wavelengths above 1,100 nm.
Velascoet al. (1999b), in similar work with seeds
from the Brassicaceae germplasm, developed a model
for the prediction of oil content having an R2 equal to
0.97. However, even though measuring reflectance in the spectral band between 400 and 2,500 nm, the models were calibrated using spectral information from the band between 1,100 and 2,500 nm; spectral information from wavelengths below 1,100 nm being
Figure 3 - Histograms of the residuals: calibration (a) and external validation (b)
irrelevant for a robust model. Jianget al. (2007) worked
with wavelengths between 780-2,500 nm, however in order to characterise maize in terms of oil content, only the spectral bands from 1,114 to 1,836 nm and between 2,171 and 2,357 nm were relevant in obtaining robust
models (R2 = 0.94 to 0.95). For Velascoet al. (1999a)
with rapeseed, although also working with the 400-2,500 nm spectral band, only the bands between 1,100 and 1,460 nm and between 1,560 and 2,500 nm were
relevant, obtaining models with an R2 of 0.92.
Pérez-Vichet al. (1998), similar to the other authors, found
that only the spectral band between 1,100 and 2,500 nm was relevant when obtaining robust models to access the oil content of sunflower seeds. However, they also reported differences in the robustness of the models
when using the NIRS spectra of intact seeds (R2 from
0.76 to 0.85), milled seeds (R2 from 0.92 to 0.98) and
husked seeds (R2 from 0, 90 to 0.97).
With regard to the above it is evident that, along with their chemical attributes, both the physical characteristics of the samples and the spectral region used are also of great relevance in the calibration of predictive models, influencing their robustness.
CONCLUSION
VIS-NIR spectroscopy is a robust and practical alternative when quantifying the oil content of the mesocarp of macauba palm fruit. Its use would be beneficial in terms of time and cost savings, in addition to the environmental advantages, since it would significantly reduce the number of analyses needed by the standard, Soxhlet method. It is also a viable tool for the evaluation of genotypes in breeding programs for the macauba palm.
ACKNOWLEDGEMENT
The authors acknowledge the support of the institutions CNPq e FAPEMIG.
REFERENCES
AMERICAN OIL CHEMIST’ SOCIETY. Official methods and recommended practices of the American Oil Chemist’s Society. Fourth edition. Washington: American Oil Chemist’s Society Press, 1994. Cd 3d-63.
ANALYTICAL SPECTRAL DEVICES Inc.
FieldSpec®HandHeld 2™ Spectroradiometer user manual. ASD Document 600860 Rev. D, 92 p. 2011. Disponível em: <www.asdi.com>. Acesso em: 10 set. 2011.
BALBIN, R. M.; SMIRNOV, S. V. Variable selection in near infrared spectroscopy: Benchmarking of feature selection methods on biodiesel data.Analytica Chimica Acta, v. 692, n. 1/2, p. 63-72, 2011.
BAYE, T.; BECKER, H. C. Analyzing seed weight, fatty acid composition, oil, and protein contents inVernonia galamensis
germoplasma by near infrared reflectance spectroscopy.
Journal of the American Oil Chemist’s Society, v. 81, n. 7, p. 641-645, 2004.
BLANCO, M. et al. Orthogonal signal correction in near infrared calibration. Analytica Chimica Acta, v. 434, n. 1,
p. 125-132, 2001.
BORA, P. S.; ROCHA, R. V. M. Macaíba palm: fatty and amino acids composition of fruits.Ciência Tecnologia & Alimentos,
v. 4, n. 3, p. 158-162, 2004.
COCININI, G. Caracterização de frutos e óleo da polpa de macaúba dos biomas do cerrado e pantanal do estado de Mato Grosso do Sul, Brasil. 2012. 128 f. Dissertação (Mestrado em Biotecnologia) - Universidade Católica Dom Bosco, Campo Grande, 2012.
COIMBRA, M. C.; JORGE, N. Characterization of the pulp and kernel oils from Syagrusoleracea, Syagrusromanzoffiana, and
Acrocomia aculeata.Journal of Food Science, v. 76, n. 8, p. 1151-1161, 2011.
ELFADL, E. et al. Development of near infrared reflectance spectroscopy (NIRS) calibration model for estimation of oil content in a worldwide Safflower germoplasm collection.
International Journal of Plant Production, v. 4, n. 4, p. 259-270, 2010.
FEUDALE, R. N. et al. Transfer of multivariate calibration models: a review.Chemometrics and Intelligent Laboratory Systems, v. 62, n. 2, p. 181-192, 2002.
JIANG, H. Y. et al. Analysis of protein, starch and oil content of single intact kernels by near infrared reflectance spectroscopy (NIRS) in Maize (Zea mays L.).Plant Breeding, v. 126, n. 5, p. 492-497, 2007.
LI, B. et al. Model selection for partial least squares regression. Chemometrics and Intelligent Laboratory Systems, v. 64, n. 1, p. 79-89, 2002.
LIU, F. et al. Variable selection in visible/near infrared
spectra for linear and nonlinear calibrations: A case study to determine soluble solids content of beer.Analytica Chimica Acta, v. 634, n. 1, p. 45-52, 2009.
MEVIK, BJORN-HELGE; CEDERKVIST, H.R. Mean Squared Error of Prediction (MSEP) Estimates for Principal Component Regression (PCR) and Partial Least Squares Regression (PLSR).Journal of Chemometrics, v. 18, n. 09, p. 422-429, 2004.
MEVIK, BJORN-HELGEet al. Ensemble methods and partial least squares regression.Journal of Chemometrics, v. 18 n. 11, p. 498-507, 2004.
MOGHIMI, A.et al. Vis/NIR spectroscopy and chemometrics
for the prediction of soluble solids content and acidity (pH) of kiwifruit. Biosystems Engineering, v. 106, n. 3, p. 295-302,
2010.
PÉREZ-VICH, B.et al. Determination of seed oil content and
fatty acid composition in Sunflower through the analysis of intact seeds, husked seeds, meal and oil by near infrared reflectance spectroscopy.Journal of the American Oil Chemist’s Society, v. 75, n. 5, p. 547-555, 1998.
QUAMPAH, A. et al. Estimation of oil content and fatty
infrared reflectance spectroscopy.Journal of the American Oil Chemist’s Society, v. 89, n. 4, p. 567-575, 2012.
R DEVELOPMENT CORE TEAM. R: A language and
environment for statistical computing. R Foundation for Statistical Computing, 2012. Disponível em: <www.R-project.org> Acesso em: 10 set. 2012.
ROGGO, Y.et al. Statistical tests for comparison of quantitative
and qualitative models developed with near infrared spectral data.Journal of Molecular Structure, v. 654, n. 1/3, p. 253-262, 2003.
ROSSEL, R. A. V.et al. Visible, near infrared, mid infrared or
combined diffuse reflectance spectroscopy for simultaneous assessment of various soils proprieties.Geoderma, v. 131, n. 1/2, p. 59-75, 2005.
RUDOLPHI, S. et al. Improved estimation of oil linoleic
and oleic acid and seed hull fractions in Safflower by NIRS.
Journal of the American Oil Chemist’s Society, v. 89, n. 3, p. 363-369, 2012.
SIVAKESAVA, S.; IRUDAYARAJ, J. Rapid determination of tetracycline in milk by FT-MIR and FT-NIR spectroscopy.
Journal Dairy Science, v. 85, n. 3, p. 487-493, 2002.
ANDERSON, S. Soxtec: Its principles and applications. AOCS Press, 2004. Chapter 2, 14 p.
SWIERENGA, H. et al. Strategy for constructing robust
multivariate calibration models.Chemometrics and Intelligent Laboratory Systems, v. 49, n. 1, p. 1-17, 1999.
VAKNIN, Y.et al. PredictingJatropha curcas seed-oil content,
oil composition and protein content using near infrared spectroscopy - a quick and nondestructive method.Industrial Crops and Products, v. 34, n. 1, p. 1029-1034, 2011.
VELASCO, L.et al. Estimation of seed weight, oil content
and fatty acid composition in intact single seeds of rapeseed (Brassica napus L.) by near infrared reflectance spectroscopy.
Euphytica, v. 106, n. 1, p. 79-85, 1999a.
VELASCO, L.et al. Development of calibration equations to
predict oil content and fatty acid composition in Brassicaceae germoplasm by near infrared reflectance spectroscopy.
Journal of the American Oil Chemist’s Society, v. 76, n. 1, p. 25-30, 1999b.