DWESD
5, 291–332, 2012Low-cost multi-stage filtration
L. D. S ´anchez et al.
Title Page
Abstract Introduction
Conclusions References
Tables Figures
◭ ◮
◭ ◮
Back Close
Full Screen / Esc
Printer-friendly Version Interactive Discussion
Discussion
P
a
per
|
Dis
cussion
P
a
per
|
Discussion
P
a
per
|
Discussio
n
P
a
per
|
Drink. Water Eng. Sci. Discuss., 5, 291–332, 2012 www.drink-water-eng-sci-discuss.net/5/291/2012/ doi:10.5194/dwesd-5-291-2012
© Author(s) 2012. CC Attribution 3.0 License.
Drinking Water
Engineering and ScienceDiscussions
O
p
en
Acc
e
s
s
This discussion paper is/has been under review for the journal Drinking Water Engineering and Science (DWES). Please refer to the corresponding final paper in DWES if available.
Low-cost multi-stage filtration enhanced
by coagulation-flocculation in upflow
gravel filtration
L. D. S ´anchez1, L. M. Marin1, J. T. Visscher2, and L. C. Rietveld3
1
Universidad del Valle, Facultad de Ingenier´ıa, Instituto Cinara, Cali, Colombia 2
JTF-Rotterdam BV, Rotterdam, The Netherlands 3
Delft University of Technology, P.O. Box 5084, 2600 GA Delft, The Netherlands
Received: 18 January 2012 – Accepted: 5 June 2012 – Published: 29 June 2012
Correspondence to: L. D. S ´anchez ([email protected])
DWESD
5, 291–332, 2012Low-cost multi-stage filtration
L. D. S ´anchez et al.
Title Page
Abstract Introduction
Conclusions References
Tables Figures
◭ ◮
◭ ◮
Back Close
Full Screen / Esc
Printer-friendly Version Interactive Discussion
Discussion
P
a
per
|
Dis
cussion
P
a
per
|
Discussion
P
a
per
|
Discussio
n
P
a
per
|
Abstract
This paper assesses the operational and design aspects of coagulation and floccula-tion in upflow gravel filters (CF-UGF) in a multi-stage filtrafloccula-tion (MSF) plant. This study shows that CF-UGF units improve the performance of MSF considerably, when the system operates with turbidity above 30 NTU. It strongly reduces the load of particulate
5
material before the water enters in the slow sand filters (SSF) and therewith avoids short filter runs and prevents early interruption in SSF operations. The removal effi -ciency of turbidity in the CF-UGF with coagulant was between 85 and 96 %, whereas the average efficiency without coagulant dosing was 46 % (range: 21–76 %). Operating with coagulant also improves the removal efficiency for total coliforms,E-coliand HPC.
10
No reduction was observed in the microbial activity of the SSF, no obstruction of the SSF bed was demonstrated and SSF runs were maintained between 50 and 70 days for a maximum head loss of 0.70 m. The most important advantage is the flexibility of the system to operate with and without coagulant according to the influent turbidity. It was only necessary for 20 % of the time to operate with the coagulant. The CF-UGF
15
unit represented 7 % of total construction costs and the O&M cost for the use of coag-ulant represented only 0.3 %.
1 Introduction
Water quality and quantity from surface sources are changing due to the deteriora-tion of watersheds caused by deforestadeteriora-tion, erosion, and the discharge of untreated
20
wastewater (e.g., in Colombia only 3.1 % of the total volume of wastewater produced is treated, CGR, 2009). These changes are intensified by the global climate change caus-ing longer dry periods on the one hand and more intense rainfall on the other (Bates et al., 2008). The two most serious problems concern the peaks in turbidity level and high E-coli concentrations of long duration. These changes are affecting the existing
wa-25
DWESD
5, 291–332, 2012Low-cost multi-stage filtration
L. D. S ´anchez et al.
Title Page
Abstract Introduction
Conclusions References
Tables Figures
◭ ◮
◭ ◮
Back Close
Full Screen / Esc
Printer-friendly Version Interactive Discussion
Discussion
P
a
per
|
Dis
cussion
P
a
per
|
Discussion
P
a
per
|
Discussio
n
P
a
per
|
and even interruptions in their operation (Bates et al., 2008). These growing water quality problems are not unique for Colombia but imply a significant challenge in the Andean region, because surface water is the main source in the water supply systems (S ´anchez and Galvis, 1998). In Colombia about 80 % of the water supply systems are based on surface water supply (Ministerio de Desarrollo, 1998). The problems
partic-5
ularly affect water supply systems in rural areas and small towns, many of which even lack adequate water treatment.
Multi-Stage Filtration (MSF) is one of the more promising and reliable water treat-ment options for small communities. This technology uses a combination of gravel fil-tration (GF) in combination with slow sand filfil-tration (SSF). Upflow gravel filfil-tration (UGF)
10
is the most common pre-treatment system used for MSF in Colombia (Galvis and Viss-cher, 1998). In UGF the water passes through the gravel bed from bottom to top. During this passage impurities are retained in the filter. Upflow filtration has the advantage that the heavier particles are removed first at the bottom of the filter. Burganos et al. (1994) have reported that upflow units have an increased collection efficiency at small and
15
medium pore inclination angles. This concept is interesting for the theoretical analysis of particle motion and deposition, but complex to manage in practice. When the time comes to clean the filters, the accumulated particles can be removed by opening the drainage valve, allowing gravity flow to drain and clean the filter.
Research carried out by Cinara over more than 15 yr showed that different MSF
al-20
ternatives that were tested, including UGF (filtration rate,Vf=0.6 m h−1) and SSF
(op-erating at 0.15 m h−1), were able to produce e
ffluents with a low microbial risk (Galvis, 1999). Research also explored the use of coagulation and flocculation with UGF, called CF-UGF, focusing, in pilot plants, on the combination with rapid filters (RF). The results showed a reduction in the consumption of coagulants by up to 30 % compared to the
25
conventional system of coagulation, flocculation and high rate sedimentation (Cinara and IRC, 1996).
DWESD
5, 291–332, 2012Low-cost multi-stage filtration
L. D. S ´anchez et al.
Title Page
Abstract Introduction
Conclusions References
Tables Figures
◭ ◮
◭ ◮
Back Close
Full Screen / Esc
Printer-friendly Version Interactive Discussion
Discussion
P
a
per
|
Dis
cussion
P
a
per
|
Discussion
P
a
per
|
Discussio
n
P
a
per
|
3–5 min in a UGF is equivalent to a time of 15 min in the jar test under laboratory conditions and 25 min in non-compartmentalized flocculation units in full-scale plants. Santamar´ıa (1999) showed that, using UGF, the flocculation time can be reduced by up to 60 % compared to mechanical flocculators; Salazar and Ocampo (1999) found that in CF-UGF, producing the same water quality would require between 10 and 20 times less
5
retention time compared to a sludge blanket clarifier; Kawamura (1985), working on pi-lot units with UGF and RF, reported a turbidity removal of 50 %; Ahsan (1995) found that horizontal gravel filtration (HGF) with coagulation removes more particles compared to the HGF without chemicals. In addition, studies with different packed gravel beds found that a stratified bed is more efficient than a uniform bed (Attakoya et al., 1991). Diff
er-10
ent studies have contributed to refining the parameters for design and operation and maintenance which have been defined by Di Bernardo (1993). However, the use of CF-UGF with MSF has had few full-scale applications. Full-scale experiences using UGF based on conventional technology with rapid filtration as a final stage were re-ported by Kardile (1981), working with aVf=4–10 m h−1 and turbidity levels between
15
300–500 NTU, achieving construction costs between 30 to 50 % less than conventional systems of equal capacity. Bohle (1981) reported a velocity gradient in a truncated pyramid filter ofG=1230 s−1at the bottom layer and 35 s−1 at the upper layer with a
Vf=11.3 m h−1. More recent studies indicated that aluminium residual has not shown
any effects on biological activity in SSF, when coagulation with aluminium sulphate
20
has been used, Dorea and Clarke (2006). This indicates that the addition of coagu-lant with UGF has potential to improve the performance of MSF during variations in influent water quality, conserving biological processes in the following stages. Conse-quently full-scale evaluations are necessary to better understand the design variables and operation and maintenance conditions.
25
DWESD
5, 291–332, 2012Low-cost multi-stage filtration
L. D. S ´anchez et al.
Title Page
Abstract Introduction
Conclusions References
Tables Figures
◭ ◮
◭ ◮
Back Close
Full Screen / Esc
Printer-friendly Version Interactive Discussion
Discussion
P
a
per
|
Dis
cussion
P
a
per
|
Discussion
P
a
per
|
Discussio
n
P
a
per
|
found in the pipes, which generated problems of re-growth of micro-organisms in the water supplied to the users (average values of 2183 CFU (100 ml)−1 for heterotrophic
bacteria, 7 CFU (100 ml)−1 forE-coli, and 39 CFU (100 ml)−1 for total coliforms were
also found at four points in the distribution network). In the treatment plant, which had been operating for 4 yr, failures were identified in its functioning, allowing solids and
5
micro-organisms to pass into the distribution system. After an investigation, the treat-ment system was redesigned and rebuilt to CF-UGF with MSF. This new system has been in operation for 7 yr at the time that this evaluation study was carried out.
This paper assesses the performance and the design aspects of the CF-UGF units followed by UGF and SSF, defining influent turbidity levels to allow operation with and
10
without coagulant, taking advantage of the SSF as the final stage of filtration for the removal of microorganisms.
2 Materials and methods
2.1 Set-up of the treatment system
In Fig. 1 the set-up of the CF-UGF MSF plant is shown. The system operation is
per-15
formed by pumping raw water to the plant and then, after treatment, pumping it into the distribution network. The system uses two pumping flow rates: 6 l s−1, which is the
maximum capacity for 12 h during the day and 3 l s−1 for another 12 h at night. The
treatment plant consists of 5 components. Raw water passes through the flow control unit in the dynamic roughing filter (DRF), whose main function is to protect the next
20
steps from excessive loads of suspended solids and turbidity. Filtered water flows into a rapid mixing chamber (RMC), where the coagulants are dosed. Afterwards, the wa-ter enwa-ters the CF-UGF stage which consists of 2 units in parallel, where the processes of coagulation, flocculation, sedimentation and filtration of destabilized particles occur. Water is collected in a front weir to later enter the UGF where remaining flocculated
DWESD
5, 291–332, 2012Low-cost multi-stage filtration
L. D. S ´anchez et al.
Title Page
Abstract Introduction
Conclusions References
Tables Figures
◭ ◮
◭ ◮
Back Close
Full Screen / Esc
Printer-friendly Version Interactive Discussion
Discussion
P
a
per
|
Dis
cussion
P
a
per
|
Discussion
P
a
per
|
Discussio
n
P
a
per
|
particles are removed in the different layers of gravel. From there, the water enters the SSF stage for final removal of suspended particles and microorganisms.
The RMC unit allows a proper rapid mixing time and a velocity gradient, while the CF-UGF unit facilitates flocculation and deposition of particles. The hydraulic RMC operates through a rectangular weir that allows free flow of water to form a hydraulic
5
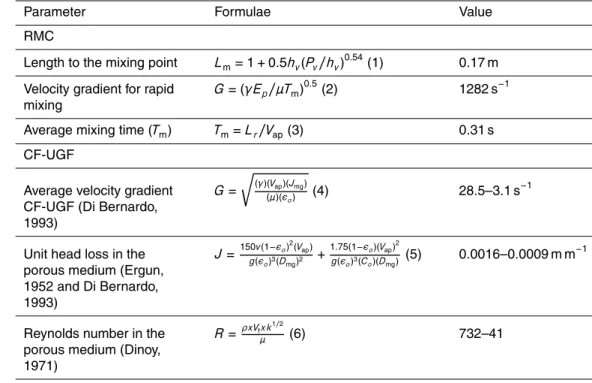
jump for mixing the coagulant with the raw water. Above the RMC a channel provided with holes is installed to distribute the coagulant and initiate the destabilization of the particles, which will be removed in the CF-UGF and the UGF. The RMC is divided into 3 compartments, one for arrival and energy dissipation, one for mixing and one for the outlet of the coagulated water to the CF-UGF. Table 1 lists the parameters considered
10
for the design of the unit, the formulae and the values obtained during the operation, while Fig. 2 shows the layout of the CF-UGF unit.
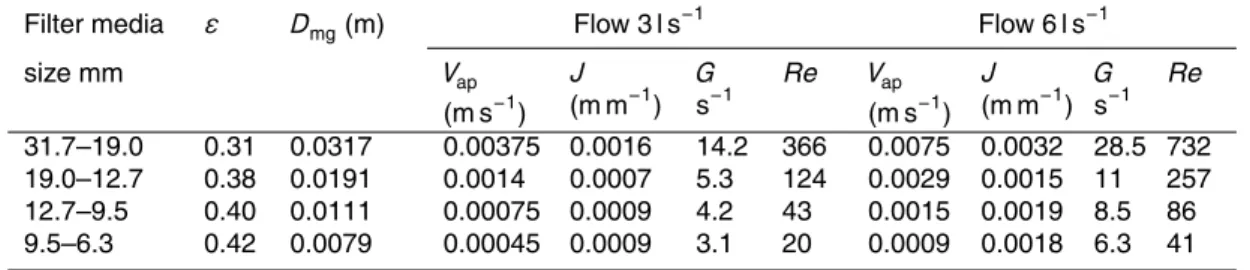
The CF-UGF step consists of 2 units in parallel and forms the third component in the treatment scheme. The system has 4 layers of gravel bed and was designed as a truncated pyramid to facilitate variation in the velocity gradient, producing a variable
15
gradient from the highest to the lowest value from the bottom to the surface of the unit. In Table 2 the values of the velocity gradient for two flow operations are listed, depending on the properties of the filter bed and the average fluid velocity in each gravel layer, the cross-sectional area of the filter and the head loss in the bed. The calculation of the velocity gradient was done by Eq. (4) (see Table 1), proposed by
20
Ergun (1952), which is valid for any flow regime as long as the bed is not fluidized (Di Bernardo, 1993).
The flocculation gradient is greater at the bottom of the bed, decreasing towards the top of the filter, basically to promote the formation of flocs (Fair et al., 1984). It should be noted that the velocity gradient values were lower than those reported by Ahsan (1995)
25
(200–300 s−1) because the filtration rate in CF-UGF was lower. The Reynolds numbers
DWESD
5, 291–332, 2012Low-cost multi-stage filtration
L. D. S ´anchez et al.
Title Page
Abstract Introduction
Conclusions References
Tables Figures
◭ ◮
◭ ◮
Back Close
Full Screen / Esc
Printer-friendly Version Interactive Discussion
Discussion
P
a
per
|
Dis
cussion
P
a
per
|
Discussion
P
a
per
|
Discussio
n
P
a
per
|
Wright (1968). For the calculation of the head loss in the filter the Ergun equation was used.
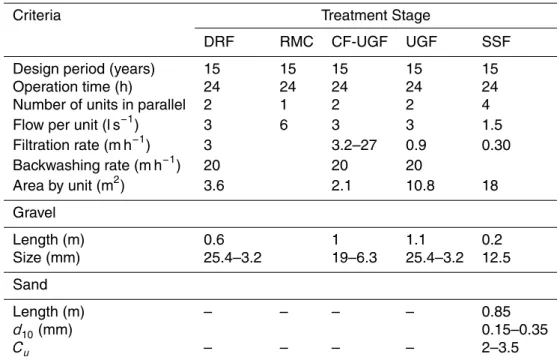
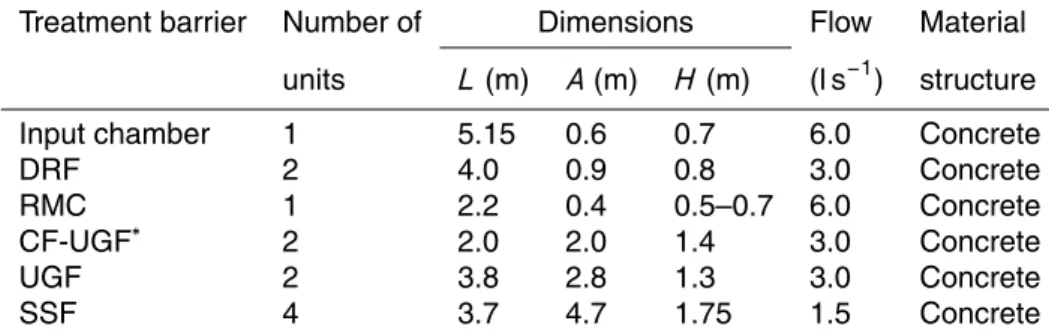
The calculations for each barrier of the treatment system were done on the basis of the design parameters presented in Table 3 and the dimensions of each barrier in Table 4. The optimal dose of coagulant for operation of the CF-UGF system was
5
defined according to the results of jar tests; the rapid mixing intensity and the slow mixing during the jar test were expressed in the velocity gradientG(s−1) following the
method described by Castro and P ´erez (1981) and were used for a first approximation of the velocity gradient in the CF-UGF.
2.2 Monitoring water quality and system operation
10
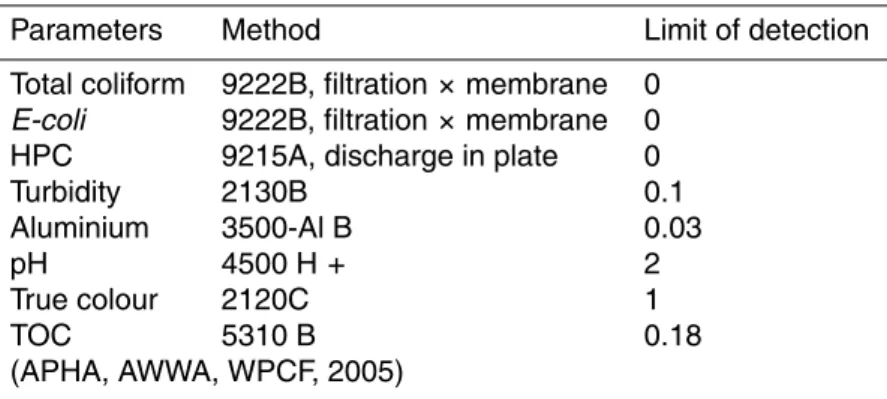
During the study, the raw water was monitored for the following parameters: turbid-ity, true colour,E-coli, total coliforms, heterotrophic bacteria plate count (HPC) and pH. The water quality parameters and related methods are listed in Table 5. Measurements of the head loss (hf) over the filter bed were done for short periods of operation (4–6 h), when coagulants were applied. However, when operating without coagulant, daily
mea-15
surements were done during periods of 8 days, according to the schedule defined by the plant operators for cleaning the CF-UGF and UGF. This is because with time large quantities of solids will accumulate within the gravel bed and then filter resistance will increase gradually and the water level within the inlet chamber will rise to a maximum hf. To facilitate the measurements ofhf, steel rules were installed in the inlet chamber,
20
taking care that the zero of the rule coincides with the water level in the chamber for the no-flow condition.
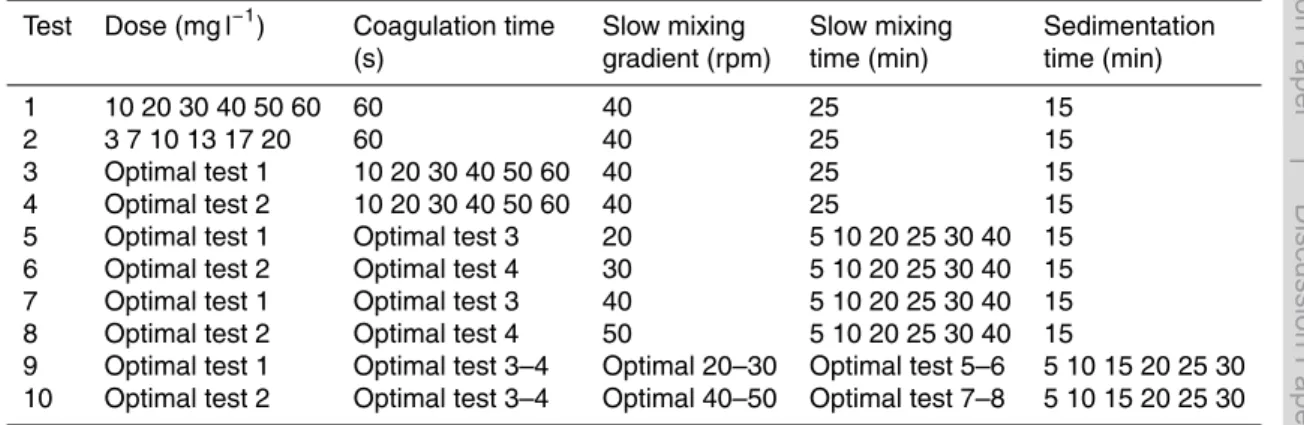
Jar tests were carried out following the method presented by Di Bernardo (1993), where rapid mixing is done using jar test equipment with 2-liter glass jars. The coagu-lant used was 50 % liquid aluminium sulphate diluted with water to 2 %, and was added
25
DWESD
5, 291–332, 2012Low-cost multi-stage filtration
L. D. S ´anchez et al.
Title Page
Abstract Introduction
Conclusions References
Tables Figures
◭ ◮
◭ ◮
Back Close
Full Screen / Esc
Printer-friendly Version Interactive Discussion
Discussion
P
a
per
|
Dis
cussion
P
a
per
|
Discussion
P
a
per
|
Discussio
n
P
a
per
|
8 µm), to obtain a volume sufficient to realize analyses. The procedure for conducting the jar tests is presented in Table 6.
Tracer tests were performed according to the methodology described by P ´erez and Galvis (1990), in order to understand the hydraulic performance of the CF-UGF and UGF units. Trials were conducted following the experimental stimulus-response
5
method, in which a tracer, easily detectable and not involved in any of the physi-cal and chemiphysi-cal processes that may alter the actual fluid hydrodynamics and with a known concentration, is injected into the influent (Rocha et al., 2000). The concentra-tion curve of the tracer was analysed to determine the porconcentra-tion of plug flow, dead zones, and the fraction that works as a completely mixed flow. These tests were conducted
10
using sodium chloride. The substance was dosed continuously through a constant hy-draulic head dispenser with a sodium chloride concentration between 50–100 mg l−1.
The dosing period was three times the theoretical retention time of each unit and the response was measured at the output of each unit by means of electrical conductivity. Measurements were taken after the CF-UGF unit every 2 min. Results were analysed
15
with the mathematical model Wolf-Resnick, the Morril Index (relationship between the time between the 90 % and the 10 % passage of the tracer), and the model of com-pletely mixed reactors in series (CMRS), (P ´erez and Galvis, 1990; CEPIS, 2004). Wolf-Resnick model Eq. (7) indicates that by plotting the fraction of tracer remaining in the filter (1−F(t)) versusT to−1(relationship between measured time and the theoretical
re-20
tention time), it is possible to estimate the valuesθand tanα (the slope of the straight line), and to identify the characteristics of the reactor using Eqs. (8) to (11). CMRS model was analyzed using Eq. (12), wheren is the number of reactors in series and C C−1
o , is the relationship between the concentration of tracer which remains in the
reactor at a time and the concentration of tracer applied.
25
log 1−F(t)=−tanα[(t/to)−p(1−m)] (7)
DWESD
5, 291–332, 2012Low-cost multi-stage filtration
L. D. S ´anchez et al.
Title Page
Abstract Introduction
Conclusions References
Tables Figures
◭ ◮
◭ ◮
Back Close
Full Screen / Esc
Printer-friendly Version Interactive Discussion
Discussion
P
a
per
|
Dis
cussion
P
a
per
|
Discussion
P
a
per
|
Discussio
n
P
a
per
|
Plug flow (θ) :θ=p(1−m) (9)
Dead zones (m) :m=1−(θ/p) (10)
Mixed flow (Mf) :Mf=(1−p)(1−m) (11)
5
CMRS model : C
Co =n
n·tot n−1
(n−1)!
e−n·tot
(12)
The porosity (ε0) of the filter material was determined following the procedure defined
by Ives (1990): first, the mass (M) occupied by the sample of gravel in a container of
10
known volume and the apparent volume (V) occupied by the gravel in the container were both measured; then the density (ρs) of the gravel was determined by the ratio
between the mass of the sample and the volume occupied by the sample. The porosity was calculated by Eq. (13).
ε0=1−M/ρsV (13)
15
The filter cleaning procedure was the following: the water inlet to the unit was inter-rupted; without removing the supernatant water the surface of the gravel bed was cleaned manually with a shovel, stirring the surface layer of the filter to remove solid material adhering to the gravel; the supernatant water with the removed deposits from the top of the filter bed was discharged through a front weir; then the filter was
pre-20
pared for removal of the deposits in the filter by adding water to the unit by opening the flow control valve in the inlet chamber to restore the supernatant water layer and increasing its height to a level of water between 20–25 cm above the gravel in the main compartment; this increased height adds some pressure for the cleaning procedure, in which fast drainage was carried out by quickly opening and closing (some 10 times)
25
DWESD
5, 291–332, 2012Low-cost multi-stage filtration
L. D. S ´anchez et al.
Title Page
Abstract Introduction
Conclusions References
Tables Figures
◭ ◮
◭ ◮
Back Close
Full Screen / Esc
Printer-friendly Version Interactive Discussion
Discussion
P
a
per
|
Dis
cussion
P
a
per
|
Discussion
P
a
per
|
Discussio
n
P
a
per
|
cleaning and drainage procedure was repeated for adequate cleaning of gravel; then the filter was put back into operation.
The flow rate (Q) of the draining procedure in the UGF units was determined by the following procedure: (a) the unit was filled to the maximum level of the top; (b) the wa-ter flow into the filwa-ter was inwa-terrupted; (c) the surface area was measured (A); (d) the
5
butterfly valve was opened until the water level lowered by 5 cm; (e) the declining wa-ter level (∆h) was measured over time (t) and (f) the initial flow rate was set by the expressionQ= ∆h·A/t(m3s−1).
3 Results and discussion
3.1 Water quality of the source water
10
The water source is a small mountain river (the Arroyo Hondo River) which drains an area that has problems of deforestation and erosion, strong activity in the basin of rocky material exploitation for construction and discharge of untreated wastewater. The be-haviour of microbiological parameters over a 3-month period indicated that the source has, according to Lloyd and Helmer (1991) and WHO (2011), a high microbiological
15
risk, because faecal coliform values at all times exceeded 1000 CFU (100 ml)−1.E-coli
bacteria were below 4.2 logs CFU (100 ml)−1 for 95 % of the time, but were never less
than 3.2 logs CFU (100 ml)−1. The average values of HPC and total coliforms were 5.3
logs CFU (100 ml)−1and 5.1 logs CFU (100 ml)−1, respectively.
The behaviour of turbidity in the source was measured for a period of one year. This
20
parameter, which is easy to measure, is a good indicator to control the system and facilitates decision-making by the operator. The results indicated that the turbidity in the source did not exceed 100 NTU for 97 % of the time, while the turbidity was lower than 25 NTU for 75 % of the time. Minimum values of 3 NTU were recorded during the summer period and maximum values of 350 NTU during the rainy season. Turbidity
25
DWESD
5, 291–332, 2012Low-cost multi-stage filtration
L. D. S ´anchez et al.
Title Page
Abstract Introduction
Conclusions References
Tables Figures
◭ ◮
◭ ◮
Back Close
Full Screen / Esc
Printer-friendly Version Interactive Discussion
Discussion
P
a
per
|
Dis
cussion
P
a
per
|
Discussion
P
a
per
|
Discussio
n
P
a
per
|
time the true colour level in the river was below 25 UPC and at no time the level dropped below 5 UPC.
3.2 Coagulant dosage
Figure 3 presents the results of the optimal dose of aluminium sulphate for different turbidity levels. The dosage behaves as a logarithmic function. The results correspond
5
to: rapid mixing time 60 s, gradient of rapid mixing 300 rpm (G=280 s−1), slow
gradi-ent mixing of 60 rpm (G=28 s−1), slow mixing time 25 min, and sedimentation time of
20 min. The optimum pH for optimum dosing was in the range of 6.6–7.6 for an alkalinity between 59–133 mg (l CaCO3)−1.
3.3 Hydraulic behaviour of CF-UGF units
10
Figure 4 shows the results of the mathematical model Wolf-Resnick. The model results for CF-UGF indicate that the system worked with a plug flow fraction of 51 %, a mixed fraction of 46 % and a dead zone fraction of 3 % (r2=0.90). Taking into account the dead zones in the CF-UGF, the velocity gradient in the unit varied between 3.2 and 29.4 s−1, which is close to the value calculated in Table 2 and obtained in the jar test to
15
optimize the coagulant dose. The Morrill Index (MI) was 1.82, which suggests, accord-ing to experiments by Perez and Galvis (1990), the predominance of plug flow in the CF-UGF unit. Figure 5 presents the results of the CMRS model. The continuous lines show the hydraulic behaviour withnreactors in series, while the dotted line represents the measurements at the CF-UGF unit. When comparing the results of the theoretical
20
model with experimental data, the hydraulic behaviour of the reactor CF-UGF tends to n=6 reactors in series (see continuous black curve, Fig. 5), confirming the presence of a relative plug flow. The mean residence time (tm) was estimated from the experimen-tal curve, determining the centroid under the curve, the mean residence time for the CF-UGF was 19.7 min for the flow of 3 l s−1while theoretical retention time was 19 min.
25
DWESD
5, 291–332, 2012Low-cost multi-stage filtration
L. D. S ´anchez et al.
Title Page
Abstract Introduction
Conclusions References
Tables Figures
◭ ◮
◭ ◮
Back Close
Full Screen / Esc
Printer-friendly Version Interactive Discussion
Discussion
P
a
per
|
Dis
cussion
P
a
per
|
Discussion
P
a
per
|
Discussio
n
P
a
per
|
the curve of distribution residence time has a tail and therefore the time will be dis-placed in the time axis (Fig. 5), the fluid elements that were trapped in the dead zones is conducted very slowly and will have a much larger residence time.
3.4 Removal of turbidity in the operation without coagulant
The operation of the CF-UGF without coagulant dosing was used in dry periods.
Fig-5
ure 6 shows the frequency of turbidity in raw water and after different treatment barri-ers, including DRF, CF-UGF, UGF and SSF. The CF-UGF units produced an effluent between 2.5–7.5 NTU, with mean removal efficiency of 46 %, while for 78 % of the time the UGF showed turbidity levels lower than 1 NTU and another 22 % were between 1.5–2 NTU. SSF units processed water with 0.3 NTU for 98 % of the time. CF-UGF and
10
UGF always produced water with turbidity levels below 10 NTU, which is the guideline value of inflow water to the SSF units, according to Di Bernardo (1993) and to Galvis et al. (1999) who add the requirement that filtration rates should be lower than 0.20 m h−1
in SSF units. In this case it was a little higher because the system operated at filtration velocities of between 0.15 and 0.30 m h−1(3–6 l s−1).
15
3.5 Removal of turbidity in the operation with coagulant
Figure 7 shows the frequency of turbidity in raw water and different treatment barriers, when the CF-UGF is operated with coagulants. The application of coagulant in the RMC varied as indicated in Fig. 3. In the effluent CF-UGF units, for 97.2 % of the time turbidity levels lower than 10 NTU were achieved, while the maximum value of turbidity
20
in the effluent in this step ranged between 15–20 NTU for 1.4 % of the time. The UGF showed turbidity levels lower than 6 NTU for 100 % of the time, thereby facilitating the operation of the SSF, which produced water with turbidity below 1 NTU for 98 % of the time. The addition of coagulant in the CF-UGF enabled water with turbidity levels below 10 NTU after UGF to be obtained. Increments in turbidity levels, which occur basically
25
DWESD
5, 291–332, 2012Low-cost multi-stage filtration
L. D. S ´anchez et al.
Title Page
Abstract Introduction
Conclusions References
Tables Figures
◭ ◮
◭ ◮
Back Close
Full Screen / Esc
Printer-friendly Version Interactive Discussion
Discussion
P
a
per
|
Dis
cussion
P
a
per
|
Discussion
P
a
per
|
Discussio
n
P
a
per
|
which contributed to an effective operating system, preventing reductions in the SSF filtration runs. Additionally, stops in the operation of the treatment plant were prevented. The removal efficiency of turbidity in the CF-UGF with coagulant was between 85 and 96 %, which is higher compared to operating without coagulant, and average effi -ciency of turbidity in the CF-UGF was 46 %, ranging between 21–76 %. The removal
5
efficiencies in CF-UGF with velocity gradients between 28.5–3.1 s−1(for 3 and 6 l s−1)
was consistent with the findings of Di Bernardo and Sabogal (2009), who established that the gradient must be less than 100 s−1. The e
fficiency in the removal of turbidity can be explained by the good opportunities for contact with particles in the gravel bed, which is consistent with Richter (1987), Attakoya et al. (1991), and Di Bernardo and
10
Cruz (1994).
3.6 Removal of microorganisms in the operation without coagulant
When operating without aluminium sulphate, the duration of the filter run was 8 days in the CF-UGF and UGF, regardless whether it achieved the maximum head loss or not (normally head loss is less than 5 cm in 8 days, to a maximum value of 15 cm). The
15
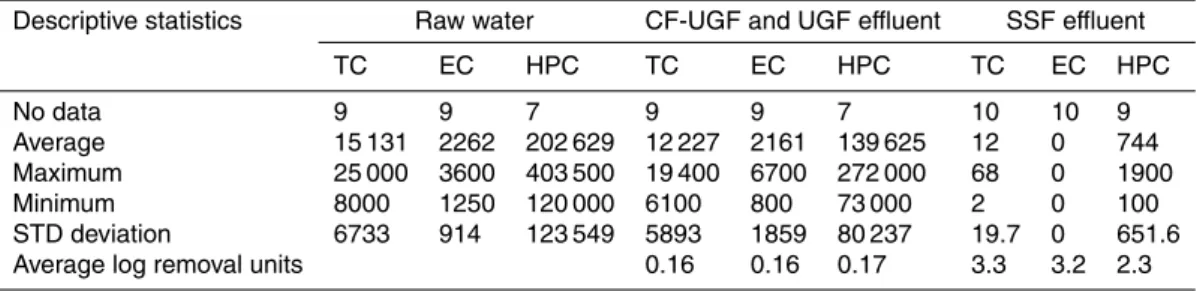
typical removal of microorganisms for a filter run is presented in Table 7 for samples taken in the influent of CF-UGF unit and the effluent of the UGF. The removal efficiency in the CF-UGF and UGF steps was 0.16 logs for total coliforms, 0.16 logs forE-coliand 0.17 logs for HPC, lower than that reported by Galvis et al. (1999), which was prob-ably due the effect of a higher filtration rate. SSF achieved a total reduction ofE-coli
20
of 3.2 log units, facilitating the work of chlorination as a security barrier. These results are consistent with the WHO (2011) which indicated that the range of log removal of bacteria for SSF must be between 2–6 under presence of schmutzdecke and appropri-ate: grain size, flow rate, operating conditions (mainly temperature, pH), cleaning and refilling and in the absence of short circuiting.
25
The reduction of the filtration velocity in the UGF from 0.9 to 0.5 m h−1contributed to
DWESD
5, 291–332, 2012Low-cost multi-stage filtration
L. D. S ´anchez et al.
Title Page
Abstract Introduction
Conclusions References
Tables Figures
◭ ◮
◭ ◮
Back Close
Full Screen / Esc
Printer-friendly Version Interactive Discussion
Discussion
P
a
per
|
Dis
cussion
P
a
per
|
Discussion
P
a
per
|
Discussio
n
P
a
per
|
HPC reached a removal of 0.64 logs. These reductions are close to those reported by Galvis et al. (1999). The average removal in SSF was 3.0 logs. The efficiency of the SSF was not influenced by changes in the filtration rate, probably due to the high level of maturity of the filters.
3.7 Removal of micro-organisms, operation with coagulant
5
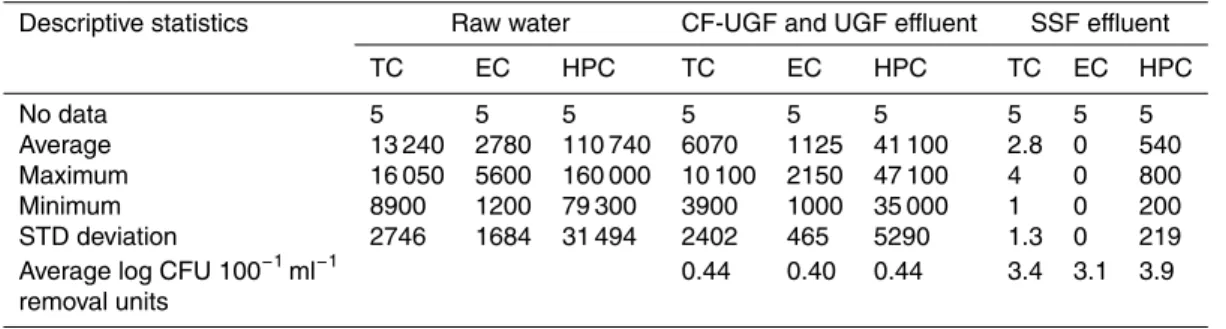
Table 8 presents the results of operating with coagulant, the data correspond to sam-ples taken in the influent of CF-UGF unit and the effluent of the UGF for a period of 6 h, because when turbidity was less than 30 NTU the coagulant dosing was stopped. The dose of aluminium sulphate corresponded to 10 mg l−1, with an operation flow of
6 l s−1. Overall, the pre-treatment with CF-UGF and UGF contributed to the reduction of
10
microbiological load: average 0.44 log removal for total coliforms, 0.40 log removal of E-coli, and 0.44 log removal for HPC. Only the CF-UGF unit contributed with average efficiencies for total coliforms equivalent to 0.19 log, 0.12 logs for E-coli and 0.15 log for HPC. The last stage of treatment, SSF, allowed a total reduction of 3.4 log of total coliforms, 3.1 log forE-coli, and 3.9 log of HPC. This suggests that the dosage of
alu-15
minium sulphate did not affect the biological activity in pre-treatment and SSF, which is consistent with that reported by Dorea and Clarke (2006).
When comparing operation with and without coagulant an increase in the average efficiency of removal of microorganisms, between 0.16–0.17 log to 0.40 to 0.44 log was observed, i.e. in the operation with coagulant the removal efficiency for total coliforms,
20
E-coli and HPC, was 2.75, 2.5 and 2.6 higher respectively compared to the operation without coagulant in the CF-UGF and UGF units.
3.8 Aluminium, pH, colour and organic matter
Residual aluminium in the system was low in the effluent of CF-UGF and 53 % was removed in the UGF, so that the concentration in the influent of the SSF varied
be-25
tween 0.07 and 0.09 mg l−1, and the average e
DWESD
5, 291–332, 2012Low-cost multi-stage filtration
L. D. S ´anchez et al.
Title Page
Abstract Introduction
Conclusions References
Tables Figures
◭ ◮
◭ ◮
Back Close
Full Screen / Esc
Printer-friendly Version Interactive Discussion
Discussion
P
a
per
|
Dis
cussion
P
a
per
|
Discussion
P
a
per
|
Discussio
n
P
a
per
|
(STD 0.005 mg l−1). This value was lower than the WHO (2011) guidelines, which
rec-ommended less than 0.2 mg l−1 for aluminium in drinking water. In a pilot study that
examined the impacts of chemical pre-treatment by gravel filters on SSF Dorea and Clarke (2006), reported an average aluminium concentration of 0.041 mg l−1 in the
effluent of the SSF and indicated that the chemical improved the overall treatment
5
efficiency. The filter runs of SSF were maintained between 50 and 70 days with a max-imum head loss of 0.70 m, which is in line with the range of 20–60 days reported by Schulz and Okun (1984), the minimum of 45 days recommended by Cleasby (1991) and the range of 46–178 days recommended by Galvis et al. (1999). The pH in the influent varied between 8.2 and 8.5 and between 8 and 8.2 in the effluent of CF-UGF,
10
which is expected not to affect the biological development of the Smutzdecke in the SSF, respect Galvis et al. (1999) reported pH in the range of 7.1–8.0 for operation of SSF and indicate that the adsorption of virus the sand improves with increasing ion concentration and valence of the cations in solution. The true colour reduction recorded an average efficiency of 54 % in the CF-UGF stage and 57 % in the UGF stage, and
15
the net efficiency of the true colour reduction of the CF-UGF and the UGF stage to-gether was 76 %. The organic matter content measured as total organic carbon (TOC) was low, the influent had an average value of 1.1 mg l−1(
±0.075), and the removal
ef-ficiency in the CF-UGF and UGF step together was 9 %, with an efficiency at the end of the treatment of 28 %.
20
3.9 Operation and maintenance
The treatment plant operated without coagulant for turbidity levels below 30 NTU. When influent turbidity was greater than 100 NTU, operators interrupted the operation to re-duce the turbidity load on the plant and, depending on water needs, operated with coagulant, reducing the filtration rate by half. When rain events occurred and the
in-25
DWESD
5, 291–332, 2012Low-cost multi-stage filtration
L. D. S ´anchez et al.
Title Page
Abstract Introduction
Conclusions References
Tables Figures
◭ ◮
◭ ◮
Back Close
Full Screen / Esc
Printer-friendly Version Interactive Discussion
Discussion
P
a
per
|
Dis
cussion
P
a
per
|
Discussion
P
a
per
|
Discussio
n
P
a
per
|
units for an event of short duration when the turbidity increased above 30 NTU up to a maximum value of 58 NTU, and operation with coagulant was necessary. The monitor-ing of the head loss was only done in the CF-UGF units. In the UGF unit, there was no change in head loss detected in the relatively short period of the event. The total loss over a period of 4 h of operation was 3.5 cm and did not achieve the maximum value of
5
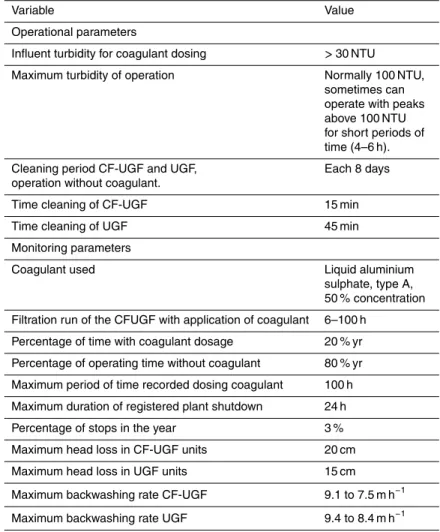
20 cm. Table 9 summarizes the operating and monitoring conditions.
Based on the information registered by the operators of the water treatment plant, cleaning frequency for the CF-UGF and the UGF units was every 8 days (without a co-agulant dosage). During the rainy period the CF-UGF units, operating with aluminium sulphate, registered cleaning frequencies in the range of 6–100 h. The cleaning
fre-10
quency of 6 h was obtained when influent turbidity reached values of above 100 NTU, while the 100-h operation mode was observed when influent turbidity levels were be-tween 30–60 NTU.
The behaviour of the cleaning of the CF-UGF in terms of turbidity is presented in Fig. 9. In the CF-UGF, cleaning was done by operating the butterfly valve in such a
15
way that 10 shock waves were created. It can be observed that, for the CF-UGF, in the first 15 s of the discharge a turbidity peak occurred, for 35 s the water was clear, and then after 85 s a second peak was observed. For the UGF, the solids discharge started immediately to reach a second peak after 150 s, about 5 times higher than the first peak. The behaviour of the water quality in the discharge of the wash water was
20
different from that reported by Wolters (1988) and Cinara and IDRC (1993). When the valve was opened suddenly, the particles which stayed on the filter media experience a change in velocity, whose effect may be to drag the particles to transport to the drainage system.
The flow rate of the drain water for cleaning the filter was variable over time;
mea-25
surements were done for different heights of water level relative to the position of the butterfly valve. The maximum backwashing rate for the UGF was 9.4 m h−1 while for
DWESD
5, 291–332, 2012Low-cost multi-stage filtration
L. D. S ´anchez et al.
Title Page
Abstract Introduction
Conclusions References
Tables Figures
◭ ◮
◭ ◮
Back Close
Full Screen / Esc
Printer-friendly Version Interactive Discussion
Discussion
P
a
per
|
Dis
cussion
P
a
per
|
Discussion
P
a
per
|
Discussio
n
P
a
per
|
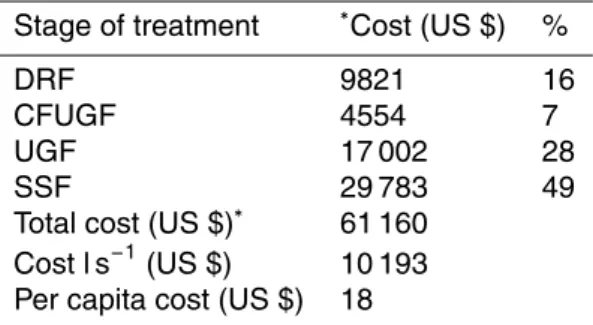
3.10 Investment, operation and maintenance costs
Tables 10 and 11 list the construction costs (year 2011) and operation and maintenance costs (year 2010). The CF-UGF stage represented only 7 % of the total construction costs, and the pre-treatment by CF-UGF and UGF represented 35 % of the total costs. The costs per m3of produced water was US $ 0.05 (discount rate of 12 % for Colombia
5
and project horizon of 15 yr). Per capita investment costs are US $ 18, for an average consumption of 150 l c−1d−1. The costs of O&M for the use of coagulant are low,
rep-resenting only 0.3 % of total O&M costs, because the operator only doses in periods of high turbidity, making the technology attractive. The highest costs of O&M represent pumping energy and staff. The O&M costs of US $ 0.264 m−3is low (depreciation was
10
included), when compared to the costs of US $ 1.04 m−3 (includes the average
invest-ment costs) for the utility of the city of Cali, close to the community. The O&M costs in a gravity system would reduce to US $ 0.14 per m3.
4 Conclusions
CF-UGF is a relatively new technology that has been applied in a few cases with rapid
15
sand filtration. In this study CF-UGF has been used in combination with MSF technol-ogy comprising UGF and SSF. This study shows that combining CF-UGF with MSF greatly contributed to the removal efficiency of the system without negatively affecting the biological activity of the treatment system in terms of the efficiency of microorgan-ism removal in the UGF and SSF when coagulant was dosed. This strongly contributes
20
to the operational flexibility of the system as it allows to dose coagulant only when high influent turbidity peaks occur.
CF-UGF improved the operation of MSF compared to only UGF, when the system operated with turbidity levels above 30 NTU, facilitating the performance of the SSF by reducing the load of particulate material to avoid short filter runs and possible
inter-25
DWESD
5, 291–332, 2012Low-cost multi-stage filtration
L. D. S ´anchez et al.
Title Page
Abstract Introduction
Conclusions References
Tables Figures
◭ ◮
◭ ◮
Back Close
Full Screen / Esc
Printer-friendly Version Interactive Discussion
Discussion
P
a
per
|
Dis
cussion
P
a
per
|
Discussion
P
a
per
|
Discussio
n
P
a
per
|
with coagulant dosing was between 85 and 96 %, which is higher compared to opera-tion without coagulant dosing; average efficiency of turbidity in the CF-UGF was 46 %, ranging between 21–76 %. The addition of coagulant in the CF-UGF allowed for obtain-ing water with turbidity levels below 10 NTU after UGF, which contribute to the effective operation of the SSF. The overall system produced water with turbidity below 1 NTU for
5
98 % of the samples that were taken in the research period. In the operation with coag-ulant the removal efficiency for total coliforms,E-coli and HPC, was 2.75, 2.5 and 2.6 higher respectively compared to the operation without coagulant in the CF-UGF and UGF units. No reduction was observed in the microbial removal efficiency of the SSF, no obstruction of the SSF beds were demonstrated and SSF runs were maintained
10
between 50 and 70 days for a maximum head loss of 0.70 m.
The hydraulic behaviour of CF-UGF indicated that the system worked with a plug flow fraction of 51 %, a mixed fraction of 46 % and a dead zone fraction of 3 %. The comparison between the theoretical model and experimental data indicated that hy-draulic behaviour of the reactor CF-UGF tends ton=6 reactors in series, confirming
15
the presence of a relative plug flow. The mean residence time was 19.7 min for the operating flow of for the flow of 3 l s−1; theoretical retention time was 19 min.
It was only necessary to operate the system with coagulant for 20 % of the time. The CF-UGF run time was 6–100 h depending on raw water turbidity. In the operation without coagulant, the run time for the CF-UGF and UGF was 8 days. Whereas the
de-20
signed drainage flow was established at 20 m h−1in practice this level was not reached
and the real flow according to the measurements in the units was about 9 m h−1
indi-cating that more research is needed on the effect of the drainage system during the cleaning operation.
The CF-UGF unit represented only 7 % of the total construction costs, and the
pre-25
DWESD
5, 291–332, 2012Low-cost multi-stage filtration
L. D. S ´anchez et al.
Title Page
Abstract Introduction
Conclusions References
Tables Figures
◭ ◮
◭ ◮
Back Close
Full Screen / Esc
Printer-friendly Version Interactive Discussion
Discussion
P
a
per
|
Dis
cussion
P
a
per
|
Discussion
P
a
per
|
Discussio
n
P
a
per
|
O&M costs. The production cost was US $ 0.264 m−3 for the operation with pumping.
In a gravity system the cost is reduced to US $ 0.14 per m3.
Acknowledgements. The authors acknowledge the support and trust received for the
construc-tion and evaluaconstruc-tion system of the community and the governing board of Arroyo Hondo. The fieldwork was supported by Carlos Mejia (FHIS, IRC-YZ program) and Diana Posso (Sanitary
5
Engineer program, Univalle) and plant operators Alfonso Escand ´on and Eulogio M ´osquera. The financial support received by Cinara Institute, Universidad del Valle, research group in water supply, through of research station in Puerto Mallarino.
References
Ahsan, T.: Process Analysis and Optimization of Direct Horizontal – Flow Roughing Filtration,
10
Ph.D. thesis, Delft University of Technology, A.A. Balkema De, Rotterdam, The Netherlands, 193 pp., 1995.
APHA, AWWA, and WPCF: Standard Methods for the examination of water and wastewater, USA, 21a Edn., 2005.
Attakoya, A., Prasad, V. S., and Nagaraja, S. V.: Performance study of granulated flocculators,
15
Indian Jour. Evir. HLTH., 33, 498–504, 1991.
Bates, B. C., Kundzewicz, Z. W., Wu, S., and Palutikof, J. P. (Eds.): El Cambio Clim ´atico y el Agua, Documento t ´ecnico del Grupo Intergubernamental de Expertos sobre el Cambio Clim ´atico, Secretar´ıa del IPCC, Geneva, 224 pp., 2008.
Bhole, A. G.: Design and fabrication of a low cost water treatment plant for rural areas in India,
20
Aqua, 5, 315–320, 1981.
Burganos, V. N., Paraskeva, C. A., Christofides, P. D., and Payatakes, A. C.: Motion and depo-sition of non-Brownian particles in upflow collectors, Sep. Technol., 4, 47–54, 1994.
Castro, M. L. and P ´erez, J.: Procesos unitarios-ensayos de laboratorio, Programa regional OPS/EHP/CEPIS de mejoramiento de la calidad de agua para consumo humano, April, 61
25
pp., 1981.
DWESD
5, 291–332, 2012Low-cost multi-stage filtration
L. D. S ´anchez et al.
Title Page
Abstract Introduction
Conclusions References
Tables Figures
◭ ◮
◭ ◮
Back Close
Full Screen / Esc
Printer-friendly Version Interactive Discussion
Discussion
P
a
per
|
Dis
cussion
P
a
per
|
Discussion
P
a
per
|
Discussio
n
P
a
per
|
Cinara and International Development Research Centre, IDRC: Proyecto limpieza hidr ´aulica de filtros gruesos, Final report, Cali, Colombia, 110 pp., 1993.
Cinara and IRC: Potencial de la filtraci ´on gruesa en m ´ultiples etapas (FiGME) en la opti-mizaci ´on de plantas de tratamiento con filtraci ´on r ´apida de agua qu´ımicamente coagulada, Cali, Colombia, 1996.
5
CGR, Contralor´ıa General de la Rep ´ublica: Estado de los Recursos Naturales y del Ambiente, Rep ´ublica de Colombia, 180 pp., 2009.
Cleasby, J. L.: Source Water Quality and pretreatment option for slow sand filters, Chapter 3, in: Task committee on slow sand filters, New York, USA, 1991.
Di Bernardo, L.: Metodos e T ´ecnicas de Tratamiento de Agua, Vol. I, ABES, Rio de Janeiro,
10
Brasil, 481 pp., 1993.
Di Bernardo, L. and Cruz, C. H.: Influencia de altas tasas de filtraci ´on en el desempe ˜no de sistemas de filtraci ´on directa ascendente, in: proceeding of XXIV Interamerican Congress of Ingenier´ıa Sanitaria y Ambiental, Buenos Aires, Argentina, 1994.
Di Bernardo, L. and Sabogal, L. P.: Selec¸ ˜ao de tecnologias de tratamento de ´agua, Editora
15
LDIBE LTDA, Sao Carlos Brasil, I, 878 pp., 2009.
Dinoy, A. A.: Friction Factor and Reynolds Number Relationship in Flow through Porous Media, ME Thesis, AIT, Bangkok, Thailand, 1971.
Dorea, C. C. and Clarke, B. A.: Impact of chemical pretreatment in Slow Sand Filtration, in: proceeding of Recent progress in slow sand and alternative biofiltration processes, IWA
pub-20
lishing, 215–223, 2006.
Ergun, S.: Fluid Flow Through Packed Colum, Chem. Eng. Prog., 48, 2, 89–94, 1952.
Fair, G. M., Geyer, J. C., and Okun, D. A.: Purificaci ´on de aguas y tratamiento y remoci ´on de aguas residuales, Fifth reprint, Editorial Limusa Mexico, Vol II, 764 pp., 1984.
Galvis, G.: Development and evaluation of multistage filtration plants; an innovative, robust and
25
efficient water treatment technology, Ph.D. thesis, Guilford, UK, CEHE, University of Surrey, 228 pp., 1999.
Galvis, G. and Visscher, J. T.: Multi-stage filtration a life-saving technology, in: proceeding of the First International Symposium Technology, Operations and Economics of Providing Safe, Drinking Water in Small Systems, Washington, DC, USA, 10–13 May 1998.
30
DWESD
5, 291–332, 2012Low-cost multi-stage filtration
L. D. S ´anchez et al.
Title Page
Abstract Introduction
Conclusions References
Tables Figures
◭ ◮
◭ ◮
Back Close
Full Screen / Esc
Printer-friendly Version Interactive Discussion
Discussion
P
a
per
|
Dis
cussion
P
a
per
|
Discussion
P
a
per
|
Discussio
n
P
a
per
|
International water and sanitation centre, IRC, The Netherlands, UNESCO, united nations office for science and culture, 197 pp., 1999.
Ives, K. J.: Testing of filter media, J. Water SRT, Aqua, 39, 144–151, 1990.
Kardile, J. L.: Development of simple and economic filtration methods for rural water supplies, Aqua-Fenicca, 1, 226–229, 1981.
5
Kawamura, S.: Two stage filtration, J. AWWA, 77, 42–47, 1985.
Lloyd, B. and Helmer, R.: Vigilancia y control de la calidad del agua para consumo humano en la zona rural, Published for the WHO and UNEP by Logman Scientific and Technical, 1991. Ministerio de Desarrollo: Inventario nacional del sector de agua potable y saneamiento b ´asico,
Vol. I, Infraestructura f´ısica de los sistemas, Ministerio de Desarrollo Econ ´omico,
Viceminis-10
terio de Desarrollo Urbano, Direcci ´on de servicios p ´ublicos domiciliarios, Colombia, 13–67, 1998.
P ´erez, J. and Galvis, G.: An ´alisis de flujos y factores que determinan los periodos de retenci ´on, Centro de Ingenier´ıa Sanitaria y Ciencias del Ambiente, CEPIS, Organizaci ´on Panamericana de la Salud, OPS Vol. II, 112 pp., 1990.
15
Richter, C.: Sistemas simplificados de floculaci ´on, in: Proceeding of Seminario Internacional so-bre Tecnolog´ıa Apropiada para Potabilizaci ´on del Agua, ACODAL, seccional Valle del Cauca, Cali, Colombia, August 1987.
Richter, C. A. and Moreira, B. R.: Floculadores de Pedras. Experiencia en Filtro Piloto, Reporte interno Sanepar, Parana, Brasil, 1981.
20
Rocha, M. A., Normando, H., and Onofre, C.: Aplic¸ ˜ao de tracadores em filtros anaer ´obicos para avaliac¸ ˜ao das caracter´ısticas hidrodin ´amicas, in: Proceeding of XXVII Congresso Inter-americano de EngenhariaSanit ´aria e Ambiental, Porto Alegre, Brasil, Associac¸ ˜ao Brasileira de Engenharia Sanit ´aria e Ambiental – Regi ˜ao Rio Grande do Sul (ABES/RS), 2000. Salazar, M. and Ocampo, J.: Estudio sobre la eficiencia hidr ´aulica y remoci ´on de material
25
suspendido en clarificadores ascendentes de gravas estratificadas, Universidad del Valle, Cali, Colombia, 1999.
S ´anchez, L. D. and Galvis, G.: Tecnolog´ıas en abastecimiento de agua para peque ˜nos sistemas de suministro de agua, in: Proceeding of the international conference AGUA 1998, Instituto Cinara, Cali, Colombia, 1998.
30
DWESD
5, 291–332, 2012Low-cost multi-stage filtration
L. D. S ´anchez et al.
Title Page
Abstract Introduction
Conclusions References
Tables Figures
◭ ◮
◭ ◮
Back Close
Full Screen / Esc
Printer-friendly Version Interactive Discussion
Discussion
P
a
per
|
Dis
cussion
P
a
per
|
Discussion
P
a
per
|
Discussio
n
P
a
per
|
Schulz, C. R. and Okun, D. A.: Surface water treatment for communities in developing countries, John Wiley & Sons, New York, 299 pp., 1984.
WHO: Guidelines for Drinking Water Quality, World Health Organization, WHO library, 4 Edn., 564 pp., 2011.
Wolters, H.: Roughing Filtration a Literature Study, MSc Thesis Report, TU Delft, 173 pp., 1988.
5
DWESD
5, 291–332, 2012Low-cost multi-stage filtration
L. D. S ´anchez et al.
Title Page
Abstract Introduction
Conclusions References
Tables Figures
◭ ◮
◭ ◮
Back Close
Full Screen / Esc
Printer-friendly Version Interactive Discussion
Discussion
P
a
per
|
Dis
cussion
P
a
per
|
Discussion
P
a
per
|
Discussio
n
P
a
per
|
Table 1.Parameters and formulae.
Parameter Formulae Value
RMC
Length to the mixing point Lm=1+0.5hv(Pv/hv)
0.54(1) 0.17 m
Velocity gradient for rapid mixing
G=(γEp/µTm) 0.5
(2) 1282 s−1
Average mixing time (Tm) Tm=Lr/Vap(3) 0.31 s CF-UGF
Average velocity gradient CF-UGF (Di Bernardo, 1993)
G=
r
(γ)(Vap)(Jmg)
(µ)(ǫo) (4) 28.5–3.1 s
−1
Unit head loss in the porous medium (Ergun, 1952 and Di Bernardo, 1993)
J=150v(1−ǫo)2(Vap) g(ǫo)3(Dmg)2 +
1.75(1−ǫo)(Vap)2
g(ǫo)3(Co)(Dmg) (5) 0.0016–0.0009 m m −1
Reynolds number in the porous medium (Dinoy, 1971)
R= ρxVfxk1/2
µ (6) 732–41
Where:Lr=hydraulic jump length;Lm=length between the base of the weir and the mixing point (m); hv=table of water over the weir (m);Pv=height of water from the base of the weir and fill up sheet of water
(m);Ep=loss of energy in the channel unit coagulation (m);Tm=average time of mixing (s);γ=specific
weight of water (N m−1);µ
=absolute viscosity (N m s−2);V
ap=approach velocity (m s−1);εo=porosity of
clean filter;J=loss of unit load (m m−1
),v=kinematic viscosity (m2s−1
).g=gravity constant (m s−2
), Co=coefficient of sphericity;Dmg=average grain size,ρ=density of water (kg m−3),Re
=Reynolds number, k=permeability (cm−1
DWESD
5, 291–332, 2012Low-cost multi-stage filtration
L. D. S ´anchez et al.
Title Page
Abstract Introduction
Conclusions References
Tables Figures
◭ ◮
◭ ◮
Back Close
Full Screen / Esc
Printer-friendly Version Interactive Discussion
Discussion
P
a
per
|
Dis
cussion
P
a
per
|
Discussion
P
a
per
|
Discussio
n
P
a
per
|
Table 2.Velocity gradients in the CF-UGF for the 2 flows of operation.
Filter media ε Dmg(m) Flow 3 l s−
1
Flow 6 l s−1
size mm Vap
(m s−1)
J
(m m−1) Gs−1 Re Vap (m s−1)
J
(m m−1) Gs−1 Re 31.7–19.0 0.31 0.0317 0.00375 0.0016 14.2 366 0.0075 0.0032 28.5 732
19.0–12.7 0.38 0.0191 0.0014 0.0007 5.3 124 0.0029 0.0015 11 257
12.7–9.5 0.40 0.0111 0.00075 0.0009 4.2 43 0.0015 0.0019 8.5 86
9.5–6.3 0.42 0.0079 0.00045 0.0009 3.1 20 0.0009 0.0018 6.3 41
T=22.8◦C,γ=9737 N m−1
,µ=9.44×10⁻⁴
N m s−2
;v=9.47×10⁻⁷
m2s−1
DWESD
5, 291–332, 2012Low-cost multi-stage filtration
L. D. S ´anchez et al.
Title Page
Abstract Introduction
Conclusions References
Tables Figures
◭ ◮
◭ ◮
Back Close
Full Screen / Esc
Printer-friendly Version Interactive Discussion
Discussion
P
a
per
|
Dis
cussion
P
a
per
|
Discussion
P
a
per
|
Discussio
n
P
a
per
|
Table 3.Treatment barriers and design parameters.
Criteria Treatment Stage
DRF RMC CF-UGF UGF SSF
Design period (years) 15 15 15 15 15
Operation time (h) 24 24 24 24 24
Number of units in parallel 2 1 2 2 4
Flow per unit (l s−1) 3 6 3 3 1.5
Filtration rate (m h−1) 3 3.2–27 0.9 0.30
Backwashing rate (m h−1
) 20 20 20
Area by unit (m2) 3.6 2.1 10.8 18
Gravel
Length (m) 0.6 1 1.1 0.2
Size (mm) 25.4–3.2 19–6.3 25.4–3.2 12.5
Sand
Length (m) – – – – 0.85
d10(mm) 0.15–0.35
DWESD
5, 291–332, 2012Low-cost multi-stage filtration
L. D. S ´anchez et al.
Title Page
Abstract Introduction
Conclusions References
Tables Figures
◭ ◮
◭ ◮
Back Close
Full Screen / Esc
Printer-friendly Version Interactive Discussion
Discussion
P
a
per
|
Dis
cussion
P
a
per
|
Discussion
P
a
per
|
Discussio
n
P
a
per
|
Table 4.Dimensions of each barrier.
Treatment barrier Number of Dimensions Flow Material
units L(m) A(m) H (m) (l s−1) structure
Input chamber 1 5.15 0.6 0.7 6.0 Concrete
DRF 2 4.0 0.9 0.8 3.0 Concrete
RMC 1 2.2 0.4 0.5–0.7 6.0 Concrete
CF-UGF∗ 2 2.0 2.0 1.4 3.0 Concrete
UGF 2 3.8 2.8 1.3 3.0 Concrete
SSF 4 3.7 4.7 1.75 1.5 Concrete
L: length;A: width;H: depth;∗Bottom Area: 0.16 m2
DWESD
5, 291–332, 2012Low-cost multi-stage filtration
L. D. S ´anchez et al.
Title Page
Abstract Introduction
Conclusions References
Tables Figures
◭ ◮
◭ ◮
Back Close
Full Screen / Esc
Printer-friendly Version Interactive Discussion
Discussion
P
a
per
|
Dis
cussion
P
a
per
|
Discussion
P
a
per
|
Discussio
n
P
a
per
|
Table 5.Water quality parameters and analysis method.
Parameters Method Limit of detection
Total coliform 9222B, filtration×membrane 0
E-coli 9222B, filtration×membrane 0
HPC 9215A, discharge in plate 0
Turbidity 2130B 0.1
Aluminium 3500-Al B 0.03
pH 4500 H+ 2
True colour 2120C 1
TOC 5310 B 0.18
DWESD
5, 291–332, 2012Low-cost multi-stage filtration
L. D. S ´anchez et al.
Title Page
Abstract Introduction
Conclusions References
Tables Figures
◭ ◮
◭ ◮
Back Close
Full Screen / Esc
Printer-friendly Version Interactive Discussion
Discussion
P
a
per
|
Dis
cussion
P
a
per
|
Discussion
P
a
per
|
Discussio
n
P
a
per
|
Table 6.Procedure for the jar tests.
Test Dose (mg l−1
) Coagulation time Slow mixing Slow mixing Sedimentation
(s) gradient (rpm) time (min) time (min)
1 10 20 30 40 50 60 60 40 25 15
2 3 7 10 13 17 20 60 40 25 15
3 Optimal test 1 10 20 30 40 50 60 40 25 15
4 Optimal test 2 10 20 30 40 50 60 40 25 15
5 Optimal test 1 Optimal test 3 20 5 10 20 25 30 40 15
6 Optimal test 2 Optimal test 4 30 5 10 20 25 30 40 15
7 Optimal test 1 Optimal test 3 40 5 10 20 25 30 40 15
8 Optimal test 2 Optimal test 4 50 5 10 20 25 30 40 15
DWESD
5, 291–332, 2012Low-cost multi-stage filtration
L. D. S ´anchez et al.
Title Page
Abstract Introduction
Conclusions References
Tables Figures
◭ ◮
◭ ◮
Back Close
Full Screen / Esc
Printer-friendly Version Interactive Discussion
Discussion
P
a
per
|
Dis
cussion
P
a
per
|
Discussion
P
a
per
|
Discussio
n
P
a
per
|
Table 7.Microbiological behaviour without the use of coagulant (UGF: Vf=0.9 m h−1
, SSF: Vf=0.30 m h−
1 ).
Descriptive statistics Raw water CF-UGF and UGF effluent SSF effluent
TC EC HPC TC EC HPC TC EC HPC
No data 9 9 7 9 9 7 10 10 9
Average 15 131 2262 202 629 12 227 2161 139 625 12 0 744
Maximum 25 000 3600 403 500 19 400 6700 272 000 68 0 1900
Minimum 8000 1250 120 000 6100 800 73 000 2 0 100
STD deviation 6733 914 123 549 5893 1859 80 237 19.7 0 651.6
Average log removal units 0.16 0.16 0.17 3.3 3.2 2.3
TC: Total coliforms (CFU (100 ml)−1) EC:E-coli(CFU (100 ml)−1) HPC: heterotrophic play count bacteria (CFU
(100 ml)−1
), operational flow 6 l s−1
DWESD
5, 291–332, 2012Low-cost multi-stage filtration
L. D. S ´anchez et al.
Title Page
Abstract Introduction
Conclusions References
Tables Figures
◭ ◮
◭ ◮
Back Close
Full Screen / Esc
Printer-friendly Version Interactive Discussion
Discussion
P
a
per
|
Dis
cussion
P
a
per
|
Discussion
P
a
per
|
Discussio
n
P
a
per
|
Table 8. Microbiological behaviour with the use of coagulant (UGF: Vf 0.9 m h−
1 , SSF: Vf0.3 m h−
1 ).
Descriptive statistics Raw water CF-UGF and UGF effluent SSF effluent
TC EC HPC TC EC HPC TC EC HPC
No data 5 5 5 5 5 5 5 5 5
Average 13 240 2780 110 740 6070 1125 41 100 2.8 0 540
Maximum 16 050 5600 160 000 10 100 2150 47 100 4 0 800
Minimum 8900 1200 79 300 3900 1000 35 000 1 0 200
STD deviation 2746 1684 31 494 2402 465 5290 1.3 0 219
Average log CFU 100−1ml−1 0.44 0.40 0.44 3.4 3.1 3.9
removal units
TC: Total coliforms (CFU (100 ml)−1
) EC:Eschirichia coli(CFU (100 ml)−1
DWESD
5, 291–332, 2012Low-cost multi-stage filtration
L. D. S ´anchez et al.
Title Page
Abstract Introduction
Conclusions References
Tables Figures
◭ ◮
◭ ◮
Back Close
Full Screen / Esc
Printer-friendly Version Interactive Discussion
Discussion
P
a
per
|
Dis
cussion
P
a
per
|
Discussion
P
a
per
|
Discussio
n
P
a
per
|
Table 9.Summary of operating and monitoring conditions.
Variable Value
Operational parameters
Influent turbidity for coagulant dosing >30 NTU Maximum turbidity of operation Normally 100 NTU,
sometimes can operate with peaks above 100 NTU for short periods of time (4–6 h). Cleaning period CF-UGF and UGF,
operation without coagulant.
Each 8 days
Time cleaning of CF-UGF 15 min
Time cleaning of UGF 45 min
Monitoring parameters
Coagulant used Liquid aluminium
sulphate, type A, 50 % concentration Filtration run of the CFUGF with application of coagulant 6–100 h
Percentage of time with coagulant dosage 20 % yr Percentage of operating time without coagulant 80 % yr Maximum period of time recorded dosing coagulant 100 h Maximum duration of registered plant shutdown 24 h Percentage of stops in the year 3 % Maximum head loss in CF-UGF units 20 cm Maximum head loss in UGF units 15 cm
Maximum backwashing rate CF-UGF 9.1 to 7.5 m h−1
DWESD
5, 291–332, 2012Low-cost multi-stage filtration
L. D. S ´anchez et al.
Title Page
Abstract Introduction
Conclusions References
Tables Figures
◭ ◮
◭ ◮
Back Close
Full Screen / Esc
Printer-friendly Version Interactive Discussion
Discussion
P
a
per
|
Dis
cussion
P
a
per
|
Discussion
P
a
per
|
Discussio
n
P
a
per
|
Table 10.Initial investment costs.
Stage of treatment ∗Cost (US $) %
DRF 9821 16
CFUGF 4554 7
UGF 17 002 28
SSF 29 783 49
Total cost (US $)∗ 61 160
Cost l s−1
(US $) 10 193
Per capita cost (US $) 18
DWESD
5, 291–332, 2012Low-cost multi-stage filtration
L. D. S ´anchez et al.
Title Page
Abstract Introduction
Conclusions References
Tables Figures
◭ ◮
◭ ◮
Back Close
Full Screen / Esc
Printer-friendly Version Interactive Discussion
Discussion
P
a
per
|
Dis
cussion
P
a
per
|
Discussion
P
a
per
|
Discussio
n
P
a
per
|
Table 11.Operation and maintenance costs.
Item Monthly cost (US $) %
Cost of coagulant (aluminium sulphate) 13 0.3
Cost of the chlorine 365 9.5
Staffcosts (including benefits and social security) 1399 36.4
Electrical energy costs 1661 43.3
Costs of materials and equipment 249 6.5
Costs for water quality analysis 155 4
Total monthly cost O&M (US $) 3842 O&M costs per m3produced (US $ m−3
) 0.25