EURASIAN JOURNAL OF ECONOMICS AND FINANCE
http://www.eurasianpublications.com
BID-ASK SPREADS, TRADING VOLUME AND RETURN VOLATILITY:
INTRADAY EVIDENCE FROM INDIAN STOCK MARKET
Rashmi Ranjan Paital
Corresponding Author: University of Hyderabad, India. Email: [email protected]
Naresh Kumar Sharma
University of Hyderabad, India. Email: [email protected]
Abstract
This paper empirically examines the relationship between stock return volatility, trading volume and bid-ask spread within the scope of mixture of distribution hypothesis (MDH) and sequential information arrival hypothesis (SIAH) in the Indian stock market using high frequency 5-minute data set over the period of 2 July 2012 to 31 December 2012. This is the first kind of study in India using bid-ask spread as an additional information variable along with trading volume to investigate the relationship with stock return volatility. Our empirical findings provide evidence of a positive contemporaneous relationship between return volatility and trading volume, and also between return volatility and bid-ask spread. Moreover, the results of Granger causality test show that the information content of trading volume and bid-ask spread are useful for predicting stock return volatility. Our results indicate that information arrival to investors tends to follow a sequential rather than a simultaneous process. This finding is consistent with the sequential information arrival hypothesis and contradicts the mixture of distribution hypothesis.
Keywords: Intraday, Volatility, Trading Volume, Bid-Ask Spread, Granger Causality, MDH, SIAH
1. Introduction
The relationship between stock return volatility and trading volume has been the matter of subject for several empirical studies over the past years. The major inspiration for these studies is the central role played by trading volume in the pricing of financial assets through the arrival of new information. It has been proposed that there exists a positive contemporaneous relationship between return volatility and trading volume in financial markets. At the theoretical level, the existence of such a positive relationship explained mainly by two major underlying hypotheses; the mixture of distribution hypothesis (MDH) and the sequential information arrival hypothesis (SIAH).
25
simultaneously to all the traders. The implication is that, with simultaneous information arrival there is no information in the past volume that can be used in forecasting future volatility that are not yet contained in the past volatility. Hence, the mixture of distribution hypothesis supports only positive contemporaneous relationship but no causal linkage between trading volume and return volatility.
The sequential information arrival hypothesis (SIAH) proposed by Copeland (1976) and discussed further in Jennings et al. (1981) suggest that the new information is disseminated sequentially rather than simultaneously to all the traders. In these models, some trader observes the information ahead of the market and trade on it, thereby creating volume and volatility. As a result, volume and volatility move in same direction. Hence, there is a positive contemporaneous relationship exists between volatility and volume. Smirlock and Starks (1988) have further extended the hypothesis that as the information comes sequentially, the past values of trading volume may have the ability to predict future volatility and vice versa, which means that a causal relationship may exist in either directions between volatility and volume.
The contemporaneous and causal relationship between stock return volatility and trading volume has also been the subject of a substantial stream of empirical studies. Lee and Rui (2002) found evidence of a positive contemporaneous as well as a feedback relationship between trading volume and volatility in US, UK and Japanese markets. Leon (2007) found that trading volume had predictive power for stock return volatility in the regional stock exchange of the West African Economic and Monetary Union. Khan and Rizwan (2008) examined the relationship between return volatility and trading volume in Pakistan’s stock market and found a positive contemporaneous relationship between them. At the same time they observed that there exists a bidirectional causal relationship between volatility and volume. Medeiros and Doornik (2008) found the support for a positive contemporaneous as well as bidirectional causal relationship between return volatility and trading volume in Brazilian stock market. Mahajan and Singh (2009) traced a positive contemporaneous relationship between return volatility and trading volume in the Indian stock market. Their study also provided evidence of one-way causality from volatility to trading volume. Thammasiri and Pattarathammas (2010) found a positive contemporaneous relationship between return volatility and trading volume in TFEX market, however, no causal relation from trading volume to return volatility was established. Tripathy (2011) examined the Indian market and found a positive contemporaneous as well as bidirectional causal relationship between return volatility and trading volume. Chuang et al. (2012) studied the Asian markets and found evidence of a positive contemporaneous relationship for 6 out of 10 markets. Their study also provided some evidence of bidirectional causal relationship for 8 out of 10 markets. And a significant causality running from volatility to
volume was detected only for China. They didn’t find any causal effect for Thailand. Choi and Kang (2013) found a positive volume-volatility relationship for four Asian markets: Korea, Japan, China and Hong-Kong. Their study found volume causes volatility in cases of Hong-Kong, China and Japan whereas volatility causes volume in cases of Hong-Kong, China and Korean market. Celik (2013) also found evidence of a positive relationship between volatility and volume in Istanbul stock market both in pre-crisis and post-crisis periods whereas bidirectional causality was traced in post-crisis period and in pre-crisis period no causality was established.
Research on market microstructure also focused in explaining and exploring bid-ask spread and its relationship with price changes and volatility. In the literature it is widely documented that intraday variations of bid-ask spread and intraday return volatility are expected to be positively correlated because an information arrival is supposed to stimulate an increase in volatility which in turn widens the bid-ask spread (Copeland and Galai, 1983; Glosten and Milgrom, 1985; Richardson, 2000; Wang and Yau, 2000; Rahman et al. 2002).
26
A considerable amount of effort has made, empirically and theoretically, to understand the relationship between stock return volatility and trading volume. Although the majority of the findings have confirmed the existence of a positive contemporaneous relationship between return volatility and trading volume, the studies of different stock markets have given mixed results about the causal relationship. Similarly in the context of India, Tripathy (2011) found the evidence of causality from volume to volatility whereas Mahajan and Singh (2009) did not trace any causal relationship from volume to volatility. Interestingly enough none of the studies in India focused on intraday relationship. Similarly, spread-volatility relation has not been explored widely and thus the relationship is unclear. Particularly in Indian context, there is relatively a dearth of research on this aspect. Therefore, in the present study, we made an attempt to empirically investigate the intraday contemporaneous as well as the causal relationship between return volatility, trading volume and bid-ask spread for 50 stocks of S&P CNX NIFTY index to bridge this research gap.
2. Data and Variables Description
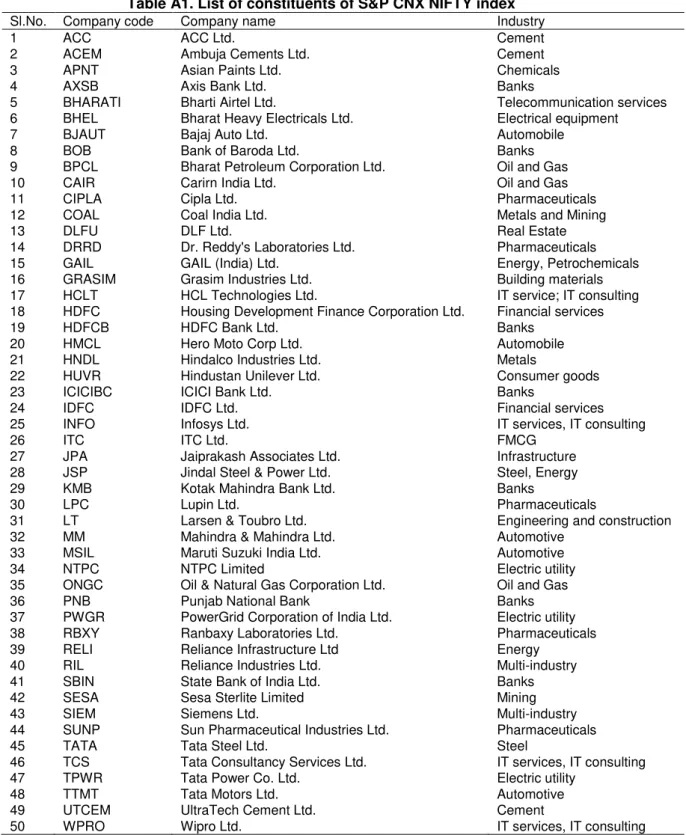
Our primary data set consists of transaction price, trading volume, and the close bid and ask quote for each 5-minute intervals from 2 July 2012 to 31 December 2012 for all the stocks of S&P CNX Nifty Index between trading timing 09:15 am to 15:30 pm IST. S&P CNX Nifty Index is a well diversified 50 stock index accounting for 25 sectors of the Indian economy. Table A1 provides the list of companies and their industry type. All the data are obtained electronically from Bloomberg terminal.
Stock return volatility, trading volume and bid-ask spread are relevant for this study. The percentage return of the stock is defined as = log 𝑃 𝑃−1 ∗100, where is the logarithmic
percentage return at time t and 𝑃 represents current 5 minutes interval trading price and 𝑃−1 is
the trading price for immediately preceding five minutes interval. Following Leon (2007), Medeiros and Doornik (2008) and Tripathy (2011), squared return ( 2) is used as measures of price volatility.
Following Wei (1991), Abhyankar et al. (1997) and Hussain (2011), the 5-minute proportional bid-ask spreads are calculated as = − /[( + )/2].
Next, the trading volume is the total number of shares traded at each five minute interval. Following Tian and Guo (2007) and Al-Jafari and Tliti (2013), the study uses logarithmic value of volume instead of raw volume to improve the normality properties of the series.
3. Methodology 3.1. Unit Root Test
To avoid spurious relation in time series model, the study adopts a test for a unit root to ensure that each variable is stationary. The unit root test is carried out by using Augmented Dickey-Fuller (ADF) and Phillips-Perron (PP) Test.
3.2. Contemporaneous Relationship
The contemporaneous relationship between return volatility and trading volume and between return volatility and bid-ask spread have been investigated using the following OLS regression equations respectively.
2=
1+ 1𝑉 + 1 (1)
2=
2+ 2 + 2 (2)
where, 2, 𝑉 and are return volatility, trading volume and spread respectively at time
t. The estimated parameter 1 in equation (1) measures the contemporaneous relationship
27
volume. Similarly, 2 in equation (2) measures the contemporaneous relationship between return volatility and spread.
3.3. Causal Relationship
Our study covers not only the contemporaneous but also the causal relationship. Based on sequential information arrival hypothesis (SIAH) we test whether the information content of trading volume and bid-ask spread are useful for predicting stock return volatility. The pair wise causality between return volatility and trading volume has been checked through Granger causality test (Granger, 1969) by the following unrestricted equations:
2=
1+ 𝑝=1 2− + 𝑉−
𝑝
=1 + 1 (3)
𝑉 = 2+ 𝑝=1𝜆 2− + 𝑝=1𝛿 𝑉− + 2 (4)
where, 2and 𝑉 are return volatility and trading volume respectively at time t.
1and 2
are intercepts, and , , 𝜆 and 𝛿 are parameters and 𝑝 denotes the lag length. We formulate the linear Granger causality restrictions as follows: If some of values are statistically not zero, then trading volume is said to granger cause return volatility, which is the main hypothesis of interest. Similarly if some of 𝜆 values are statistically not zero, then stock returns volatility are said to Granger cause volume. If both and 𝜆 are statistically significant then a feedback relationship is said to exist. The optimum lag length is selected based on Schwarz information criterion (SC). Similarly we checked the causality between stock return volatility and bid-ask spread.
4. Empirical Findings 4.1. Unit Root Test
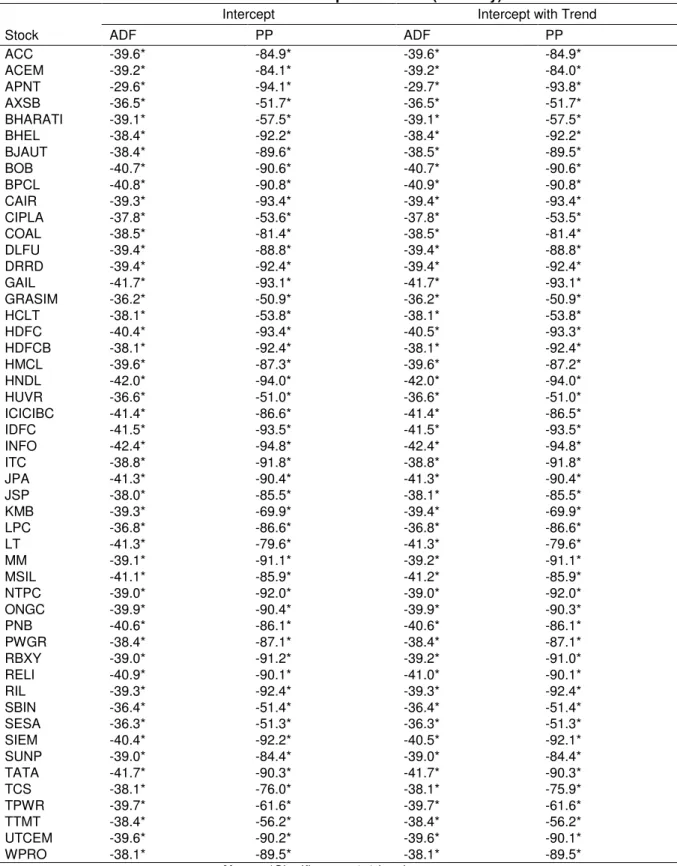
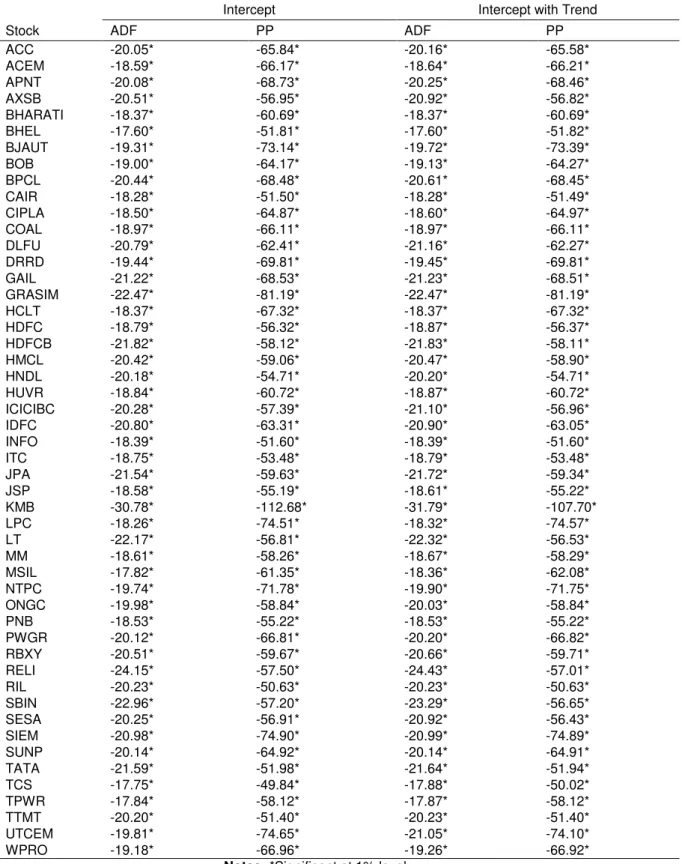
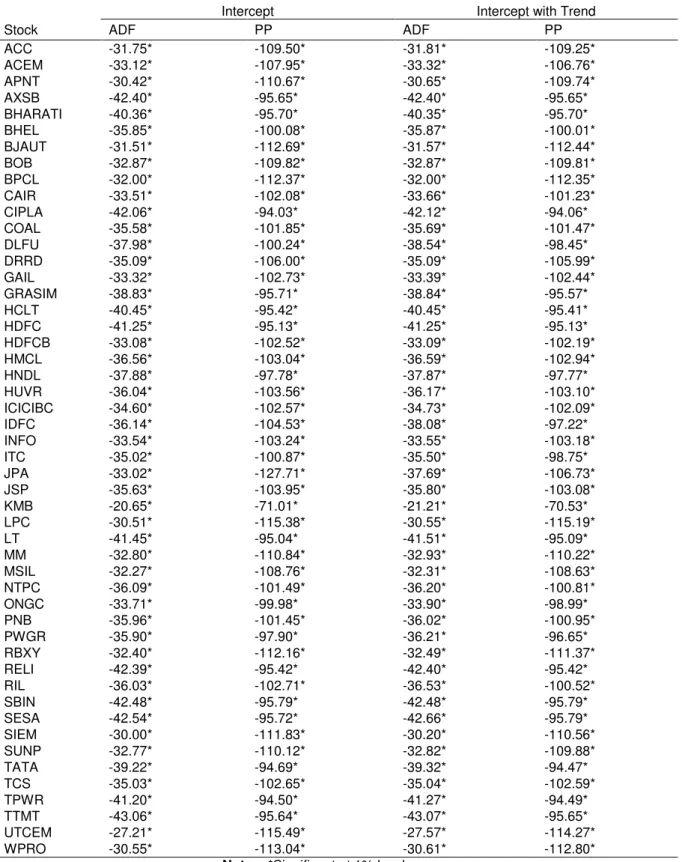
The ADF and PP test statistics are reported in Table A2, A3 and A4 respectively for return volatility (squared return), volume and spread. The results show that the null hypothesis that return volatility, trading volume and bid-ask spread are non-stationary (i.e. has a unit root) is rejected at 1% of level for all the series. This confirms that all the series are stationary for every one of the stocks and are therefore, suitable for further statistical analysis.
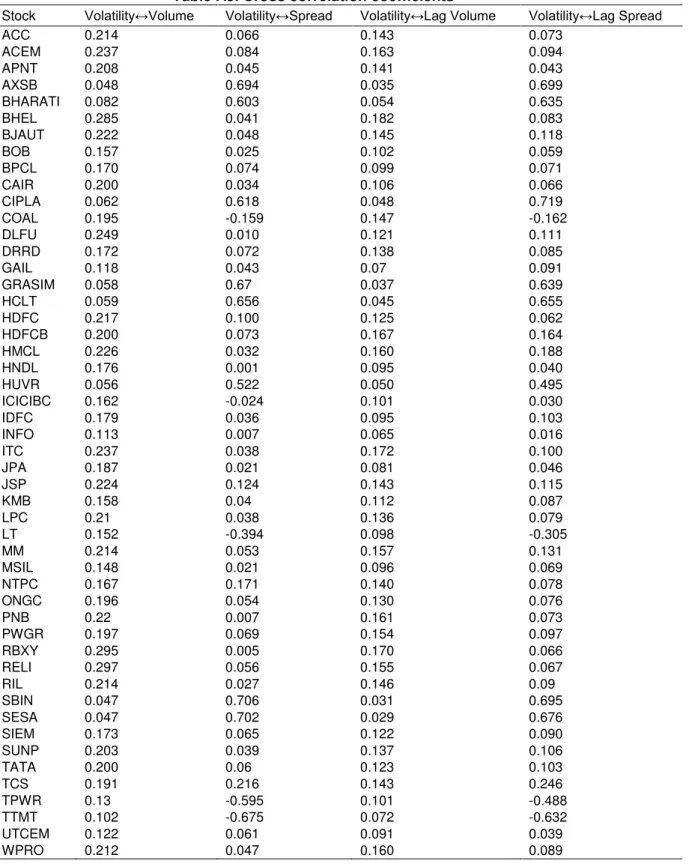
4.2. Cross-Correlation Analysis
As the first step, to investigate the relationship between volatility, volume and spread, we computed the cross-correlation coefficients for all the stocks. The correlation coefficients are reported in Table A5. We found return volatility is positively correlated with trading volume and lagged trading volume in case of all the 50 stocks. We also found positive correlation between return volatility and spread in case of 90% of the stocks except COAL, ICICIBC, LT, TPWR and TTMT. Similarly, return volatility is positively correlated with lagged spread in case of 92% of the stocks except COAL, LT, TPWR and TTMT. The lagged correlation gives an indication for causal relationship.
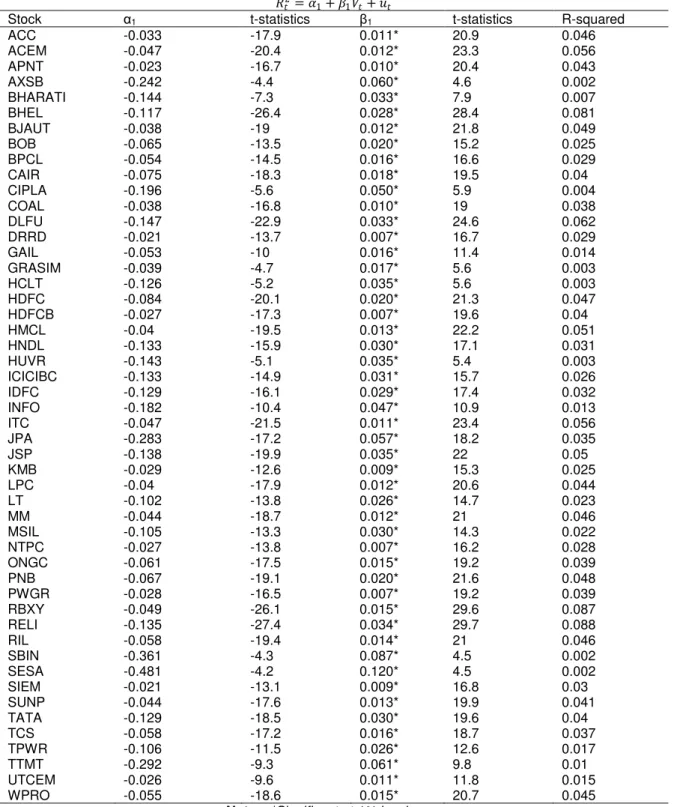
4.3. Contemporaneous Relationship between Volatility and Volume
The results of the OLS regression using equation 1 to explain the contemporaneous relationship between volatility and volume are reported in Table A6. The parameter 1, whichmeasures the
contemporaneous relationship between volatility and volume, is statistically significant and positive for all the 50 stocks, suggesting a positive contemporaneous relationship between return volatility and volume.
28
that, the Indian market is informationally inefficient. The information flow in market may well be disseminated sequentially instead of instantaneously as required in mixture distribution hypothesis (MDH). This relationship gives an indication of sequential information flow in Indian market.
4.4. Contemporaneous Relationship between Volatility and Spread
The results of the OLS regression using equation 2 to explain the contemporaneous relationship between volatility and spread are reported in Table A7. The parameter 2 is statistically
significant and positive for 40 stocks out of total 50, suggesting a positive contemporaneous relationship between return volatility and spread. We also found statistically significant negative
2for 5 stocks (COAL, ICICIBC, LT, TPWR and TTMT) and statistically insignificant relationship
for remaining 5 stocks (DLFU, HNDL, INFO, PNB and RBXY). Likewise volume, the contemporaneous spread also explains relatively a very small portion of volatility and gives an indication of sequential information flow in the market.
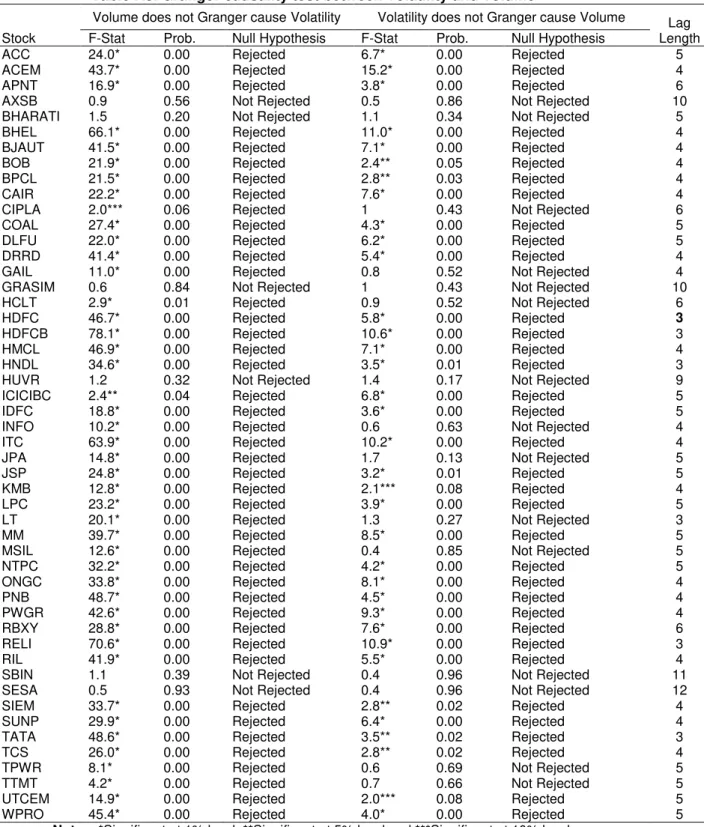
4.5. Causal Relationship between Volatility and Volume
The Granger causality test results between return volatility and trading volume are reported in Table A8. The lag lengths for the causality test are determined on the basis of Schwartz information criterion (SC) and the selected lag period for each stock are reported in the same table. The null hypothesis that lagged volume does not granger cause return volatility is rejected in case of 44 stocks except AXSB, BHARATI, GRASIM, HUVR, SBIN and SESA. On the other hand, the null hypothesis that the past volatility does not granger cause volume is rejected for 35 stocks out of 50. For all these 35 stocks, we also found feedback relationship. Only in case of AXSB, BHARATI, GRASIM, HUVR, SBIN and SESA, no causality was traced in either direction. The Granger causality results show that volume causes volatility and that the volatility also causes volume but in lesser number of cases. This finding implies that in the presence of current and past volatility, trading volume adds some significant predictive power for future return volatility.
4.6. Causal Relationship between Volatility and Spread
The Granger causality test results between return volatility and spread are reported in Table A9. The test results show that the null hypothesis that lagged spread does not granger cause volatility is rejected in case of 49 stocks except INFO, whereas, the null hypothesis that lagged volatility does not granger cause spread is rejected only for 24 stocks. For all these 24 stocks, we also found feedback relationship between them. Only in case of INFO, no causality was traced in either direction. This clearly indicates that in the presence of current and past volatility, spread adds some significant predictive power for future return volatility.
5. Summary and Conclusion
This study investigated the contemporaneous and causal relationship between return volatility, trading volume and bid-ask spread using 5-minutes interval high frequency data from 50 stocks of S&P CNX NIFTY Index over the period of 2 July 2012 to 31 December 2012.
The findings provide evidence of a positive contemporaneous relationship between return volatility and trading volume as well as between return volatility and spread. However, in both cases the explanatory power of this contemporaneous relation is weak. This indicate that, the Indian market is informationally inefficient and the information flow in market may well be disseminated sequentially instead of instantaneously as required in mixture distribution hypothesis (MDH).
29
future returns volatility by means of Granger causality test and found for majority of the cases, volume and spread caused return volatility.
The overall findings suggest that information arrival follows a sequential rather than a simultaneous process which contradicts the mixture of distribution hypothesis (MDH) and supports the sequential information arrival hypothesis (SIAH).
The past information of trading volume and bid-ask spread is useful to improve the prediction of future return volatility. The study suggests that regulators and market participants can use past information for monitoring the stock price movement in the market.
This study could help the marginal and uninformed traders who cannot afford the cost of information acquisition; they can keep a close eye on the movements of both volume and spread for their investment decisions. Especially, this study may help the intraday investors for making their trading strategy.
References
Abhyankar, A., Ghosh, D., Levin, E., and Limmack, R.J., 1997. Bid-ask spreads, trading volume and volatility: Intra-day evidence from the London stock exchange, Journal of Business Finance and Accounting, 24(3-4), pp.343-362.
http://dx.doi.org/10.1111/1468-5957.00108
Al-Jafari, M.K. and Tliti, A., 2013. An empirical investigation of the relationship between stock return and trading volume: Evidence from Jordanian banking sector. Journal of Applied Finance & Banking, 3(3), pp.45-64.
Bollerslev, T. and Melvin, M., 1994. Bid-ask spreads and volatility in the foreign exchange market: An empirical analysis. Journal of International Economics, 36, pp.355-372.
http://dx.doi.org/10.1016/0022-1996(94)90008-6
Celik, S., 2013. New evidence on the relation between trading volume and volatility. Business and Economic Research, 3(1), pp.176-186.
Choi, K.H. and Kang, S.H., 2013. Relationship between stock returns and trading volume: domestic and cross country evidence in Asian stock markets. In: R. Neck, ed. 2013. Recent advances in business administration, marketing and economics:Proceedings of the 2013 International Conference on Economics and Business Administration (BAME 2013). Venice: BAME. pp.33-39.
Chuang, W.I., Liu, H.H., and Susmel, R., 2012. The bivariate GARCH approach to investigating the relation between stock returns, trading volume, and return volatility. Global Finance Journal, 23(1), pp.1-15. http://dx.doi.org/10.1016/j.gfj.2012.01.001
Clark, P., 1973. A subordinated stochastic process model with finite variance for speculative prices. Econometrica, 41, pp.135-155. http://dx.doi.org/10.2307/1913889
Copeland, T. and Galai, D., 1983. Information effects on the bid-ask spread. Journal of Finance, 38, pp.1453-69. http://dx.doi.org/10.1111/j.1540-6261.1983.tb03834.x
Copeland, T.E., 1976. A model of asset trading under the assumption of sequential information arrival. Journal of Finance, 31, pp.1149-1168. http://dx.doi.org/10.2307/2326280 Ding, D. and Chong, B., 1997. Simex Nikkei futures spreads and their determinants. Advances
in Pacific Basin Financial Markets, 3, pp.39-53.
Epps, T.W. and Epps, M.L., 1976. The stochastic dependence of security price changes and transaction volumes: Implications for the mixture of distributions hypothesis. Econometrica, 44, pp.305-321. http://dx.doi.org/10.2307/1912726
Frank, J. and Garcia, P., 2011. Bid-ask spreads, volume, and volatility: Evidence from livestock markets. American Journal of Agricultural Economics, 93, pp.209-225.
http://dx.doi.org/10.1093/ajae/aaq116
Galati, G., 2000. Trading volumes, volatility and spreads in FX markets: Evidence from emerging market countries. BIS Working Papers, No.93, pp.197-229.
Glosten, L.R. and Milgrom, P.R., 1985. Bid-ask and transaction prices in a specialist market with heterogeneously informed traders. Journal of financial Economics, 14, pp.71-100.
30
Granger, C.W.J., 1969. Investigating causal relations by econometric models and cross-spectral methods. Econometrica, 37(3), pp.424-438. http://dx.doi.org/10.2307/1912791
Gtifa, S. and Liouane, N., 2013. Bid-ask spread, order size and volatility in the foreign exchange market: An empirical investigation. Journal of Business Management and Economics, 4(12), pp.267-275.
Harris, L., 1986. Cross-security tests of the mixture of distributions hypothesis. Journal of Financial and Quantitative Analysis, 21, pp.39-46. http://dx.doi.org/10.2307/2330989 Hussain, S.M., 2011. The intraday behaviour of bid-ask spreads, trading volume and return
volatility: Evidence from XDAS30. International Journal of Economics and Finance, 3(1), pp.23-34. http://dx.doi.org/10.5539/ijef.v3n1p23
Jennings, R. H., Starks, L.T., and Fellinggham, J.C., 1981. An equilibrium model of asset trading with sequential information arrival. Journal of Finance, 36, pp.143-161.
http://dx.doi.org/10.1111/j.1540-6261.1981.tb03540.x
Khan, S.U. and Rizwan, F., 2008. Trading volume and stock returns: Evidence from Pakistan’s stock market. International Review of Business Research Papers, 4(2), pp.151-162. Lee, B.S. and Rui, O.M., 2002. The dynamic relationship between stock returns and trading
volume: Domestic and cross country evidence. Journal of Banking and Finance, 26, pp.51-78. http://dx.doi.org/10.1016/S0378-4266(00)00173-4
Leon, N., 2007. An empirical study of the relation between stock return volatility and trading volume in the BRVM. African Journal of Business Management, 1(7), pp.176-184. Mahajan, S. and Singh, B., 2009. The empirical investigation of relationship between return,
volume and volatility dynamics in Indian market. Eurasian Journal of Business and Economics, 2(4), pp.113-37.
McGroarty, F., Gwilym, O., and Thomas, S., 2009. The role of private information in return volatility, bid-ask spreads and price levels in the foreign exchange market. Journal of International Financial Markets, Institutions & Money, 19(2), pp.387-401.
http://dx.doi.org/10.1016/j.intfin.2008.04.001
Medeiros, O. and Doornik, B.V., 2008. The empirical relationship between stock returns, return volatility and trading volume in the Brazilian stock Market. Brazilian Business Review, 5(1), pp.1-17. http://dx.doi.org/10.15728/bbr.2008.5.1.1
Rahman, S., Lee, C.F., and Ang, K.P., 2002. Intraday return volatility process: Evidence from NASDAQ stocks. Review of Quantitative Finance and Accounting, 19, pp.155-180.
http://dx.doi.org/10.1023/A:1020683012149
Richardson, V.J., 2000. Information asymmetry and earnings management: Some evidence. Review of Quantitative Finance and Accounting, 15, pp.325-247.
http://dx.doi.org/10.1023/A:1012098407706
Smirlock, M. and Starks, L., 1988. An empirical analysis of the stock price-volume relationship. Journal of Banking and Finance, 12, pp.31-41.
http://dx.doi.org/10.1016/0378-4266(88)90048-9
Tauchen, G.E. and Pitts, M., 1983. The price variability-volume relationship on speculative markets. Econometrica, 51, pp.485-505. http://dx.doi.org/10.2307/1912002
Thammasiri, S. and Pattarathammas, S., 2010. Trading volume and returns relationship in SET50 index futures. Chinese Business Review, 9(1), pp.11-23.
Tian, G.G. and Guo, M., 2007. Intraday and intraday volatility: Additional evidence from the Shanghai stock exchange. Review of Quantitative Finance & Accounting, 28, pp.287-306. http://dx.doi.org/10.1007/s11156-006-0011-x
Tripathy, N., 2011. The relation between price changes and trading volume: A study in Indian stock market. Interdisciplinary Journal of Research in Business, 1(7), pp.81-95.
Wang, G.H.K. and Yau, J., 2000. Trading volume, bid-ask spread, and price volatility in futures markets. Journal of Futures Markets, 20(10), pp.943-970.
http://dx.doi.org/10.1002/1096-9934(200011)20:10<943::AID-FUT4>3.0.CO;2-8
31
32
Appendix
Table A1. List of constituents of S&P CNX NIFTY index
Sl.No. Company code Company name Industry
1 ACC ACC Ltd. Cement
2 ACEM Ambuja Cements Ltd. Cement
3 APNT Asian Paints Ltd. Chemicals
4 AXSB Axis Bank Ltd. Banks
5 BHARATI Bharti Airtel Ltd. Telecommunication services
6 BHEL Bharat Heavy Electricals Ltd. Electrical equipment
7 BJAUT Bajaj Auto Ltd. Automobile
8 BOB Bank of Baroda Ltd. Banks
9 BPCL Bharat Petroleum Corporation Ltd. Oil and Gas
10 CAIR Carirn India Ltd. Oil and Gas
11 CIPLA Cipla Ltd. Pharmaceuticals
12 COAL Coal India Ltd. Metals and Mining
13 DLFU DLF Ltd. Real Estate
14 DRRD Dr. Reddy's Laboratories Ltd. Pharmaceuticals
15 GAIL GAIL (India) Ltd. Energy, Petrochemicals
16 GRASIM Grasim Industries Ltd. Building materials
17 HCLT HCL Technologies Ltd. IT service; IT consulting
18 HDFC Housing Development Finance Corporation Ltd. Financial services
19 HDFCB HDFC Bank Ltd. Banks
20 HMCL Hero Moto Corp Ltd. Automobile
21 HNDL Hindalco Industries Ltd. Metals
22 HUVR Hindustan Unilever Ltd. Consumer goods
23 ICICIBC ICICI Bank Ltd. Banks
24 IDFC IDFC Ltd. Financial services
25 INFO Infosys Ltd. IT services, IT consulting
26 ITC ITC Ltd. FMCG
27 JPA Jaiprakash Associates Ltd. Infrastructure
28 JSP Jindal Steel & Power Ltd. Steel, Energy
29 KMB Kotak Mahindra Bank Ltd. Banks
30 LPC Lupin Ltd. Pharmaceuticals
31 LT Larsen & Toubro Ltd. Engineering and construction
32 MM Mahindra & Mahindra Ltd. Automotive
33 MSIL Maruti Suzuki India Ltd. Automotive
34 NTPC NTPC Limited Electric utility
35 ONGC Oil & Natural Gas Corporation Ltd. Oil and Gas
36 PNB Punjab National Bank Banks
37 PWGR PowerGrid Corporation of India Ltd. Electric utility
38 RBXY Ranbaxy Laboratories Ltd. Pharmaceuticals
39 RELI Reliance Infrastructure Ltd Energy
40 RIL Reliance Industries Ltd. Multi-industry
41 SBIN State Bank of India Ltd. Banks
42 SESA Sesa Sterlite Limited Mining
43 SIEM Siemens Ltd. Multi-industry
44 SUNP Sun Pharmaceutical Industries Ltd. Pharmaceuticals
45 TATA Tata Steel Ltd. Steel
46 TCS Tata Consultancy Services Ltd. IT services, IT consulting
47 TPWR Tata Power Co. Ltd. Electric utility
48 TTMT Tata Motors Ltd. Automotive
49 UTCEM UltraTech Cement Ltd. Cement
33
Table A2. Unit root test for squared return (volatility)
Intercept Intercept with Trend
Stock ADF PP ADF PP
ACC -39.6* -84.9* -39.6* -84.9*
ACEM -39.2* -84.1* -39.2* -84.0*
APNT -29.6* -94.1* -29.7* -93.8*
AXSB -36.5* -51.7* -36.5* -51.7*
BHARATI -39.1* -57.5* -39.1* -57.5*
BHEL -38.4* -92.2* -38.4* -92.2*
BJAUT -38.4* -89.6* -38.5* -89.5*
BOB -40.7* -90.6* -40.7* -90.6*
BPCL -40.8* -90.8* -40.9* -90.8*
CAIR -39.3* -93.4* -39.4* -93.4*
CIPLA -37.8* -53.6* -37.8* -53.5*
COAL -38.5* -81.4* -38.5* -81.4*
DLFU -39.4* -88.8* -39.4* -88.8*
DRRD -39.4* -92.4* -39.4* -92.4*
GAIL -41.7* -93.1* -41.7* -93.1*
GRASIM -36.2* -50.9* -36.2* -50.9*
HCLT -38.1* -53.8* -38.1* -53.8*
HDFC -40.4* -93.4* -40.5* -93.3*
HDFCB -38.1* -92.4* -38.1* -92.4*
HMCL -39.6* -87.3* -39.6* -87.2*
HNDL -42.0* -94.0* -42.0* -94.0*
HUVR -36.6* -51.0* -36.6* -51.0*
ICICIBC -41.4* -86.6* -41.4* -86.5*
IDFC -41.5* -93.5* -41.5* -93.5*
INFO -42.4* -94.8* -42.4* -94.8*
ITC -38.8* -91.8* -38.8* -91.8*
JPA -41.3* -90.4* -41.3* -90.4*
JSP -38.0* -85.5* -38.1* -85.5*
KMB -39.3* -69.9* -39.4* -69.9*
LPC -36.8* -86.6* -36.8* -86.6*
LT -41.3* -79.6* -41.3* -79.6*
MM -39.1* -91.1* -39.2* -91.1*
MSIL -41.1* -85.9* -41.2* -85.9*
NTPC -39.0* -92.0* -39.0* -92.0*
ONGC -39.9* -90.4* -39.9* -90.3*
PNB -40.6* -86.1* -40.6* -86.1*
PWGR -38.4* -87.1* -38.4* -87.1*
RBXY -39.0* -91.2* -39.2* -91.0*
RELI -40.9* -90.1* -41.0* -90.1*
RIL -39.3* -92.4* -39.3* -92.4*
SBIN -36.4* -51.4* -36.4* -51.4*
SESA -36.3* -51.3* -36.3* -51.3*
SIEM -40.4* -92.2* -40.5* -92.1*
SUNP -39.0* -84.4* -39.0* -84.4*
TATA -41.7* -90.3* -41.7* -90.3*
TCS -38.1* -76.0* -38.1* -75.9*
TPWR -39.7* -61.6* -39.7* -61.6*
TTMT -38.4* -56.2* -38.4* -56.2*
UTCEM -39.6* -90.2* -39.6* -90.1*
WPRO -38.1* -89.5* -38.1* -89.5*
34
Table A3. Unit root test for trading volume
Intercept Intercept with Trend
Stock ADF PP ADF PP
ACC -20.05* -65.84* -20.16* -65.58*
ACEM -18.59* -66.17* -18.64* -66.21*
APNT -20.08* -68.73* -20.25* -68.46*
AXSB -20.51* -56.95* -20.92* -56.82*
BHARATI -18.37* -60.69* -18.37* -60.69*
BHEL -17.60* -51.81* -17.60* -51.82*
BJAUT -19.31* -73.14* -19.72* -73.39*
BOB -19.00* -64.17* -19.13* -64.27*
BPCL -20.44* -68.48* -20.61* -68.45*
CAIR -18.28* -51.50* -18.28* -51.49*
CIPLA -18.50* -64.87* -18.60* -64.97*
COAL -18.97* -66.11* -18.97* -66.11*
DLFU -20.79* -62.41* -21.16* -62.27*
DRRD -19.44* -69.81* -19.45* -69.81*
GAIL -21.22* -68.53* -21.23* -68.51*
GRASIM -22.47* -81.19* -22.47* -81.19*
HCLT -18.37* -67.32* -18.37* -67.32*
HDFC -18.79* -56.32* -18.87* -56.37*
HDFCB -21.82* -58.12* -21.83* -58.11*
HMCL -20.42* -59.06* -20.47* -58.90*
HNDL -20.18* -54.71* -20.20* -54.71*
HUVR -18.84* -60.72* -18.87* -60.72*
ICICIBC -20.28* -57.39* -21.10* -56.96*
IDFC -20.80* -63.31* -20.90* -63.05*
INFO -18.39* -51.60* -18.39* -51.60*
ITC -18.75* -53.48* -18.79* -53.48*
JPA -21.54* -59.63* -21.72* -59.34*
JSP -18.58* -55.19* -18.61* -55.22*
KMB -30.78* -112.68* -31.79* -107.70*
LPC -18.26* -74.51* -18.32* -74.57*
LT -22.17* -56.81* -22.32* -56.53*
MM -18.61* -58.26* -18.67* -58.29*
MSIL -17.82* -61.35* -18.36* -62.08*
NTPC -19.74* -71.78* -19.90* -71.75*
ONGC -19.98* -58.84* -20.03* -58.84*
PNB -18.53* -55.22* -18.53* -55.22*
PWGR -20.12* -66.81* -20.20* -66.82*
RBXY -20.51* -59.67* -20.66* -59.71*
RELI -24.15* -57.50* -24.43* -57.01*
RIL -20.23* -50.63* -20.23* -50.63*
SBIN -22.96* -57.20* -23.29* -56.65*
SESA -20.25* -56.91* -20.92* -56.43*
SIEM -20.98* -74.90* -20.99* -74.89*
SUNP -20.14* -64.92* -20.14* -64.91*
TATA -21.59* -51.98* -21.64* -51.94*
TCS -17.75* -49.84* -17.88* -50.02*
TPWR -17.84* -58.12* -17.87* -58.12*
TTMT -20.20* -51.40* -20.23* -51.40*
UTCEM -19.81* -74.65* -21.05* -74.10*
WPRO -19.18* -66.96* -19.26* -66.92*
35
Table A4. Unit root test for spread
Intercept Intercept with Trend
Stock ADF PP ADF PP
ACC -31.75* -109.50* -31.81* -109.25*
ACEM -33.12* -107.95* -33.32* -106.76*
APNT -30.42* -110.67* -30.65* -109.74*
AXSB -42.40* -95.65* -42.40* -95.65*
BHARATI -40.36* -95.70* -40.35* -95.70*
BHEL -35.85* -100.08* -35.87* -100.01*
BJAUT -31.51* -112.69* -31.57* -112.44*
BOB -32.87* -109.82* -32.87* -109.81*
BPCL -32.00* -112.37* -32.00* -112.35*
CAIR -33.51* -102.08* -33.66* -101.23*
CIPLA -42.06* -94.03* -42.12* -94.06*
COAL -35.58* -101.85* -35.69* -101.47*
DLFU -37.98* -100.24* -38.54* -98.45*
DRRD -35.09* -106.00* -35.09* -105.99*
GAIL -33.32* -102.73* -33.39* -102.44*
GRASIM -38.83* -95.71* -38.84* -95.57*
HCLT -40.45* -95.42* -40.45* -95.41*
HDFC -41.25* -95.13* -41.25* -95.13*
HDFCB -33.08* -102.52* -33.09* -102.19*
HMCL -36.56* -103.04* -36.59* -102.94*
HNDL -37.88* -97.78* -37.87* -97.77*
HUVR -36.04* -103.56* -36.17* -103.10*
ICICIBC -34.60* -102.57* -34.73* -102.09*
IDFC -36.14* -104.53* -38.08* -97.22*
INFO -33.54* -103.24* -33.55* -103.18*
ITC -35.02* -100.87* -35.50* -98.75*
JPA -33.02* -127.71* -37.69* -106.73*
JSP -35.63* -103.95* -35.80* -103.08*
KMB -20.65* -71.01* -21.21* -70.53*
LPC -30.51* -115.38* -30.55* -115.19*
LT -41.45* -95.04* -41.51* -95.09*
MM -32.80* -110.84* -32.93* -110.22*
MSIL -32.27* -108.76* -32.31* -108.63*
NTPC -36.09* -101.49* -36.20* -100.81*
ONGC -33.71* -99.98* -33.90* -98.99*
PNB -35.96* -101.45* -36.02* -100.95*
PWGR -35.90* -97.90* -36.21* -96.65*
RBXY -32.40* -112.16* -32.49* -111.37*
RELI -42.39* -95.42* -42.40* -95.42*
RIL -36.03* -102.71* -36.53* -100.52*
SBIN -42.48* -95.79* -42.48* -95.79*
SESA -42.54* -95.72* -42.66* -95.79*
SIEM -30.00* -111.83* -30.20* -110.56*
SUNP -32.77* -110.12* -32.82* -109.88*
TATA -39.22* -94.69* -39.32* -94.47*
TCS -35.03* -102.65* -35.04* -102.59*
TPWR -41.20* -94.50* -41.27* -94.49*
TTMT -43.06* -95.64* -43.07* -95.65*
UTCEM -27.21* -115.49* -27.57* -114.27*
WPRO -30.55* -113.04* -30.61* -112.80*
36
Table A5. Cross correlation coefficients
Stock Volatility↔Volume Volatility↔Spread Volatility↔Lag Volume Volatility↔Lag Spread
ACC 0.214 0.066 0.143 0.073
ACEM 0.237 0.084 0.163 0.094
APNT 0.208 0.045 0.141 0.043
AXSB 0.048 0.694 0.035 0.699
BHARATI 0.082 0.603 0.054 0.635
BHEL 0.285 0.041 0.182 0.083
BJAUT 0.222 0.048 0.145 0.118
BOB 0.157 0.025 0.102 0.059
BPCL 0.170 0.074 0.099 0.071
CAIR 0.200 0.034 0.106 0.066
CIPLA 0.062 0.618 0.048 0.719
COAL 0.195 -0.159 0.147 -0.162
DLFU 0.249 0.010 0.121 0.111
DRRD 0.172 0.072 0.138 0.085
GAIL 0.118 0.043 0.07 0.091
GRASIM 0.058 0.67 0.037 0.639
HCLT 0.059 0.656 0.045 0.655
HDFC 0.217 0.100 0.125 0.062
HDFCB 0.200 0.073 0.167 0.164
HMCL 0.226 0.032 0.160 0.188
HNDL 0.176 0.001 0.095 0.040
HUVR 0.056 0.522 0.050 0.495
ICICIBC 0.162 -0.024 0.101 0.030
IDFC 0.179 0.036 0.095 0.103
INFO 0.113 0.007 0.065 0.016
ITC 0.237 0.038 0.172 0.100
JPA 0.187 0.021 0.081 0.046
JSP 0.224 0.124 0.143 0.115
KMB 0.158 0.04 0.112 0.087
LPC 0.21 0.038 0.136 0.079
LT 0.152 -0.394 0.098 -0.305
MM 0.214 0.053 0.157 0.131
MSIL 0.148 0.021 0.096 0.069
NTPC 0.167 0.171 0.140 0.078
ONGC 0.196 0.054 0.130 0.076
PNB 0.22 0.007 0.161 0.073
PWGR 0.197 0.069 0.154 0.097
RBXY 0.295 0.005 0.170 0.066
RELI 0.297 0.056 0.155 0.067
RIL 0.214 0.027 0.146 0.09
SBIN 0.047 0.706 0.031 0.695
SESA 0.047 0.702 0.029 0.676
SIEM 0.173 0.065 0.122 0.090
SUNP 0.203 0.039 0.137 0.106
TATA 0.200 0.06 0.123 0.103
TCS 0.191 0.216 0.143 0.246
TPWR 0.13 -0.595 0.101 -0.488
TTMT 0.102 -0.675 0.072 -0.632
UTCEM 0.122 0.061 0.091 0.039
37
Table A6. Contemporaneous relationship between volatility and volume
2=
1+ 1𝑉 +
Stock α1 t-statistics β1 t-statistics R-squared
ACC -0.033 -17.9 0.011* 20.9 0.046
ACEM -0.047 -20.4 0.012* 23.3 0.056
APNT -0.023 -16.7 0.010* 20.4 0.043
AXSB -0.242 -4.4 0.060* 4.6 0.002
BHARATI -0.144 -7.3 0.033* 7.9 0.007
BHEL -0.117 -26.4 0.028* 28.4 0.081
BJAUT -0.038 -19 0.012* 21.8 0.049
BOB -0.065 -13.5 0.020* 15.2 0.025
BPCL -0.054 -14.5 0.016* 16.6 0.029
CAIR -0.075 -18.3 0.018* 19.5 0.04
CIPLA -0.196 -5.6 0.050* 5.9 0.004
COAL -0.038 -16.8 0.010* 19 0.038
DLFU -0.147 -22.9 0.033* 24.6 0.062
DRRD -0.021 -13.7 0.007* 16.7 0.029
GAIL -0.053 -10 0.016* 11.4 0.014
GRASIM -0.039 -4.7 0.017* 5.6 0.003
HCLT -0.126 -5.2 0.035* 5.6 0.003
HDFC -0.084 -20.1 0.020* 21.3 0.047
HDFCB -0.027 -17.3 0.007* 19.6 0.04
HMCL -0.04 -19.5 0.013* 22.2 0.051
HNDL -0.133 -15.9 0.030* 17.1 0.031
HUVR -0.143 -5.1 0.035* 5.4 0.003
ICICIBC -0.133 -14.9 0.031* 15.7 0.026
IDFC -0.129 -16.1 0.029* 17.4 0.032
INFO -0.182 -10.4 0.047* 10.9 0.013
ITC -0.047 -21.5 0.011* 23.4 0.056
JPA -0.283 -17.2 0.057* 18.2 0.035
JSP -0.138 -19.9 0.035* 22 0.05
KMB -0.029 -12.6 0.009* 15.3 0.025
LPC -0.04 -17.9 0.012* 20.6 0.044
LT -0.102 -13.8 0.026* 14.7 0.023
MM -0.044 -18.7 0.012* 21 0.046
MSIL -0.105 -13.3 0.030* 14.3 0.022
NTPC -0.027 -13.8 0.007* 16.2 0.028
ONGC -0.061 -17.5 0.015* 19.2 0.039
PNB -0.067 -19.1 0.020* 21.6 0.048
PWGR -0.028 -16.5 0.007* 19.2 0.039
RBXY -0.049 -26.1 0.015* 29.6 0.087
RELI -0.135 -27.4 0.034* 29.7 0.088
RIL -0.058 -19.4 0.014* 21 0.046
SBIN -0.361 -4.3 0.087* 4.5 0.002
SESA -0.481 -4.2 0.120* 4.5 0.002
SIEM -0.021 -13.1 0.009* 16.8 0.03
SUNP -0.044 -17.6 0.013* 19.9 0.041
TATA -0.129 -18.5 0.030* 19.6 0.04
TCS -0.058 -17.2 0.016* 18.7 0.037
TPWR -0.106 -11.5 0.026* 12.6 0.017
TTMT -0.292 -9.3 0.061* 9.8 0.01
UTCEM -0.026 -9.6 0.011* 11.8 0.015
WPRO -0.055 -18.6 0.015* 20.7 0.045
38
Table A7. Contemporaneous relationship between volatility and spread
2=
2+ 2 +
Stock α2 t-statistics β2 t-statistics R-squared
ACC 0.0033 8.7 4.4* 6.4 0.0044
ACEM 0.0035 8.0 6.0* 8.1 0.0070
APNT 0.0031 7.2 2.9* 4.3 0.0020
AXSB -0.0399 -11.8 240.8* 92.4 0.4820
BHARATI -0.0443 -27.5 174.2* 72.3 0.3633
BHEL 0.0060 7.7 7.6* 3.9 0.0017
BJAUT 0.0040 11.3 3.7* 4.6 0.0023
BOB 0.0060 6.7 4.0* 2.4 0.0006
BPCL 0.0028 3.8 8.1* 7.1 0.0055
CAIR 0.0032 5.0 5.7* 3.2 0.0011
CIPLA -0.0766 -23.1 235.5* 75.2 0.3818
COAL 0.0086 25.6 -11.5* -15.5 0.0254
DLFU 0.0099 9.2 2.6 1.0 0.0001
DRRD 0.0033 12.5 3.0* 6.9 0.0052
GAIL 0.0033 3.2 6.8* 4.1 0.0019
GRASIM -0.0580 -39.5 97.8* 86.3 0.4487
HCLT -0.0533 -24.6 173.7* 83.3 0.4309
HDFC 0.0034 8.7 6.0* 9.6 0.0100
HDFCB 0.0022 10.8 4.3* 7.0 0.0053
HMCL 0.0045 13.2 2.0* 3.0 0.0010
HNDL 0.0096 5.7 0.2 0.1 0.0000
HUVR -0.0900 -33.8 387.7* 58.6 0.2726
ICICIBC 0.0086 8.5 -9.9* -2.3 0.0006
IDFC 0.0059 4.3 9.5* 3.4 0.0013
INFO 0.0059 2.5 4.8 0.6 0.0000
ITC 0.0030 8.9 3.7* 3.6 0.0014
JPA 0.0096 3.0 8.9** 2.0 0.0004
JSP 0.0016 1.3 32.8* 11.9 0.0153
KMB 0.0045 9.5 3.0* 3.8 0.0016
LPC 0.0046 10.9 3.1* 3.6 0.0014
LT 0.0176 28.8 -55.9* -41.1 0.1555
MM 0.0040 11.8 4.8* 5.1 0.0028
MSIL 0.0056 4.1 6.8** 2.0 0.0004
NTPC -0.0016 -3.9 11.9* 16.6 0.0292
ONGC 0.0032 6.0 6.2* 5.1 0.0029
PNB 0.0077 10.8 0.9 0.7 0.0001
PWGR 0.0019 4.6 4.4* 6.6 0.0047
RBXY 0.0060 15.0 0.4 0.5 0.0000
RELI 0.0097 20.4 3.3* 5.3 0.0031
RIL 0.0039 11.0 3.3* 2.5 0.0007
SBIN -0.0493 -10.3 382.9* 95.4 0.4981
SESA -0.2398 -29.5 505.3* 94.3 0.4923
SIEM 0.0028 5.2 4.2* 6.2 0.0042
SUNP 0.0040 9.2 3.5* 3.8 0.0016
TATA 0.0032 3.7 17.3* 5.8 0.0036
TCS -0.0018 -3.9 31.1* 21.2 0.0468
TPWR 0.0621 59.5 -79.0* -70.9 0.3542
TTMT 0.0565 34.1 -159.8* -87.6 0.4556
UTCEM 0.0019 2.3 6.4* 5.9 0.0037
WPRO 0.0039 7.5 5.3* 4.5 0.0022
39
Table A8. Granger causality test between volatility and volume
Stock
Volume does not Granger cause Volatility Volatility does not Granger cause Volume Lag
Length
F-Stat Prob. Null Hypothesis F-Stat Prob. Null Hypothesis
ACC 24.0* 0.00 Rejected 6.7* 0.00 Rejected 5
ACEM 43.7* 0.00 Rejected 15.2* 0.00 Rejected 4
APNT 16.9* 0.00 Rejected 3.8* 0.00 Rejected 6
AXSB 0.9 0.56 Not Rejected 0.5 0.86 Not Rejected 10
BHARATI 1.5 0.20 Not Rejected 1.1 0.34 Not Rejected 5
BHEL 66.1* 0.00 Rejected 11.0* 0.00 Rejected 4
BJAUT 41.5* 0.00 Rejected 7.1* 0.00 Rejected 4
BOB 21.9* 0.00 Rejected 2.4** 0.05 Rejected 4
BPCL 21.5* 0.00 Rejected 2.8** 0.03 Rejected 4
CAIR 22.2* 0.00 Rejected 7.6* 0.00 Rejected 4
CIPLA 2.0*** 0.06 Rejected 1 0.43 Not Rejected 6
COAL 27.4* 0.00 Rejected 4.3* 0.00 Rejected 5
DLFU 22.0* 0.00 Rejected 6.2* 0.00 Rejected 5
DRRD 41.4* 0.00 Rejected 5.4* 0.00 Rejected 4
GAIL 11.0* 0.00 Rejected 0.8 0.52 Not Rejected 4
GRASIM 0.6 0.84 Not Rejected 1 0.43 Not Rejected 10
HCLT 2.9* 0.01 Rejected 0.9 0.52 Not Rejected 6
HDFC 46.7* 0.00 Rejected 5.8* 0.00 Rejected 3
HDFCB 78.1* 0.00 Rejected 10.6* 0.00 Rejected 3
HMCL 46.9* 0.00 Rejected 7.1* 0.00 Rejected 4
HNDL 34.6* 0.00 Rejected 3.5* 0.01 Rejected 3
HUVR 1.2 0.32 Not Rejected 1.4 0.17 Not Rejected 9
ICICIBC 2.4** 0.04 Rejected 6.8* 0.00 Rejected 5
IDFC 18.8* 0.00 Rejected 3.6* 0.00 Rejected 5
INFO 10.2* 0.00 Rejected 0.6 0.63 Not Rejected 4
ITC 63.9* 0.00 Rejected 10.2* 0.00 Rejected 4
JPA 14.8* 0.00 Rejected 1.7 0.13 Not Rejected 5
JSP 24.8* 0.00 Rejected 3.2* 0.01 Rejected 5
KMB 12.8* 0.00 Rejected 2.1*** 0.08 Rejected 4
LPC 23.2* 0.00 Rejected 3.9* 0.00 Rejected 5
LT 20.1* 0.00 Rejected 1.3 0.27 Not Rejected 3
MM 39.7* 0.00 Rejected 8.5* 0.00 Rejected 5
MSIL 12.6* 0.00 Rejected 0.4 0.85 Not Rejected 5
NTPC 32.2* 0.00 Rejected 4.2* 0.00 Rejected 5
ONGC 33.8* 0.00 Rejected 8.1* 0.00 Rejected 4
PNB 48.7* 0.00 Rejected 4.5* 0.00 Rejected 4
PWGR 42.6* 0.00 Rejected 9.3* 0.00 Rejected 4
RBXY 28.8* 0.00 Rejected 7.6* 0.00 Rejected 6
RELI 70.6* 0.00 Rejected 10.9* 0.00 Rejected 3
RIL 41.9* 0.00 Rejected 5.5* 0.00 Rejected 4
SBIN 1.1 0.39 Not Rejected 0.4 0.96 Not Rejected 11
SESA 0.5 0.93 Not Rejected 0.4 0.96 Not Rejected 12
SIEM 33.7* 0.00 Rejected 2.8** 0.02 Rejected 4
SUNP 29.9* 0.00 Rejected 6.4* 0.00 Rejected 4
TATA 48.6* 0.00 Rejected 3.5** 0.02 Rejected 3
TCS 26.0* 0.00 Rejected 2.8** 0.02 Rejected 4
TPWR 8.1* 0.00 Rejected 0.6 0.69 Not Rejected 5
TTMT 4.2* 0.00 Rejected 0.7 0.66 Not Rejected 5
UTCEM 14.9* 0.00 Rejected 2.0*** 0.08 Rejected 5
WPRO 45.4* 0.00 Rejected 4.0* 0.00 Rejected 5
40
Table A9. Granger causality test between volatility and spread
Stock
Spread does not Granger cause Volatility Volatility does not Granger cause Spread Lag
Length
F-Stat Prob. Null Hypothesis F-Stat Prob. Null Hypothesis
ACC 6.8* 0.00 Rejected 2.02*** 0.06 Rejected 6
ACEM 14.2* 0.00 Rejected 3.44* 0.00 Rejected 5
APNT 5.1* 0.00 Rejected 1.64 0.13 Not Rejected 6
AXSB 485.6* 0.00 Rejected 0.84 0.50 Not Rejected 4
BHARATI 1464.9* 0.00 Rejected 4.85* 0.01 Rejected 2
BHEL 22.1* 0.00 Rejected 0.40 0.75 Not Rejected 3
BJAUT 19.3* 0.00 Rejected 1.04 0.40 Not Rejected 7
BOB 8.7* 0.00 Rejected 0.40 0.81 Not Rejected 4
BPCL 9.0* 0.00 Rejected 0.86 0.50 Not Rejected 5
CAIR 6.7* 0.00 Rejected 2.51** 0.02 Rejected 6
CIPLA 969.4* 0.00 Rejected 4.29* 0.00 Rejected 4
COAL 66.1* 0.00 Rejected 7.86* 0.00 Rejected 3
DLFU 112.6* 0.00 Rejected 1.23 0.27 Not Rejected 1
DRRD 20.5* 0.00 Rejected 0.15 0.93 Not Rejected 3
GAIL 27.2* 0.00 Rejected 6.58* 0.00 Rejected 3
GRASIM 114.6* 0.00 Rejected 12.99* 0.00 Rejected 6
HCLT 313.1* 0.00 Rejected 7.69* 0.00 Rejected 6
HDFC 4.2* 0.00 Rejected 913.3* 0.00 Rejected 8
HDFCB 51.1* 0.00 Rejected 1.68 0.14 Not Rejected 5
HMCL 112.9* 0.00 Rejected 3.31* 0.019 Rejected 3
HNDL 14.8* 0.00 Rejected 0.57 0.45 Not Rejected 1
HUVR 40.8* 0.00 Rejected 9.64* 0.00 Rejected 8
ICICIBC 4.0* 0.01 Rejected 2.91** 0.03 Rejected 3
IDFC 95.8* 0.00 Rejected 5.11** 0.02 Rejected 1
INFO 0.9 0.49 Not Rejected 0.12 0.99 Not Rejected 5
ITC 15.6* 0.00 Rejected 0.41 0.87 Not Rejected 6
JPA 2.5* 0.01 Rejected 1.78*** 0.08 Rejected 8
JSP 20.4* 0.00 Rejected 0.56 0.73 Not Rejected 5
KMB 16.1* 0.00 Rejected 9.69* 0.00 Rejected 5
LPC 7.7* 0.00 Rejected 1.70*** 0.10 Rejected 7
LT 658.7* 0.00 Rejected 1.09 0.30 Not Rejected 1
MM 38.5* 0.00 Rejected 2.85** 0.02 Rejected 4
MSIL 10.3* 0.00 Rejected 1.07 0.38 Not Rejected 5
NTPC 23.1* 0.00 Rejected 2.99** 0.05 Rejected 2
ONGC 16.1* 0.00 Rejected 0.67 0.57 Not Rejected 3
PNB 24.1* 0.00 Rejected 0.83 0.43 Not Rejected 2
PWGR 25.2* 0.00 Rejected 2.03 0.11 Not Rejected 3
RBXY 7.2* 0.00 Rejected 0.53 0.81 Not Rejected 7
RELI 37.1* 0.00 Rejected 0.44 0.51 Not Rejected 1
RIL 24.3* 0.00 Rejected 0.16 0.92 Not Rejected 3
SBIN 420.7* 0.00 Rejected 0.18 0.95 Not Rejected 4
SESA 152.5* 0.00 Rejected 2.48** 0.02 Rejected 6
SIEM 12.4* 0.00 Rejected 0.65 0.69 Not Rejected 6
SUNP 22.6* 0.00 Rejected 0.72 0.61 Not Rejected 5
TATA 91.4* 0.00 Rejected 3.42*** 0.06 Rejected 1
TCS 74.6* 0.00 Rejected 1.99*** 0.06 Rejected 6
TPWR 513.2* 0.00 Rejected 9.66* 0.00 Rejected 2
TTMT 1148.9* 0.00 Rejected 1.04 0.35 Not Rejected 2
UTCEM 2.9* 0.00 Rejected 2.15** 0.04 Rejected 7
WPRO 15.6* 0.00 Rejected 0.96 0.44 Not Rejected 5