M
ASTER OF
S
CIENCE IN
M
ONETARY AND
F
INANCIAL
E
CONOMICS
M
ASTERS FINAL
W
ORK
D
ISSERTATION
C
AN
G
OOGLE
D
ATA
M
EASURE
M
ARKET
S
ENTIMENT
M
ASTER OF
S
CIENCE IN
M
ONETARY AND
F
INANCIAL
E
CONOMICS
Master Final Work
D
ISSERTATION
C
AN
G
OOGLE
D
ATA
M
EASURE
M
ARKET
S
ENTIMENT
B
RUNO
M
IGUEL
A
FONSO
F
ERREIRA
S
UPERVISOR:
M
ARGARIDAA
BREUi
Abstract
The purpose of this paper, on the subject of Behavioral Finance, is to use data from
Google’s Online Search Query, the largest search engine in the world, and its product
Google Trends, to create a variable which will serve as a measurement proxy for
market sentiment. The paper will focus on studying the correlation of Google
measured market sentiment with the returns of the Portuguese Stock Index, PSI-20. To
test this, both linear OLS and VAR regressions will be implemented, using Google data
as an explanatory variable for PSI-20 returns, while at the same time using data from
other control variables to filtrate the fundamental financial analysis. Additionally, the
created sentiment proxy will be compared with other known sentiment proxies in
terms of accuracy and promptness in explaining market behavior.
The paper concludes that Google data is indeed capable of appropriately measuring
sentiment’s influence on the Portuguese market, and it shows more complete results
than other proxies from previous research.
Keywords: Behavioral Finance, Market Sentiment, Google Trends, VAR model, proxy
i
Resumo
O propósito deste artigo, na temático de Finanças Comportamentais, é usar os dados
da pesquisa on-line do Google, o maior motor de busca do mundo, e seu produto
Google Trends, para criar uma variável que servirá como uma proxy do sentimento no
mercado. O artigo irá concentrar-se em estudar a correlação do sentimento do
mercado medido pelos dados providenciados pelo Google, com os retornos do Índice
da Bolsa Portuguesa, o PSI-20. Para realizar este teste, irão ser aplicadas ambas
regressões lineares de OLS e modelos VAR, usando dados do Google como uma
variável independente dos retornos do PSI-20, enquanto que ao mesmo tempo, serão
usados dados de outras variáveis de controlo para filtrar a análise financeira
fundamental. Além disso, a proxy de sentimento criada será comparada com outras
previamente utilizadas, no que toca a precisão, prontidão, e capacidade para explicar o
comportamento do mercado em geral.
O documento conclui que os dados do Google são realmente capazes de medir
adequadamente a influência do sentimento no mercado Português, e mostra
resultados mais completos do que outras proxies previamente utilizadas noutros
i
Agradecimentos
Em primeiro lugar gostaria de agradecer à Professora Margarida Abreu. Pela sua preciosa ajuda, pelo seu constante apoio, orientação, e acima de tudo, pela sua inacabável paciência, sem os quais não concluiria este trabalho.
Gostaria também de agradecer ao Professor António Afonso por me ter proporcionado a oportunidade de participar neste programa de mestrado e pelos conselhos sempre pertinentes.
À minha família, e em particular aos meus avós, pelo seu contínuo apoio, ensinamentos e encorajamento. Agradeço-lhes a sua persistência e preocupação em todos os aspectos da minha vida, mesmo quando eu não notava. Sem eles não seria a pessoa que sou hoje.
A todos os professores e colegas de faculdade, sem os quais não teria chegado ao fim deste percurso. Sinto-me honestamente grato por ter realizado este caminho com vocês, ser influenciado por vocês e ter criado tantas memorias e laços que me seguirão na vida.
Um agradecimento especial aos meus amigos, que tanto fizeram por me apoiar em todos os momentos do último ano, nos bons e particularmente nos maus. Aos meus amigos do BNP Paribas pela sua companhia e por todas as horas de divertimento na aventura que foi o último ano. Um agradecimento em particular, ao Miguel, ao Gonçalo, ao Marco e ao Luís pela sua verdadeira amizade e a este último também por conselhos dados tendo em vista a finalização deste trabalho.
À Débora, por tudo o que me ensinou e de muitas formas, continua a ensinar.
ii
Table of Contents
Abstract ... i
Resumo ... i
Agradecimentos ... i
Table of Contents ... ii
List of Tables ... iv
List of Figures ... iv
1 Introduction ... 1
2 Market Sentiment ... 4
2.1 Fundamentals of Market Sentiment ... 4
2.1.1 Uncertainty ... 5
2.1.2 Heuristics, Biases and Prospect Theory ... 5
2.1.3 Collective Sentiment ... 9
2.2 Investor Sentiment ... 10
2.3 Measures of Sentiment ... 12
2.4 Google Data ... 13
2.4.1 Google data and Attention ... 13
2.4.2 Google data and Market Sentiment ... 15
3 Data ... 18
3.1 Google Market Sentiment – GMS ... 18
iii
3.3 Data Treatment ... 24
3.4 Correlation Matrix ... 27
3.5 Tests ... 28
4 Results ... 30
4.1 Granger Causality ... 30
4.2 OLS Estimation ... 31
4.3 Vector Autoregressive Model – VAR ... 32
4.4 AGMS ... 34
5 Conclusion ... 35
6 Bibliography ... 36
7 Appendix I – Figures ... 40
iv
List of Tables
TABLE I–CONTROL VARIABLES ... 26
TABLE II–CORRELATION MATRIX ... 42
TABLE IV–VARMODELS WITH 2 LAGS. ... 44
TABLE V – VAR MODELS WITH 4 LAGS ... 45
TABLE VI-CORRELATION MATRIX INVOLVING AMGS VARIABLES ... 47
TABLE VII-VARMODELS WITH 2 LAGS FOR AGMS ... 48
TABLE VIII- VARMODELS WITH 4 LAGS FOR AGMS ... 49
List of Figures
FIGURE I-GRAPH FOR GOOGLE TRENDS SEARCH TERM INPUT “CRISE” ... 40FIGURE II-GRAPH PORTRAYING THE AGGREGATE SEARCH TERM ... 40
FIGURE III-GMSPOS GRAPH -GRAPHICAL REPRESENTATION OF THE GENERATED VARIABLE GMSPOS. ... 40
v
Glossary
AbnTurnover– Abnormal Turnover;
AGMS – Sentiment measure by Google using search query with the aggregation of the most
explanatory search terms related with PSI-20 returns;
OLS– Ordinary Least Squares Regression;
VAR– Vector Auto Regressive Regression;
Bubble– Trading value of assets strongly deviates from the fundamental value;
ESIER - Confidence indicators focusing on measurement of the European area;
ESIEU - Confidence indicators focusing on measurement of the Euro Zone area; ESIPT - Confidence indicators focusing on measurement of Portugal;
FEARS– Sentiment measurement proxy based on data from online search query;
GDP - Quarterly data of GDP’s homologous growth rate;
GMS – Google Market Sentiment – Proxy created with search query volume retrieved from
Google Trends;
GoogleTrends– Tool of measurement for query search volume;
GSVI - Google Search Volume Index;
ICE - Indicador de clima Económico - Monthly time series regarding Portuguese investor confidence;
PSI20Ret– Returns of the PSI-20 Index; SVI – Search Volume Index;
SVIW -Search Volume Index after the winsorization process;
SVIWB - Search Volume Index after winsorization and treatments for heterokedasticity;
1
1
Introduction
This paper proposes the use of Google Trend’s data as a means to boost previous
works on the topic of market sentiment, creating a proxy variable composed by Google
Trends’ data and evaluate its ability to measure market sentiment in the Portuguese
stock market. The proxy is then compared with other acknowledged proxies for market
sentiment with the purpose of determining which one portrays more accurately,
thoroughly and timely the aggregate investor behavior.
Market Sentiment, “Animal Spirits”, “Irrational Exuberance”, whatever the reader
prefers to call it, has a considerable impact on the market and the Economy in general.
The psychology of decision making can no longer be disregarded as a crucial feature in
Economics and Finance.
We have witnessed bubbles and market crashes, from the asset prices and real-estates
in Japan during the 80’s, passing through the dotcom bubble of the late 90’s and the
real-estate bubbles all around the world during the 2000’s. Speculative frenzies date
back to the “Tulip Mania” in the Netherlands in the 17th century and still occur today.
None of these events are fully explained by modern economic theory or financial
notions. The idea that investor’s sentiment, other than financial reasoning, can actually
drive the market has faced many objections and critics, but also many supporters from
as early as Keynes to more recent economists like Shiller, being a latent concept on the
2
It can be seen as a reflection of information asymmetry, moral hazard and/or adverse
selection, as a consequence of uncertainty in the financial markets, or simply as one of
the costs of poor risk-taking attitudes by a large amount of investors who end up
basing their action on incorrect sources. Whatever the way you look at it, the
conclusion is always the same; the markets are affected by their participants, and
systematic, financially unfounded behaviors, can have a large impact on the market.
Today, the difficulty lies mostly on the accurate method of measuring the effect of
market sentiment, of pinpointing the extent of irrational investor’s impact on price
changes. It is on this aspect that search query data can provide valuable support.
Nowadays, where all kinds of information are easily obtained through the internet, an
indicator for the amount of search queries including specific words can reveal a great
deal about consumer and investor behavior. This type of data can serve as a precise
insight into people’s motivations, interests, and desires, and help translate agent’s true
perceptions of the world.
Being the largest and most outright used search engine in use today, data regarding
Google search query volume has the potential of being a strong indicator of peoples’
preferences, through means of their online search habits.
With online search query data, it is possible to create a variable which adequately
portrays agents’ expectations and sentiment towards the market in a more
transparent and timely fashion. To test this hypothesis an OLS regression is applied,
focusing on the PSI-20 returns as the dependent variable. To precisely measure Market
3
variables are introduced in the regression. At the same time, this new proxy is
compared with other know proxies of sentiment measurement. From this, it will be
possible to conclude that Google Search Volume indeed serves as a proxy for market
sentiment, having recognizable explanatory power over the behavior of marker
returns. To test for the predictability power of the created variable, the methodologic
approach includes a series of VAR models. These serve as support for the conclusions
present by Da et al (2014), congruent with previous research like De Long et al (1990),
that sentiment’s effect creates a contemporaneous push in prices and returns, which
then suffer a decrease in the following periods (a reversal) has sentiment fades and
fundamental values’ are restored to their dignified importance. Also, has an extra
robustness test towards the created proxy, a test concerning an alternative process of
Google data treatment is conducted, and by means of direct comparison it is possible
to conclude that the methodology implemented by Da et al (2014) provides better
results.
The paper is structured as follows: firstly, the topic is generally introduced introduce
providing important concepts and definitions; next, the data to be used is presented
and the necessary calculations and data treatments are explained; the ensuing section
explains the methodology approach used in to address the core questions of the
4
2
Market Sentiment
2.1 Fundamentals of Market Sentiment
Going back to one of the fathers of modern economics, John Keynes (1936) advocated
for the existence of what he would name “animal spirits”, aggregate investor behaviors
that affect the market, driving prices away from their fundamental values. Ever since,
we have witnessed stock market crashes, bubbles, and other surprising and otherwise
unexplained market behaviors by mainstream economic theory. It reached the point
where economic thought begins to adapt, as it becomes logical to generate new
economic and financial theories, or expand the existing ones, with imported concepts
which were previously only studied by disciplines like psychology and sociology.
On this regard, Behavioral Economics/Finance has made some significant advances
towards a better, fuller comprehension of the human behavior. These breakthroughs
can be considered on an individual investor behavior perspective, dealing with biases
and the role of decision making, or through investors’ aggregate influence projected
onto the market through less-than-optimal decision making. With the arising of new
ways of interpreting uncertainty, the addition of auxiliary concepts like market
sentiment and the development of attention theories, the formulated hypotheses to
describe the decision making process proposed in the existing literature are
5
2.1.1 Uncertainty
Uncertainty isa key issue in economic research. Agent’s decision making is driven by
the degree of their uncertainty regarding future events, their possible payoffs and
correspondent likelihoods, which are reflected by agent’s knowledge span in the
present, ability to process information and availability of said information.
Furthermore, the choices made are dependent on people’s relation with risk, and,
maybe just has importantly, how people choose to interpret said risk.
The Expected Utility Hypothesis is Economic theory’s generally acknowledged
approach to deal with uncertainty. Its conclusions are based in the computation of the
expected value of the possible outcomes taking into consideration their respective
probabilities and payoffs. Although the theory conveys the perception of the rational
choice, the sufficient conditions for its application may not always hold for decision
makers in real-life situations. On this line of thought, the existence of uncertainty and
risk, imposing themselves into the market through asymmetry of information among
the participants, can lead to cases of market inefficiency from which known problems
such adverse selection or moral hazard transpire.
2.1.2 Heuristics, Biases and Prospect Theory
Behavioral Economics addresses the problem of uncertainty. Tversky and Kahneman
(1974) and Kahneman (2011) contribution on the topic arose with the conception of
the Prospect Theory, a Behavioral Economics challenger for the traditional von
Neumann-Morgenstern utility theory. This theory’s assumptions are based on the
6
rules of thumb that the brain uses to facilitate decision making. At the same time,
Prospect Theory incorporates innovative concepts from the field of psychology into
economic theory, by considering relative gains or losses rather than final payoffs, and
individual probability weightings. It challenges the basic Economic assumption that all
agents are rational and always chose the best possible options. However, sometimes
this comes at the cost of reaching rushed resolutions for problems, meaning that
people, with haste of reaching a solution for a more complex problem tend to make
interpretation or calculation based mistakes that ultimately lead to poor decision
making. When applied to the fields of Finance and Economics these decisions
(provided by less-than-optimal interpretations of new pieces of information for
example) can mean that the subsequent aggregate actions of investors can affect the
market in ways that do not reflect fundamental information. We can ascertain that
when the effect of individual biases, prone to affect agents, is generalized to a
sufficient number of (irrational) investors, prices and stock returns can show some
unforeseen movements.
For the purposes of this paper, Behavioral biases can be categorized into 3 main
classes: Perception and information processing biases such as availability bias, Framing
biases such as accessibility or anchoring, and Representativeness.
In most economic textbooks it is stressed that one of the fundamental frameworks of
economic thought is that of agents being rational. However, in practice, because of
constraints related with time, memory and capacity to process all available
information, that is not usually the case. Perception and Processing Biases focus on
7
preferences that dictate their financial actions.
Tversky and Kahneman (1974) had already stressed the importance of Availability of
information, and the existence of a bias associated with the process of relying on
information which is readily available, bypassing further research for newer and better
data to justify conclusions. Applied to financial markets, this particular form of
heuristics can take the form of investors focusing on opposing opinions regarding the
future performance of a specific stock, which halts them from examining the real value
of the stock, or alternately by focusing on a particular piece of news instead of the
overall information regarding the firm and industry.
Framing and Mental Accounting is another major behavioral bias category and it
states that, unlike what is defended by the rational theory of choice, the formulation
in which problems and situations are presented does have an impact in the way agents
address them, and can go as far as altering usual actions and preferences.
A prime example of this type of bias is what Behavioral Economists name as
Accessibility, and its importance has been highlighted by authors like Kahneman,
(1974). It consists in the subjective interpretation of the facts at hand, which differs
from person to person, and as such serves to justify the different, sometimes broadly
opposite actions played by market participants. Put in another way, when an agent
processes information and makes a choice, context matters, as does the mental state
or the ease with which a particular idea or feeling comes to mind. Anchoring is also a
common bias, conveying people’s tendency to rely too heavily on a set piece of
information, named the “anchor”. This serves as the basis of comparison, basically
8
looking for further information and extrapolation of conclusions based on a piece of
info which might even turn out to be irrelevant.
The third category, closely linked with uncertainty, Representativeness Heuristics
consists in the way the brain can choose to mentally adapt the conditions of a difficult
problem to solve, transforming it into a simpler problem with an easier solution. Many
times this means extrapolating past results or incurring in stereotypical notions and
errors.
Emotions, moods, reaction to news and other major events or even trivial everyday
events, can direct investors’ actions and attitudes toward risk, prompting them to
make excessively risky moves, or in other words, directing them for situations where
the possible payoffs do not fully incorporate the compensation necessary for the
amount of risk taken. It is common for individual investors to manage their investment
portfolio based on companies they like, or the ones they have good experiences with,
regardless of their actual historical or current performance in the markets. For
example, Kahneman (2011) writes a passage where he tells the story of an
acquaintance that invested in Ford, merely because he liked the firm and was happy
with its products, not basing his decision on any particular source of information or
belief that the stock was undervalued at the time. (Abreu, Mendes (2012) also deals
with this subject).
What mattered to his decision was merely the way he felt about the firm, about the
9 2.1.3 Collective Sentiment
All the effects indicated above are biases and heuristics applying to investor’s on an
individual level. However, major divergences with fundamental financial reasoning
occur due to the aggregate behavior of individuals, and while it seems unreasonable to
believe that a majority of investors might all be induced in error, the truth is that many
times unsophisticated investors seem to incur in what is designated as Herd behavior
(Chang et al (2000)). This collective phenomena consists in people’s following large
groups, not taking into account the validity of the decision being made, based on the
fallacy that large groups of investors cannot be wrong. This behavior is most notably
displayed during the occurrence of bubbles.
A sense of collective thinking can drive the market and as such, factors which affect
the large collectives of investors will indirectly impact market forces.
Kamstra et al (2003) link sentiment with seasonal affected disorder. Focusing on
previous research linking periods of depression to periods of low daylight, the authors’
research finds positive correlations between periods of higher risk aversion and a
seasonal variation of equity gains, verifying the idea that amount of day time can be
linked with returns and portray agents overall sentiment and mood. Edmans et al
(2007) link mood with the stock market through soccer results. They find positive
correlations between national teams’ soccer results (particularly negative result) and
market returns for that country, resulting in a collective mood which is projected onto
investors and affect financial actions. During this rush to catch the trend, it can be very
costly to be left out, and that thought is also a driving factor for the promotion of herd
10 2.2 Investor Sentiment
Sentiment’s distinctive effect, and its toll on the overall market performance, has been
the basis for a large amount of academic research. Authors develop distinct
perspectives on these inaccuracies of human aptitude and undertake different
approaches to capture these effects’ magnitude, hence the multiple possible variables
that can be used in order to quantify sentiment’s effect in the market. In its core,
market sentiment can be perceived as the aggregate sense of optimist or pessimism
towards future financial performances, which translates in the amount of risk investors
are willing to take (Baker and Wurgler (2007)). If investors are driven by an excessive
wave of optimism, market deals should materialize an increase in prices above their
fundamental value, as the peoples’ shared euphoria induced behavior displays a sort
of bandwagon effect. This way, phenomena like heuristics and biases, emotions and
mood, reaction to news and individual interpretations, all caused by the effects of
uncertainty and asymmetry of information existing in the market, can contribute to
the formulation of a distorted image of the financial reality. This effect of investors’
overall sentiment over the market can generate robust deviations from fundamental
prices contributing to a moreover menacing implication of the existence of a “crowd
mentality”, which helps explain periods of unpredictable, random-walk like market
performances.
These effects are particularly prominent on individual agents without access to major
sources of information, the “unsophisticated investors” or like it is usually named in
the literature, irrational investors. De Long et al (1990) explain the incidence of
11
in the market based on fundamental information, and irrational investors, noise
traders, whose actions can be affected by their emotions towards a certain stock, a
firsthand piece of news, or a particular event of interest. These individual investors
tend not to follow the traditional sense of economic and financial procedures in the
evaluation of assets, they fail to diversify and hedge investments, and they conduct
their own independent research on the market.
Shiller and Akerlof (2009) go as far as discussing several behavioral phenomena, or the
so called “animal spirits”, like the effects of confidence and the creation of stories,
both of which affect the economy and stock markets. Given their influence on
expectations of future payoffs and investment appraisal, their importance on asset
price movements should not be disregarded.
Barberis et al (1998) dealt with investor sentiment in market interactions and asset
price formation through means of an investor sentiment model based on the
interaction of biases such as over and under reaction to news and announcements.
Their interpretation of sentiment is linked with the occurrence of news and its
reception by investors a having a measurable effect in stock price movements. They
provided guidance for future research alluring ideas of price shifts due to
overreactions to news, and the behavior subsequent to stock market crashes.
The mentioned research comes to show the multifaceted range of effects that investor
sentiment can have on the markets, and the importance of figuring out how to deal
12 2.3 Measures of Sentiment
While the previous works deal with the theoretical effects and implications of the
market’s behavioral spectrum, others focus on measuring its effects in a more practical
way. As Baker and Wurgler (2007) put it “Now, the question is no longer, as it was a
few decades ago, whether investor sentiment affects stock prices, but rather how to
measure investor sentiment and quantify its effects”. In the referred paper, the
authors themselves construct a composite sentiment index by aggregating several
variables which were considered as indirect proxies for sentiment measurement in
previous researches (trading volume, dividend premium, first-day returns on IPO’s,
amongst others). Their composite variable reflects the observed historic events like
bubbles and other crashes on the stock market, succeeding in capturing sentiment.
Robert Shiller (2010) on another hand looks at surveys with hopes they can provide
some insight towards agents’ sentiment flows around known periods of
overconfidence and surge of financial bubbles.
Also resorting to surveys to face the problem of sentiment measurement, Brown and
Cliff (2004, 2005) decided to use a time series based on newsletter inquiries with the
purpose of comparing survey data with other known proxies for market sentiment,
reaching the conclusion that they indeed serve as a viable option. The conducted tests,
including VAR tests on a composite variable that measures market sentiment, provides
them enough confidence to state that their method of measuring sentiment is able to
capture asset price deviations from their fundamental values as well as the
correspondent future return reversals expected from the guidelines of market
13 2.4 Google Data
2.4.1 Google data and Attention
A large set of researches focuses on another topic of Behavioral Finance, relating Google data
with attention, and proposing a distinct explanation for investor’s judgement regarding stock
acquisition.
Google’s data brought forth an innovative tool for researches, assembling support for attention
grabbing theories like that fashioned by Barber and Odean (2008).This theory of attention, in
the epicenter of this type of research, states that individual investors are net buying of
attention-grabbing stocks. A typical investor can choose between thousands of stocks, so it is
unreasonable to believe “irrational investors” maximize gains while considering all available
options of investment. This happens because investors are faced with limitations of time and on
their capacity of information processing. This last is a fundamental foundation of the field of
Behavioral Economics, denominated Bounded Rationality, Kahneman (2003). There is simply too
much to compute and too many investment options for a single person to make the very best
decision every single time, even considering theoretical economic approaches where agents are
unbiased. A more realistic hypothesis is that, if we consider that short selling its not common
practice for individual investors, meaning they can only sell what they have, investors will trade
more those stocks that are “newsworthy”, that is, the stocks that get their attention somehow.
Like previously stated, this is greatly interpolated with the Availability bias.
In Barber and Odean (2008), the authors test the possibility that surges of attention could
14
returns a few weeks after the fact. Their results indeed appear to support their proposed theory
and make explicit that individual investors are affected by behavioral heuristics.
Based on this initial ground setting work, a considerable amount of researchers have directed
their research towards the idea that the way individuals pay attention to firms and stocks,
better explain unsophisticated investor’s attitudes on the stock market. As such, several proxies
for attention, like the occurrence of important pieces of news concerning the firms, volatility,
abnormal returns and liquidity, have been tested in the studies conducted to attest the value of
this theory.
Significant for our case, Da et al (2011) make good use of Google queries data and find
correlations between it and other proxies for attention such as turnover, extreme returns and
news. As an added plus, they find that this sort of data can capture investor attention (linking to
Barber and Odean’s theory) in a more timely fashion than other proxies, which take longer to
exhibit how changes in attention affect the markets.
Bank et al (2011) focus on the case of German stocks, but arrive to similar conclusions
regarding the capability of Google search volume to measure attention since their results show
that increases in trading activity are related with investor recognition. They, in fact, suggest a
positive correlation with stock liquidity, which they attribute to a reduction in asymmetric
information.
On a less specific study, Latoeiro et al (2013) focus on stocks comprising the EURO STOXX, and
find that Google queries’ behavior precedes changes in trade volume and volatility, and
15
Aouadi et al (2013) focus on the French case, using Google data to research attention
implications on stock market activity and volatility. Their findings are in line with other research,
mainly, a positive correlation between liquidity and attention grabbing stocks. Their results are
likewise robust to different ways of calculating volatility, and even the recent financial crisis, to
which the effect of attention on stock performances and volatility does not subdue.
Although without mentioning Barber and Odean’s theory, but still with the purpose of finding
new information to support attention theories, Mondria et al (2010) sought to find how
attention affects portfolio choices, creating another measure for attention based in data from
Yahoo (and not Google, although Google greatly dominates the web search market), and study
the determinants for attention allocation for US investors. Their key conclusion has implications
on both behavioral economics and decision making, since they find two-way causality between
attention allocation and home country bias.
2.4.2 Google data and Market Sentiment
The idea of using data from Google Trends as an explanatory variable for financial phenomena
has been gaining some track in the past years. Choi and Varian (2012) have used Google Trends’
data in order to forecast near contemporaneous values for macroeconomic indicators such as
unemployment, consumer confidence, and consumer patterns, particularly concerning
automobile sales and travel destination planning.
For example, if a person is interested in purchasing a new car, the best way to gather
information about possible models and brands and compare vehicles is to conduct online
16
the search for more detailed characteristics or financing methods. The aggregate search habits
of the population can then mirror sales for that particular model. The same applies for the stock
market.
They go as far as to state that Google Trends’ data can be used to help predict incidence of
some diseases like influenza and flu, mapping its progress and effect, based on the amount of
queries of search terms related with those diseases, like symptoms and methods of treatment.
After this work, academics understood the usefulness of Google data in “predicting the present”
and favored its ability in explaining the behavior of consumers and investors, resulting in an
observable increase of research regarding these topics in recent periods. Irrational investors,
like previously defined, have access to considerably less materials than what are designated the
“sophisticated” or “traditional” investors, and as such they resort to sources of information
which might not be the most appropriate, might not be relevant or even contain incorrect or
incomplete data. This leads to different expectation over stock performance and increases
divergence on the overall attitude towards the market. Given the wonders made possible by
modern technology and its worldwide generalization, it is reasonable to consider that investors
acquire large chunks of information regarding the state of the economy and financial markets
over the internet. This paper’s objective is to focus on the particular activity of these agents and
seize that information to get a quantifiable understanding on how investors perceive the
market.
In the last few years, particularly after data from internet search queries was made available in
17
web search queries as a quantifiable measure of otherwise unquantifiable occurrences.
Subsequently, many authors have drifted towards this nature of data in hopes of capturing
behavioral phenomena. The proposed premise of this paper is that web searches of particular
search terms convey preferences and attitudes of irrational investors which use said method for
financial information gathering. We test the implication that it is a more transparent manner
and with faster contemporaneous adjustment in relation to other known measures of sentiment
measurement.
Joseph, et al (2011) check online ticker data for its ability to forecast stock returns, trading
volume, and volatility. They find reasons to believe that web data can be used as a forecasting
tool, particularly for stocks that are considered harder to arbitrage, which are more striking to
be affected by sentiment shocks, like some previous research has shown (Baker and Wurgler
(2007)).
This paper will closely follow the methodology of Da et al (2014), in which the authors create an
index with the purpose of measuring investor Sentiment. Their creation, the FEARS index, is
based on data from online search query volume retrieved from the major search engine,
Google, by mean of their product, Google Trends. The authors are able to show that this
indicator of negative sentiment predicts aggregate market returns, particularly for those stocks
considered as favored by unsophisticated investors (the effect is stronger for equities and small
stocks, instead of treasury security returns). It shows an inverse correlation with
contemporaneous returns, but also an increase in FEARS shows an increase in returns in the
18
sentiment theory. Regarding volatility (one of the measures used is VIX), the results show a
positive contemporaneous correlation between FEARS and VIX, again followed by a reversal in
the succeeding days, supporting previous research stating that noise trading has a temporary
effect on price volatility. Lastly, because mutual fund holders are usually individual investors,
sentiment (negative sentiment in particular) is more likely to influence the behavior of these
types of assets. The authors also find that FEARS predicts mutual fund flows out of equity funds
towards bond funds, meaning that a spike in FEARS is followed by that particular shift, which
embodies a flight to safety.
3
Data
3.1 Google Market Sentiment – GMS
Google Trends allows everyone access to data concerning internet queries through their
website. An interested party can specify the search term of choice and constrain the search in
terms of geographic location where the queries are posted, as well as time period limits. Figure
1 illustrates data retrieved from Google Trends concerning the amount of searches made for the
term “crise”, the Portuguese word for crisis, in Portugal during the period of 2004-2015.
[Insert Figure I]
Notably, the massive increase in the amount of searches in August 2008 allows a glimpse into
peoples’ sudden awareness regarding the county’s economic reality.
19
volume, but rather it is measured relatively to the highest overall amount of searches, ie, the
time series is scaled by the time series’ maximum. This means that the data provided is
normalized, being presented in reference to the maximum number of hits the search term
achieved during the specified period of time. This way, the values returned by Google Trends
are ranged from 0 to 100, and if, for example for a particular search term, on a particular time,
the observation is 60, that value is relative to the maximum (100) number of search queries for
that term. The highest point in the graph will always have a value of 100, translating the period
where the amount of searches was at its zenith. The value for a particular geographic location
where the query is placed is also in relation with the overall number of searches in the region it
is inserted. Google Trends actually gives us the likelihood of that term being searched in that
location, relative to close countries, as to not beneficiate more populated countries with an
immensely greater number of “hits”.
Previous authors like Da, et al (2014), remark the definition of search terms as the first crucial
step on this line of research, engraving the importance of using accurate, appropriate terms that
are related with the research and leave little to no room for generic interpretations of what the
person searched when he made that web-query. For example, ambiguous search terms like
“receitas” which might mean financial revenues or meal recipes, should fall in the category of
terms ignored by this approach. In order to broad the range of the research, a series of search
terms that would encompass several aspects of economics and financial fields were compiled.
Part of this research was based on the search terms covered on the word trees created by Ana
20
including additional search terms considered to be of the economic and finance jargon. This
dictionary was previously used by Da, et al (2014) and Tetlock (2007) and comes with the
aggregate advantage of allowing classification for each term into words of positive and negative
connotation. Some other search terms were the result of general surveys, conducted with the
purpose of finding which terms agents (and individual low frequency investors) tend to search
for. Unlike previous works, this research focuses on search terms in the Portuguese language.
The reason for this is that it is believed to better reflect the research methods of individual
investors, that is, it would be expected that individual, non-sophisticated investors conduct
searches in their official language, other than English. This could be interpreted as a form of
home country bias, as an investor preference for his own national market is reflected by his
preference in conducting relevant research using his native language instead of using a more
global language where he might yield better and more diversified information. After searching
for about three hundred search terms, data was retrieved after having identified the ones
without major timeline breaks, as many of the chosen search terms did not present a sufficient
number of queries as calculated by Google’s method of scalar multiplication, meaning that
people would not search that term enough for it to be relevant for the time series to be
retrievable. Furthermore, although Google’s data goes as far back as 2004, another large
concern faced was that some terms did not possess data ranging that far, showing several null
results for a large amount of terms for long periods of time. Because of this the timeline was
21
the financial crisis. These major challenges reduced the sample significantly, to around 180
search terms.
Having downloaded time series’ for each of the surviving terms, the variable was designated has
Google Search Volume Index, or GSVI for short. Some series however were only treated on a
monthly basis, contrasting with others, in weekly basis. This is probably due to the fact that
through a particular period of time, some specific terms do not have enough “hits” to be
considered significant after the scalar multiplication, and as such, their frequency turns out to
be on a monthly basis. To advance the research the terms possessing a weekly basis were
selected. Although the number of usable terms is reduced significantly, the final results prove to
be more consistent and reliable.
Further, the SVI (Search Volume Index) was computed for each time series, ie, the natural
logarithm of the GSV (Google Search Volume Index) series.
𝑆𝑉𝐼𝑗,𝑡 = 𝑙𝑛(𝐺𝑆𝑉𝐼𝑗,𝑡)
Because some of these search terms also have some brief periods of GSV equaling zero, in order
to deal with the logarithm, the choice fell on the replacement of all zero observations with 0.1
in order to reduce order alteration after applying the logs. Next the data is transformed further
in order to take into consideration weekly variations of the variable instead of its level.
∆𝑆𝑉𝐼𝑗,𝑡 = 𝑆𝑉𝐼𝑗,𝑡− 𝑆𝑉𝐼𝑗,𝑡−1
Afterwards great care was taken to identify possible outliers at the 10% level (5% each tail)
allowing the undergoing of a process of winsorization for each search term, ie, replacing values
22
percentiles. This way outliers and extreme values are eliminated, removing major problematic
aspects of Google Trends’ computation of data at the time of download. It is a necessary
process, considering the nature of GSVI’s computation by Google.
Next, an Analysis of Variance tests (ANOVA tests) are performed. The purpose of these tests is
to check if there exists a statistical difference between the means of the variables. The null
hypothesis is that the monthly means are equal. If the null hypothesis is rejected, meaning that
there is significant change in data depending on the month, the data must be deseasonalized by
regressing the time series of the variable ΔSVIW on monthly dummies, and keeping the
residuals for further use. This process was applied to both the GSVI variable, the “raw” data, and
to the ΔSVIW (ΔSVI after winsorization) and the results show that both transformations lead to
different and opposite conclusions. The best results seemed to derive from applying the
methodology to the raw data. For example, the search term “irs” should, in theory, present
some seasonality, as more people search that term around the due date for dealing with taxes.
The ANOVA tests on GSVI are in concordance with this idea, as for other search terms, so
analysis was conducted considering the results for this variable. Finally, in order to deal with
heterokedasticity, for each search term, a scalar multiplication of its standard deviation was
applied to ΔSVIW, creating the variable ΔSVIWB. This concludes the treatment of Google Trends’
raw data, which is now ready for further use.
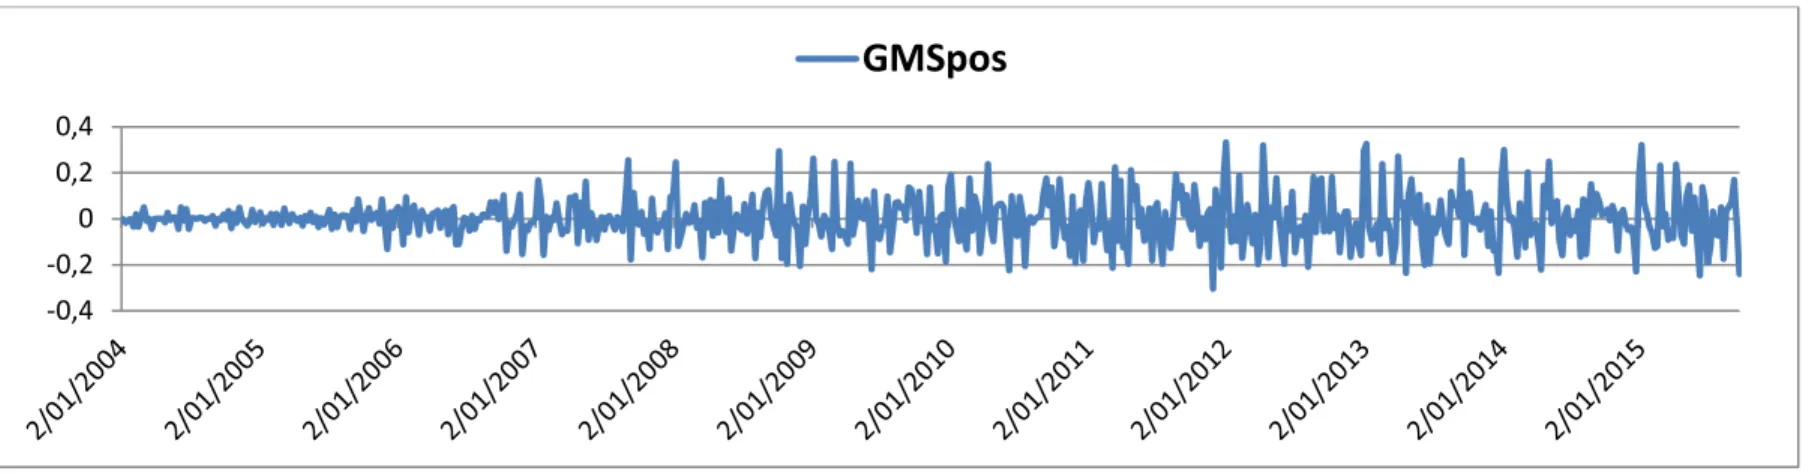
The ensuing step thins the range of search terms even further by identifying those search terms
which are better correlated with market returns. To examine this, backward-looking rolling
23
historical relationships with contemporaneous market return. The regressions have a rolling
window of 55 and a step size of 26 weeks. From the 180 terms that were tested, 25 proved to
be statistically significant at least at the 90% level, showing t-stats around 1.60. From those, the
10 terms with best significance either with positive and negative correlation with market
returns where chosen to create the variables GMSpos and GMSneg.1 The images pictured in
figures 2 and 3 are somewhat similar to one another and depict rather erratic behaviors. In spite
this, particularly for the case of GMSneg, the illustrations does seem consistent with some
periods in which worse market sentiment would theoretically be expected, showing a
considerable increase in negative sentiment 2008 onward.
[Insert Figure III & Figure IV]
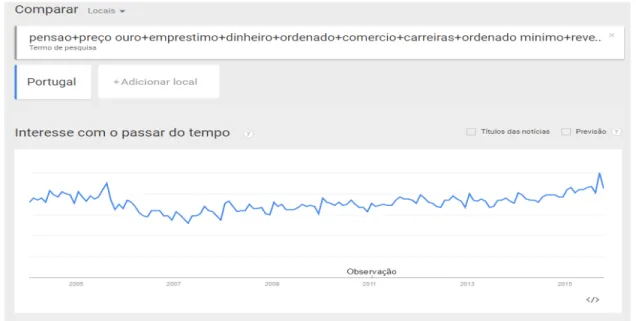
3.2 Google Market Sentiment – AGMS
Additionally, an alternate method of testing the robustness of the GMS variables consists in
using a different technique to form them. Google Trends allows users to search words in an
aggregate method, combining different terms in the same search query. So by typing the search
terms which better correlate with returns onto Google Trends in such a fashion (as identified
before), the Google Market Sentiment variables can be constructed anew as AGMS (Aggregate
Google Market Sentiment).
1* GMSpos words: “Saldo”; “Procura emprego”; “Inovação”; “Abono”; “Investimento”; “Trabalhadores”; “Risco”;
“Desenvolvimento”; “Oferta de Emprego”; “Benefícios”.
24 [Insert Figure II]
After the data referring to this new sentiment proxy’s time series is retrieved, the same data
transformations we applied to each individual search term are performed, that is,
logarithmization, first differences, winsorization and heterokedasticity testing.
3.3 Data Treatment
In the following sections, the created proxy for market sentiment will be confronted with a
series of tests in order to assess its efficiency in expressing the effects of sentiment, and
robustness checks through comparisons with other proxies for market sentiment. To test
Google’s ability to quantify sentiments’ influence on the financial market, further data was
gathered, ranging from period 2007 until 2015. PSI-20 Index’s weekly opening values from Bolsa
de Lisboa were retrieved and went under the following procedure of return’s calculation:
𝑃𝑆𝐼20𝑟𝑒𝑡 = ln(𝑃𝑡) − ln(𝑃𝑡−1)
In order to accurately assess the worth of this new proxy, it is necessary to introduce some
control variables into our model. As such two types of control variables were added to this
analysis:
- Economic control variables: GDP, Inflation, Unemployment – Serving has a way of
incorporating fundamental macroeconomic information into market returns;
GDP - Quarterly data of GDP’s homologous growth rate gathered from INE
Inflation– Monthly data of homologous variation of the IHPC (índice harmonizado de
25
Unemployment– Homologous rate on a monthly basis got from INE, calculated has a
percentage of total population.
- Sentiment Measurement proxies: To be used as benchmarks, providing a term of
comparison in order to provide insight in how well web search queries’ data perform
relative to other sentiment proxies.
Economic Sentiment Indicator–ESI– This variable is a composite of five sectoral
confidence indicators with different weights. Based on surveys and calculated has an
index by EUROSTAT, the gathered data serves as a sentiment proxy for the areas:
Europe - ESIER
Euro Zone - ESIEU
Portugal - ESIPT
Indicador de clima Económico – ICE - Monthly time series produced by INE based on
surveys and regarding Portuguese investor confidence.
VSTOXX– Index designed to reflect expectations about market volatility, serves as a
“Fear Gauge”. The time-series is retrieved in a daily basis, but the data used is the one
respecting the first day of the week.
Turnover – Turnover on PSI-20 Is acquired from Bolsa de Lisboa, as it was done for
returns.
Abnormal Turnover – From the previous data, AbnTuronver is computed as:
𝐴𝑏𝑛𝑇𝑢𝑟𝑛𝑜𝑣𝑒𝑟 =∑ ln(𝑇𝑢𝑟𝑛𝑜𝑣𝑒𝑟ln(𝑇𝑢𝑟𝑛𝑜𝑣𝑒𝑟𝑡)
𝑡−1) 52
26
It is noteworthy to point out that some of these variables were only available on a monthly or
even quarterly basis, causing obvious concern since the study’s main variables are created with
a weekly frequency. Because there appears to be no ideal way of dealing with this issue, the
decision tilted towards keeping the corresponding monthly values throughout the periods in
question, that is between January 2007 and September 2015.
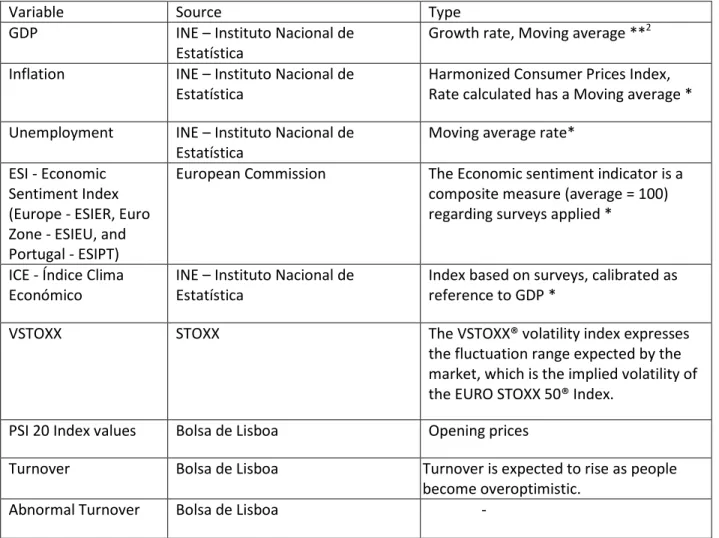
Table I –Control Variables
Variable Source Type
GDP INE – Instituto Nacional de Estatística
Growth rate, Moving average **2 Inflation INE – Instituto Nacional de
Estatística
Harmonized Consumer Prices Index, Rate calculated has a Moving average * Unemployment INE – Instituto Nacional de
Estatística
Moving average rate* ESI - Economic
Sentiment Index (Europe - ESIER, Euro Zone - ESIEU, and Portugal - ESIPT)
European Commission The Economic sentiment indicator is a composite measure (average = 100) regarding surveys applied *
ICE - Índice Clima Económico
INE – Instituto Nacional de Estatística
Index based on surveys, calibrated as reference to GDP *
VSTOXX STOXX The VSTOXX® volatility index expresses
the fluctuation range expected by the market, which is the implied volatility of the EURO STOXX 50® Index.
PSI 20 Index values Bolsa de Lisboa Opening prices
Turnover Bolsa de Lisboa Turnover is expected to rise as people become overoptimistic.
Abnormal Turnover Bolsa de Lisboa -
2 *Monthly Data
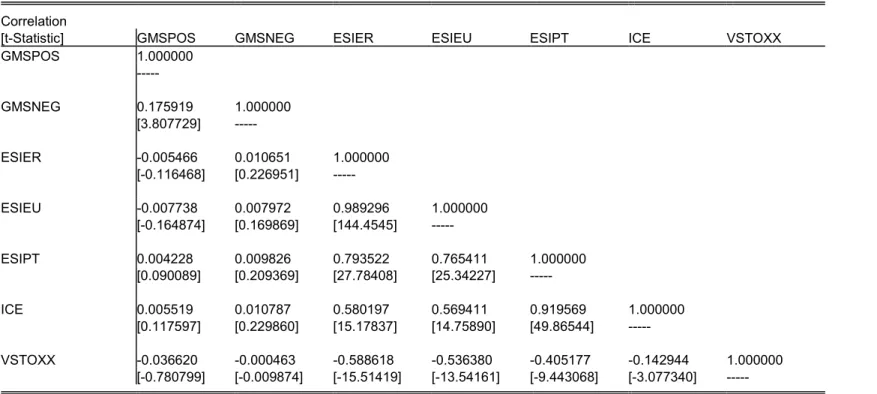
27 3.4 Correlation Matrix
To develop an overall picture regarding how the sentiment measurement proxies perform in
relation to each other, a correlation matrix was performed. The highest, statistically significant
correlations are, as it was to be expected, among the different sentiment measuring proxies for
Portugal, and the surrounding areas, ESIER, ESIEU, ESIPT, ICE, as they are computed in similar
fashion (mostly resorting to surveys) and some from the same institutions. Because of the
negative effects of using such correlated proxies as explanatory variables in the same
regression, it was decided to relinquish the usage of some of these from the ensuing
econometric models. The variables belonging to this array chosen to be inserted in the models
will be ESIEU and ICE for their relevance and significance. VSTOXX also shows significant
negative correlations, reaching tolerably high values with some sentiment proxies. This was to
be expected, as an increase in Euro STOXX 50 Index’s volatility should be interpreted as an
increase in pessimist and negative sentiment towards the market.
Regarding the created proxies, the results only appear to be significant amongst each other,
presenting a small and, most puzzling, positive correlation, as illustrated by the figures 3 and 4
where GMSpos mimics GMSneg behavior through some periods. With the exception of some
periods where the behavior seems to go on the same direction, the GMS variables do not seem
to fully replicate the behavior of the remaining known sentiment proxies. Possible explanations
can be that, either Google data does not fully encompass the effects of sentiment in the market
or, given this unlikely supposition given the solid theoretical reasoning behind the past
28
doing so, particularly on a more timely fashion, when taking in consideration the data frequency
of the other proxies in comparison.
[Insert Table II] 3.5 Hypothesis Testing
The focus of this next section is to test the fundamental hypothesis of this paper - Does this
created variable succeeds in capturing the sentiment impact on Index returns, and if so, how
does it compare with other known proxies? The methodology proposed to deal with this issue
consists in three layers of tests. Firstly we check basic correlations between sentiment proxies
and apply causality tests. Main expectations involve the viewing of significant correlations
between the behavior of GMS variables and other sentiment proxies. The causality tests will
provide a better idea of causality direction, and to be consistent with preceding theories
(particularly Delong et al. (1990)), it is expected that the created proxy for sentiment to be a
cause of market returns.
Secondly, a series of simple OLS regressions is implemented, introducing the control variables
individually and in sequence with the purpose of following GMS’s impact has the model
becomes more complex. The intuition behind the relation between the novel measurement
proxy and returns is that increases in positive sentiment will result in pressure to increase
prices, followed by a fall shortly after as the euphoria fades away, returning prices to the
fundamental value, while a negative sentiment wave toward the market explains a decrease in
returns, representing a negative correlation. Prior to any experimentation, the results are
29
representation of the economy’s well-being. A positive correlation is also to be expected
between inflation and PSI-20 returns. Unemployment is anticipated to show a negative
correlation as higher rates of unemployment are characteristic of periods with low economic
and financial performances. Additionally, all the remaining sentiment variables are expected to
present positive correlation with the returns, with the exception of VSTOXX given that it
measures fear, and not confidence.
Lastly, the same process as before is applied but this time resourcing to Vector Autoregressive
Models with the purpose of obtaining some insight about GMS’s capacity to predict Returns.
Having recognized the contemporaneous explanatory power of this model, and most
particularly, of GMS on measuring market sentiment, the focus will shift towards the
recognition of lagged sentiment over returns and the predictability power of said variables. In
order to test this, the chosen methodology comprises a series of VAR models in which the
several control variables are systematically added to the regression. These tests serve several
purposes. Firstly, the models will allow us to quantify GMS’s effect on the Index’s returns,
effectively measuring the impact of sentiment on the market, up until a couple weeks’ delay.
Secondly, the methodology permits the testing of the consistency and robustness of these
results. As control variables are added to the model we expect the findings regarding GMS to
remain virtually unchanged. Lastly, the inclusion of lags, endorses backing of some broad
conclusions regarding the predictability of returns.
As an additional robustness test on the results, data regarding AGMS variables is used,
30
using Google Trends data which possibly consists in another way to apprehend the same effect.
The same methodology and testing are implemented.
4
Results
4.1 Granger Causality
The next step consists in finding out the type of relation present among the variables in study.
As such, Granger causality tests were applied, considering 1, 2, and 4 lags. With the intention of
reducing printing space, the test itself is not presented in the current paper. This test serves the
purpose of finding the causality relation between variables. To be considered relevant, the
sentiment proxies should Granger Cause PSI-20 returns, and not the other way around, in which
sentiment is caused by returns.
In all models, the null hypothesis that GMSneg does not Granger Cause PSI 20 returns is
rejected, stressing the practicality of Google Trends data in measuring the effect of sentiment
on returns and showing that GMSneg causes and shows explanatory power over returns.
However the same does not happen to the GMSpos. This might comprise evidence that the
negative effect of sentiment, at least as measured by Google data, is more prone to affect
investors, and therefore the market, than its positive counterpart proxy. In fact, Da, et al. (2014)
create their sentiment proxy, FEARS, using only terms which are negatively correlated with
returns, corroborating the notion that negative sentiment as a greater impact on forces that
drive the market. As for the sentiment control variables ESIER, ESIEU, ICE and VSTOXX, they are
31
causality relations become bilateral, has they become both Granger caused and the cause of
returns. Turnover, Abnormal Turnover and Unemployment do not show any causality relation,
while Inflation seems to be Granger caused by Returns, which in turn are caused by GDP.
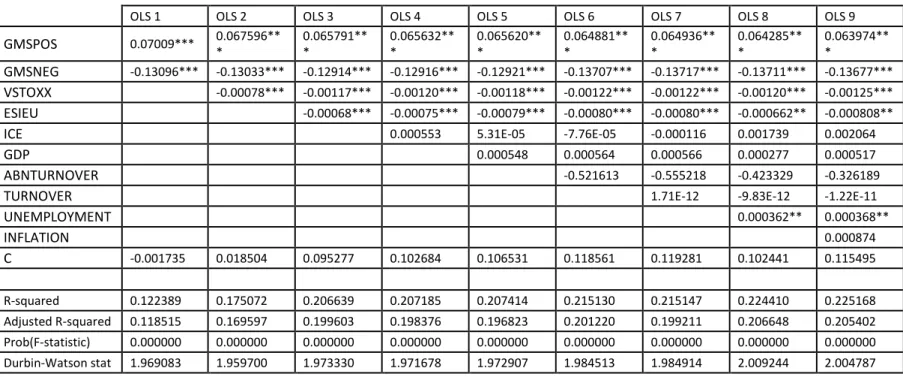
4.2 OLS Estimation
Following this paper’s premise that GMS conveys peoples’ sentiment, the goal is to prove that
these behavioral effect’s influence the financial markets by quantifying the novel proxy’s
explanatory power on the PSI 20 Index returns. Initial focus will be on the simplest regression in
order to gain a broader insight on these variables’ behavior, designating Index returns has the
dependent variable and the rest as contemporaneous explanatory variables, demonstrated as
follows:
𝑃𝑆𝐼20𝑟𝑒𝑡𝑡 = 𝑐 +𝛽1𝐺𝑀𝑆𝑝𝑜𝑠𝑡+ 𝛽2𝐺𝑀𝑆𝑛𝑒𝑔𝑡+ 𝛼𝑖𝐶𝑜𝑛𝑡𝑟𝑜𝑙𝑉𝑎𝑟𝑖𝑎𝑏𝑙𝑒𝑠𝑡+𝜀𝑡
As previously stated, because of the verified correlations between sentiment proxies, the model
only includes ESIEU and ICE. The summarized findings (presented in Table III) seem to support
previous suppositions. GMS show large statistical significance and the correlations are
consistent with what was speculated, GMSpos has a contemporaneous positive correlation with
returns, and GMSneg a negative one. Again, when comparing both proxies, athough both are
statistically significant at 1%,negative sentiment seems to have stronger explanatory power over
returns than positive sentiment, which might reflect its greater impact on market fluctuations,
as anticipated before. VSTOXX, also shows significance and a contemporaneous negative
32
when directly comparing VSTOXX and GMSneg, this last one appears to be a more competent
measure of negative sentiment, presenting higher coefficients and t-stats. The effects endure
notwithstanding the introduction of the control variables.
[Insert Table II]
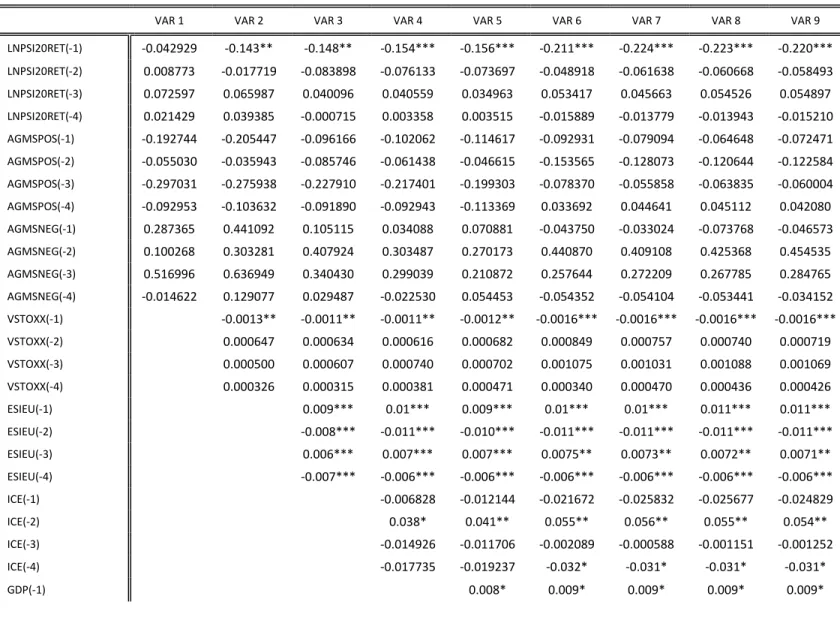
4.3 Vector Autoregressive Model – VAR
These models, shown in Table IV, start with the simplest version of the VAR model including
only GMS variables lagged by two weeks which set the tone for the subsequently more complex
models, to which the remaining control variables will be added one at a time in the same order
as in the OLS testing. The simplest model’s low R-squared value indicates that these sentiment
proxies alone are not enough to explain returns’ movement, also being noteworthy that only
the one week lagged proxies are statistically significant. This, in association with the low
coefficients presented by said variables leads to the belief that sentiment, at least measured by
Google data, although possessing some ability in predicting returns, it is not considered a
particularly determinant factor. Other findings support those previously evidenced by Da, et al.
(2014), attesting the existence of reversals on the relations with returns. Although these authors
deal with daily data, this new approach of weekly lags still yields signal changes, with GMSpos
comprising a negative correlation, and GMSneg a positive one after the first week. The fact that
lagged GMS relations’ inverse in relation with the contemporaneous relation indicates a fast
reversal of sentiment, which could mean that sentiment (with particular emphasis on negative
33
the Portuguese market. Compared to GMSneg, VSTOXX also shows a signal reversal, but at the
second week and not at the first. This can be interpreted has GMSneg being a faster predictor of
sentiment reversals towards the market than VSTOXX . The addition of the control variables
sees the model becoming slightly better at explaining returns and the GMS’ outputs holding
sound.
[Insert Table III]
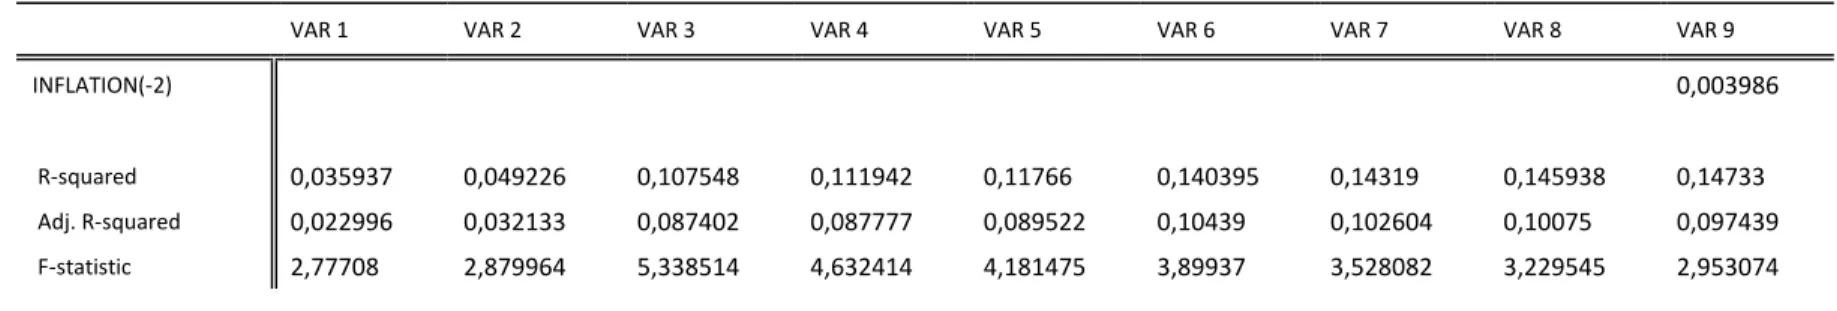
Additionally, the same methodology was applied to a model with 4 lags (Table V) in order to
investigate the same effects over the course of a larger period of time, anticipating the
possibility of supplementary reversals. Here the results seem to appear more inconsistent, with
variables like GMSpos’ signs of correlation changing as more variables are introduced to the
model. However, these peculiar findings are not statistically significant. To note that GMSneg
shows significance at the 10% level in the last regressions, meaning that the reversion ends after
about the 2 week mark. Otherwise, most findings are in line with the 2 week lagged model. GDP
is statistically significant at the time of its introduction onto the model, but loses significance as
more variables are introduced, while the same happens for Sentiment control variables. ESIEU
loses all significance in this new model while although it is close to 90% significance in the first
lag, something that remains true has other variables are introduced and even in the final model.
ICE’s sign and significance remain the same they were in the previous model. VSTOXX shows
significance only at the first lag, somewhat contradicting the 2 lags model. ICE on the other
34
[Insert Table IV]
4.4 AGMS
The same tests as before with are applied with the AGMS variables as the created sentiment
measurement proxies’ in order to test their ability to express market sentiment in Index
Returns, and compare these results with the ones containing the GMS models, turning this into
a supplementary test on its robustness.
The correlation matrix does not suffer any substantial changes since the variables considered
statistically significant with the GMS variables are the same as the ones considering AGMS, also
with the same correlation directions. Meanwhile, the only difference amongst both ways of
calculating sentiment through Google as experienced by the Granger Causality tests is that no
AGMS shows any type of causality with returns. The OLS regressions, behave similar to the
previous models with GMS, with the same evolution has control variables are introduced. The
VAR models go a step further in weakening these proxies since in none of the models they are
significant at the minimal level of 90%. These results seem to be congruent with the idea that
the GMS method of measuring sentiment is more adept at reflecting its effects on returns
compared to the AGMS variables.
35
5
Conclusion
This paper shows that it is possible to use Google Trend’s data to create proxy variables
encompassing investor’s feeling of optimism and pessimism towards the market.
Through a series of statistical procedures a variable composed of data from the amount of
queries performed in Google was created, inferring that it correctly represents individual
investor’s market perception. By means of a series of linear OLS regressions the hypothesis that
this new proxy for market sentiment possesses explanatory power over Psi-20 Index Returns
was proven, and in fact it is more precise when compared with other known market sentiment
proxies, with particular emphasis on Google’s reliability in explaining negative sentiment.
Furthermore, applying similar methodologies to a series of VAR regressions, the results show
that when compared with other sentiment proxies, Google data has the advantage of showing
predictability power over returns, justifying the belief that internet queries can foreshadow
market performance, following the results recognized by Da et al (2014).
These findings can be useful to future research in various topics, from achieving more precise
estimates on consumption, to a better understanding of stock performance or even to reach a
more realistic characterization of investor behavior in economic models. This topic can also be
supported with a more accurate categorization of appropriate queries and update of the search
terms in the creation of an aggregate market sentiment time series. The study can also be
enriched by increasing the range of the study behind the Portuguese and American stock
36
6
Bibliography
Abreu, M., Mendes, V., (2012). Information, Overconfidence and Trading: Do the Sources of
Information Matter?, Journal of Economic Psychology, Vol. 33, Issue 4, pp. 868–881
Aouadi, A., Arouri, M. and Teulon, F. (2013). Investor Attention and Stock Market Activity:
Evidence from France, Economic Modelling, Vol. 35, pp.674-681
Baker, M and Stein, J. (2004). Market liquidity as a sentiment indicator, Journal of Financial
Markets, Vol. 7, Issue 3, pp. 271-299
Baker, M. and Wurgler, J. (2007). Investor Sentiment in the Stock Market. Journal of Economic
Perspectives, Vol.21, Issue 2, pp. 129–151
Bank, M., Larch, M. and Peter, G. (2011). Google Search Volume and Its Influence on Liquidty
and Returns of German Stocks, Financial Markets and Portfolio Management, Vol. 25, Issue 3,
pp. 239-264.
Barber, B. and Odean, T. (2008). All That Glitters: The Effect of Attention and News on the
Buying Behavior of Individual and Institutional Investors, Review of Financial Studies, Vol. 21,
Issue 2, pp. 785-818
Barberis, N., Shleifer, A. and Vishny, R. (1998). A Model of Investor Sentiment, Journal of