ACPD
15, 453–480, 2015The decrease in mid-stratospheric tropical ozone since
1991
G. E. Nedoluha et al.
Title Page
Abstract Introduction
Conclusions References
Tables Figures
◭ ◮
◭ ◮
Back Close
Full Screen / Esc
Printer-friendly Version Interactive Discussion
Discussion
P
a
per
|
Discussion
P
a
per
|
Discussion
P
a
per
|
Discussion
P
a
per
|
Atmos. Chem. Phys. Discuss., 15, 453–480, 2015 www.atmos-chem-phys-discuss.net/15/453/2015/ doi:10.5194/acpd-15-453-2015
© Author(s) 2015. CC Attribution 3.0 License.
This discussion paper is/has been under review for the journal Atmospheric Chemistry and Physics (ACP). Please refer to the corresponding final paper in ACP if available.
The decrease in mid-stratospheric
tropical ozone since 1991
G. E. Nedoluha1, D. E. Siskind1, A. Lambert2, and C. Boone3
1
Naval Research Laboratory, Washington DC, USA
2
Jet Propulsion Laboratory, California Institute of Technology, Pasadena, California, USA
3
Department of Chemistry, University of Waterloo, Waterloo, Ontario, Canada
Received: 10 November 2014 – Accepted: 1 December 2014 – Published: 7 January 2015 Correspondence to: G. E. Nedoluha ([email protected])
ACPD
15, 453–480, 2015The decrease in mid-stratospheric tropical ozone since
1991
G. E. Nedoluha et al.
Title Page
Abstract Introduction
Conclusions References
Tables Figures
◭ ◮
◭ ◮
Back Close
Full Screen / Esc
Printer-friendly Version Interactive Discussion
Discussion
P
a
per
|
Discussion
P
a
per
|
Discussion
P
a
per
|
Discussion
P
a
per
|
Abstract
While global stratospheric O3has begun to recover, there are localized regions where
O3 has decreased since 1991. Specifically, we use measurements from the Halogen
Occultation Experiment (HALOE) for the period 1991–2005 and the NASA/Aura Mi-crowave Limb Sounder (MLS) for the period 2004–2013 to demonstrate a significant 5
decrease in O3 near∼10 hPa in the tropics. O3in this region is very sensitive to
vari-ations in NOy, and the observed decrease can be understood as a spatially local-ized, yet long term increase in NOy. In turn, using data from MLS and from the
Atmo-spheric Chemistry Experiment (ACE), we show that the NOyvariations are caused by
decreases in N2O which are likely linked to long term variations in dynamics. To illus-10
trate how variations in dynamics can affect N2O and O3, we show that by decreasing
the upwelling in the tropics, more of the N2O can photodissociate with a concomitant
increase in NOy production (via N2O+O( 1
D)→2NO) at 10 hPa. Ultimately, this can
cause an O3decrease of the observed magnitude.
1 Introduction
15
The slowdown in the O3decline and the beginnings of recovery of the ozone layer have been documented (Newchurch et al., 2003; Yang et al., 2006). Monitoring of the ozone layer continues to be critical in order to understand ozone recovery as the CFC burden in the stratosphere decreases. A number of observational studies have quantified the global distribution of changes to the O3 layer and revealed distinct patterns and
vari-20
ability which show that O3trends are not spatially uniform. One consistent result is that
over decadal time scales, equatorial O3in a vertical layer near 30 km (corresponding
to ∼10 hPa) often varies very differently from O3 in the rest of the middle to upper stratosphere. Kyrola et al. (2013), using measurements from the Stratospheric Aerosol and Gas Experiment (SAGE) from 1984–1997, show a general decrease in O3which
25
ACPD
15, 453–480, 2015The decrease in mid-stratospheric tropical ozone since
1991
G. E. Nedoluha et al.
Title Page
Abstract Introduction
Conclusions References
Tables Figures
◭ ◮
◭ ◮
Back Close
Full Screen / Esc
Printer-friendly Version Interactive Discussion
Discussion
P
a
per
|
Discussion
P
a
per
|
Discussion
P
a
per
|
Discussion
P
a
per
|
O3(albeit not statistically significant) in the 30–35 km region. Conversely, for the period 1997–2011 Kyrola et al. (2013) show a general increase in O3from SAGE and Global
Ozone Monitoring by Occultation of Stars (GOMOS) measurements, but a statistically significant decrease near 30 km in the tropics. Measurements from the Scanning Imag-ing Absorption Spectrometer for Atmospheric Chartography (SCHIAMACHY) instru-5
ment for the period 2002–2012, reported by Gebhardt et al. (2014), show a pattern similar to the 1997–2011 pattern reported by Kyrola et al. (2013), i.e. a strong statisti-cally significant decrease in tropical O3in the 30–35 km region while most of the middle
atmosphere shows a slight increase in O3. Finally, Eckert et al. (2014) using Michelson
Interferometer for Passive Atmospheric Sounding (MIPAS) data from 2002–2012, also 10
show a general increase in O3 in most regions, but find statistically significant nega-tive trends in the tropics from∼25 to 5 hPa. Eckert et al. (2014) note that increased
upwelling has been suggested as an explanation for ozone decreases, but, in referring to these trends, they conclude that “upwelling does not provide a sufficient explanation for the negative values in the tropical mid-stratosphere.”
15
Ozone at 10 hPa over the equator is particularly sensitive to catalytic cycles involving the odd nitrogen (NOy) chemical family (Olsen et al., 2001; Brasseur and Solomon, 1986). Ravishankara (2009) showed that N2O would be the dominant ozone depleting
substance emitted in the 21st century, and pointed out that nitrogen oxides contribute most to O3 depletion just above where the O3mixing ratios are the largest. Portmann 20
et al. (2012) calculated the effects of a surface boundary increase of 20 ppbv of N2O
(an increase expected over∼20 years in the IPCC A1B scenario) on O3. They showed
that this increase in N2O emission would lead to a global mean decrease of ∼0.5–
0.7 % in O3 just above the peak of the ozone mixing ratio (0.1 DU km− 1
in the 30– 35 km region where O3 has a density of ∼15–20 DU km−
1
based on their Fig. 2). In 25
mixing ratio terms this gives a rate of∼5–7 ppbv yr−1. Plummer et al. (2010) studied
O3 changes in a model including GHGs and ODSs. They show an increase in global
N2O at 10 hPa from∼100 to 140 ppbv at 10 hPa from 1990–2010 while O3increases
ACPD
15, 453–480, 2015The decrease in mid-stratospheric tropical ozone since
1991
G. E. Nedoluha et al.
Title Page
Abstract Introduction
Conclusions References
Tables Figures
◭ ◮
◭ ◮
Back Close
Full Screen / Esc
Printer-friendly Version Interactive Discussion
Discussion
P
a
per
|
Discussion
P
a
per
|
Discussion
P
a
per
|
Discussion
P
a
per
|
circulation result in a decrease in reactive nitrogen in the mid to upper stratosphere relative to the specified increase in surface N2O.
In addition to long-term anthropogenically driven changes, events such as the erup-tion of Mt. Pinatubo may alter the chemistry and dynamics of the stratosphere for ex-tended periods. Aquila (2013) compared a reference model with a model which simu-5
lated the effect of the volcanic aerosols on both chemistry and dynamics. They calcu-lated an increase in O3of∼2 % at 10 hPa in the tropics slightly more than a year after
the eruption, with no strong latitudinal variation.
Previous observational work has correlated O3 interannual variability in the tropics near 10 hPa with changes in specific odd nitrogen compounds; however, these studies 10
were only for relatively short time periods compared with the O3 studies referenced
above. Randel et al. (2000) showed that the Halogen Occultation Experiment (HALOE) observed increasing NO+NO2 coincident with decreasing O3 from 1992–1997, but
that these variations leveled-offduring the last years of HALOE measurements which were then available (1998–2000). The rate of O3decrease from 1992–1996 was faster 15
than 100 ppbv yr−1 just above 10 hPa in the tropics. The HALOE measurements of NO2 at ∼10 hPa from 1993–1997 were shown to be consistent with a decrease in
upward transport (Nedoluha et al., 1998) and increased photolysis of N2O, the source of stratospheric NOy.
The present study extends the previous observational studies with a combination of 20
21 years of ozone data from the UARS HALOE and the Aura Microwave Limb Sounder (MLS) measurements, plus nitrogen species data from HALOE, MLS and the Atmo-spheric Chemistry Experiment (ACE). Our results confirm the existence of the 10 hPa tropical ozone trend anomaly and link it to a correspondingly consistent local change in the nitrogen species which affect O3. The resulting rate of change in O3 and in the
25
ACPD
15, 453–480, 2015The decrease in mid-stratospheric tropical ozone since
1991
G. E. Nedoluha et al.
Title Page
Abstract Introduction
Conclusions References
Tables Figures
◭ ◮
◭ ◮
Back Close
Full Screen / Esc
Printer-friendly Version Interactive Discussion
Discussion
P
a
per
|
Discussion
P
a
per
|
Discussion
P
a
per
|
Discussion
P
a
per
|
2 Measurements from HALOE, Aura MLS, and ACE
We make use of measurements from the HALOE, MLS, and the Fourier transform spectrometer measurements from ACE. HALOE measurements of O3, NO, and NO2
are available from 1991–2005. HALOE used the solar occultation technique which pro-vided∼28–30 profiles per day in two latitude bands, one at sunrise and one at sunset.
5
The latitude bands drifted daily so that near global latitudinal coverage was provided in both sunrise and sunset modes five times over the course of a year. The trends in the HALOE O3measurements have been compared against SAGE II (Nazaryan et al.,
2005) and differences have been found to be on the order of less than 0.3 % yr−1 in a majority of latitude bands at 25, 35, 45, and 55 km.
10
MLS measurements of O3 and N2O are available since 2004. MLS measurements
are available over a global range of latitudes on a daily basis. The stratospheric O3
product has been validated by Froidevaux et al. (2008). The N2O measurements have been validated by Lambert et al. (2007).
Since 2004 ACE has been measuring O3, N2O, and the nitrogen species that
consti-15
tute the bulk of NOy(NO, NO2, HNO3, and N2O5). As a solar occultation instrument it, like HALOE, provides∼28–30 profiles per day in two latitude bands, one at sunrise and
one at sunset. The ACE O3measurements have been validated by Dupuy et al. (2009),
and the NO and NO2measurements were validated by Kerzenmacher et al. (2008).
2.1 The solar cycle and linear trend calculations
20
In cases where species are affected by the solar cycle, one of the challenges in inter-preting decadal scale trends in the stratosphere is separating these trends from solar cycle induced variations. Model studies provide some guidance as to the expected so-lar cycle variations in the species of interest. Egorova et al. (2005) used the SOCOL Chemistry Climate Model (CCM) and found that at 30 km O3was higher at solar
max-25
ACPD
15, 453–480, 2015The decrease in mid-stratospheric tropical ozone since
1991
G. E. Nedoluha et al.
Title Page
Abstract Introduction
Conclusions References
Tables Figures
◭ ◮
◭ ◮
Back Close
Full Screen / Esc
Printer-friendly Version Interactive Discussion
Discussion
P
a
per
|
Discussion
P
a
per
|
Discussion
P
a
per
|
Discussion
P
a
per
|
minimum compared to solar maximum, and no more 4 % from 30–60◦N and 30–60◦S.
Schmidt et al. (2010) used the HAMMONIA general circulation and chemistry model, and found an equatorial O3sensitivity of∼1.4±0.4 %/100 solar flux units (sfu), where
the difference between the 1989 solar max and the 1986 solar min is 166 sfu. The study of Remsberg and Lingenfelser (2010) shows a 3 % ozone maximum-minimum 5
response to the solar cycle at∼35 km (∼7 hPa) from the SAGE II measurements, with
results from the HALOE measurements and from model calculations showing a smaller ozone response to the solar cycle. As discussed in Hood and Soukharev (2006), NOy
in the upper stratosphere is also affected by the solar cycle. They place an upper limit of ∼10 % on the solar cycle variations in NOy in the tropical mid-stratosphere. The
10
model calculations in Egorova et al. (2005) show an NO2solar cycle variation of<1 %,
and Nedoluha et al. (1998) show a similarly small variation from the CHEM2D model (Bacmeister et al., 1998).
Throughout this study we will calculate trends based on a function including terms to fit the annual, semi-annual, QBO, plus a constant term and a linear trend term. The 15
QBO terms were calculated using the Center for Climate Prediction 30 and 50 hPa winds anomalies obtained from www.cpc.ncep.noaa.gov/data/indices/. In addition to these terms we have calculated trends from the HALOE measurements both with and without the inclusion of a solar cycle term, where the solar cycle fit is calculated using the Mg II values obtained from the Lasp Interactive Solar Irradiance Datacenter at 20
lasp.colorado.edu/lisird. We will only show HALOE trend calculations where a solar cycle term has been included, but we have compared trends with and without the solar cycle term and found that the results are similar.
The MLS measurement time series used here extends from 2004–2014, and there-fore clearly does not extend over a full solar cycle. The linear trend calculations from 25
ACPD
15, 453–480, 2015The decrease in mid-stratospheric tropical ozone since
1991
G. E. Nedoluha et al.
Title Page
Abstract Introduction
Conclusions References
Tables Figures
◭ ◮
◭ ◮
Back Close
Full Screen / Esc
Printer-friendly Version Interactive Discussion
Discussion
P
a
per
|
Discussion
P
a
per
|
Discussion
P
a
per
|
Discussion
P
a
per
|
by the presence of a solar cycle we will show some MLS results both with and without the inclusion of a solar cycle term. We will show that in the region of greatest interest, near the tropics at ∼10 hPa, the MLS trends appear to be nearly insensitive to the
presence of a solar cycle.
2.2 Measurements of O3, 1991–2014 5
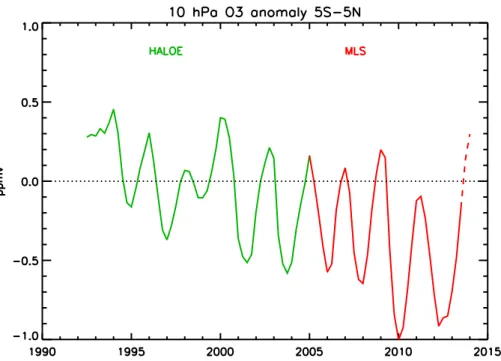
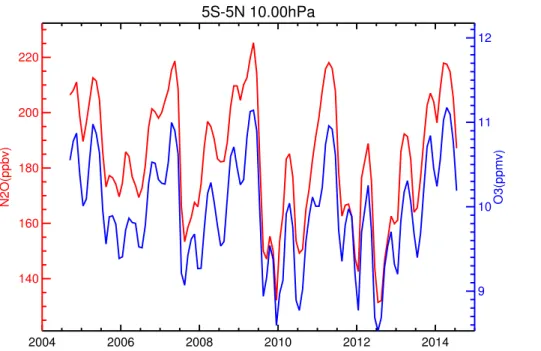
In Fig. 1 we show the annual median O3 anomalies from 5◦S–5◦N as measured by
both HALOE and Aura MLS at 10 hPa. This figure also shows that the O3 decrease
at 10 hPa has occurred gradually over the period shown. There have been numer-ous studies combining O3timeseries from multiple satellites to derive long-term trends
(e.g. Jones et al., 2009; Kyrola et al., 2013), and there are several projects underway 10
to provide long-term data records of stratospheric composition, so we will not attempt here to produce a combined HALOE-MLS O3 timeseries for trend calculations. The
MLS timeseries anomalies shown have simply been offset by a shift in mixing ratio so that the anomaly point for 2005 (which covers data taken during the period July 2004 through June 2005) agrees with the HALOE anomaly at that point. The anomalies 15
are calculated by fitting annual and semi-annual cycles to each dataset separately and then calculating annual median differences from this fit. The annual anomaly is sampled four times per year so that each point represents an anomaly over either January–December, April–March, July–June, or October–September. Each measure-ment is therefore included in four data points in the figure. Having removed the annual 20
cycle, the primary variation in O3 in this region is caused by the QBO. In addition to these QBO variations there is a clear decrease in O3over the 21 years shown.
An estimate of the uncertainty in these annual medians can be obtained from the SD of the individual anomalies. The average value ofσ/n1/2for the annual median HALOE O3anomalies is 0.026 ppmv. The last annual anomaly has the largest uncertainty with
25
ACPD
15, 453–480, 2015The decrease in mid-stratospheric tropical ozone since
1991
G. E. Nedoluha et al.
Title Page
Abstract Introduction
Conclusions References
Tables Figures
◭ ◮
◭ ◮
Back Close
Full Screen / Esc
Printer-friendly Version Interactive Discussion
Discussion
P
a
per
|
Discussion
P
a
per
|
Discussion
P
a
per
|
Discussion
P
a
per
|
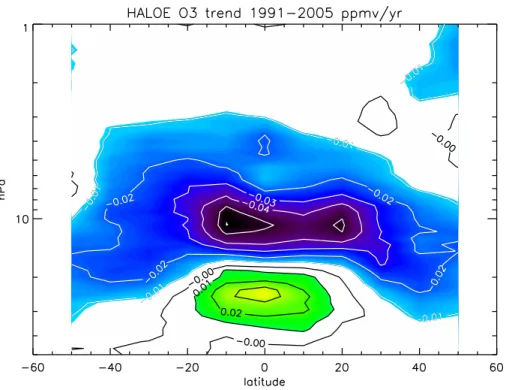
In Fig. 2 we show the linear trend in the global HALOE ozone measurements from 1991–2005. The trend is negative (i.e. O3 is decreasing) near∼10 hPa with the most
negative values occurring in the tropics. Most of this study will focus primarily on the causes of this O3decrease in this region. In general the results are very similar whether or not a solar cycle is included in the fit, but the local tropical minimum at∼4 hPa does
5
not appear when such a term is not included.
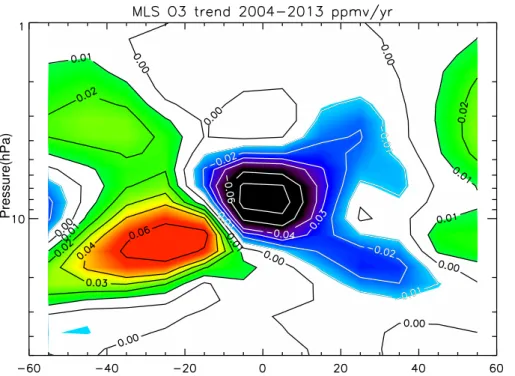
HALOE measurements ceased in 2005, and Aura MLS has been providing O3 mea-surements since 2004. In Fig. 3 we show the linear trend in O3 as measured by MLS.
MLS shows that the negative ozone trend in the tropics near∼10 hPa continued from
August 2004 to June 2013. Inclusion of the most recent MLS data (from July 2013 to 10
September 2014) does not result in a qualitative change in Fig. 3, but does reduce the magnitude of the measured trends. Again, the O3 linear trends shown in Fig. 3 have
been calculated with a solar cycle included in the fit, but the results are very similar with and without a solar cycle term. Several other datasets have also shown decreasing O3 near 10 hPa in the tropics. Kyrola et al. (2013) has shown a decrease for 1997–2011 15
from SAGE and GOMOS, Gebhardt et al. (2014) for 2002–2012 using measurements from SCIAMACHY, and Eckert et al. (2014) for 2002–2012 using MIPAS measure-ments. There is some overlap between the negative HALOE O3 trend (1991–2005)
and the positive SAGE O3 trend shown by (Kyrola et al., 2013) (1984–1997). Given
the excellent agreement between SAGE II and HALOE trends (e.g. Nazaryan et al., 20
2005), and the eruption of Mt. Pinatubo near the middle of the 1984–1997 timeseries, we expect this difference between the 1984–1997 and 1991–2005 trends is caused by a real change in O3trends in the tropical 10 hPa region in between 1991 and 1997.
While Fig. 1 shows a general decrease in O3 at 10 hPa over the entire HALOE
measurement period, and Fig. 3 shows that this trend continued into the MLS mea-25
ACPD
15, 453–480, 2015The decrease in mid-stratospheric tropical ozone since
1991
G. E. Nedoluha et al.
Title Page
Abstract Introduction
Conclusions References
Tables Figures
◭ ◮
◭ ◮
Back Close
Full Screen / Esc
Printer-friendly Version Interactive Discussion
Discussion
P
a
per
|
Discussion
P
a
per
|
Discussion
P
a
per
|
Discussion
P
a
per
|
increase in O3 at Southern mid-latitudes, and a smaller decrease at similar pressure levels in Northern mid-latitudes.
Just as the HALOE and MLS trends show clear differences away from the tropics, they also show clear differences in the tropics at other levels. The 1991–2005 HALOE trend shows an increase in tropical O3near 30 hPa, but this is dominated by the strong
5
increase from∼1991–1999, followed by a period of stability in this region from 1999–
2005. The MLS O3measurements suggest that this period of stability near 30 hPa con-tinues through 2013. However Gebhardt et al. (2014) do show statistically significant O3increases in the 2002–2012 SCIAMACHY measurements below 30 km with two
lo-cal maxima, one near 22 km and one near 27 km, while Eckert et al. (2014) show an O3 10
increase from 2002–2012 near 22 km (∼50 hPa) but a decrease near 27 km (∼25 hPa)
from the MIPAS measurements. In their 1984–1997 O3trends Kyrola et al. (2013) show
an increase at 24 km, but a much larger decrease at 21 km. Thus, while several mea-surements show decadal scale tropical trends near 10 hPa, such trends to not appear to be common near 30 hPa, nor at other latitudes near 10 hPa.
15
2.3 The effect of changes in nitrogen species on ozone
As noted above, O3in the tropical mid-stratosphere is particularly sensitive to changes in NOy which result from photodissociation and oxidation of N2O (Olsen et al., 2001), and long-term increases in anthropogenic N2O emission are expected to play a
sig-nificant role in causing futuredecreases in O3 (Portman et al., 2012). However, N2O
20
is also a sensitive indicator of upward transport and, as we show below, these vari-ations in transport lead to a positive, not negative correlation between N2O and O3.
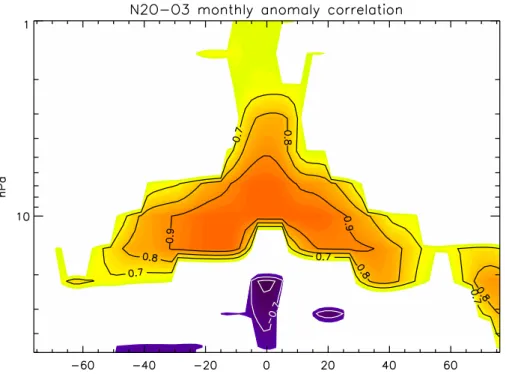
Figure 4 presents the correlation between MLS N2O and O3 from 2004–2013. These
correlations are calculated by first finding a zonal monthly median for each year of MLS data and then subtracting from each of these the average MLS monthly median 25
ACPD
15, 453–480, 2015The decrease in mid-stratospheric tropical ozone since
1991
G. E. Nedoluha et al.
Title Page
Abstract Introduction
Conclusions References
Tables Figures
◭ ◮
◭ ◮
Back Close
Full Screen / Esc
Printer-friendly Version Interactive Discussion
Discussion
P
a
per
|
Discussion
P
a
per
|
Discussion
P
a
per
|
Discussion
P
a
per
|
clearly present on seasonal and interannual timescales and rules out an anthropogenic increase in N2O as the cause of the long term ozone decreases we observe.
This positive correlation between N2O and O3 in the tropical middle stratosphere
can be readily understood in the context of the relationship between N2O, NOyand O3.
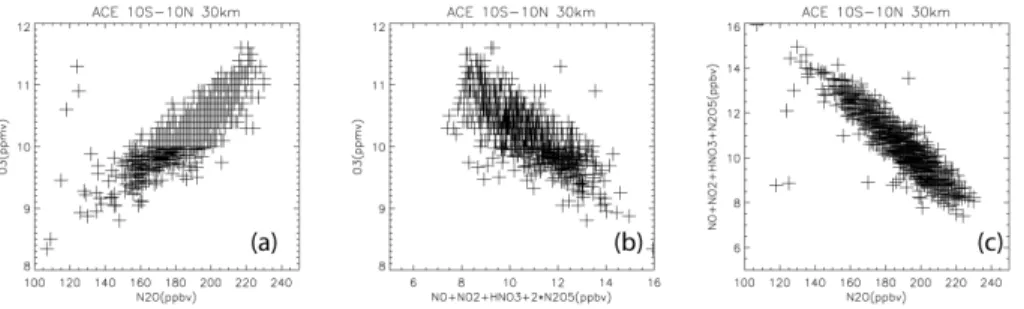
This is demonstrated in Fig. 6 which presents ACE measurements of O3, N2O and the 5
species which make up the bulk of NOy at 30 km (∼10 hPa) from 10◦S–10◦N. While
ACE does not provide the daily measurement coverage in the tropics obtained by MLS, it does measure all of the species relevant to the nitrogen chemistry which determines O3near∼10 hPa in the tropics. Like MLS, ACE shows a strong positive correlation
be-tween N2O and ozone. ACE also shows the expected anticorrelation resulting from the
10
chemistry of O3and NOy. Figure 6c shows the anti-correlation between NOyand N2O
without which the correlation between N2O and O3would not exist. This anti-correlation of N2O and NOycan be understood as a coupled chemical/dynamical effect. During
pe-riods when upward transport is slower, more N2O at a given altitude is dissociated, thus
producing more NOyat that altitude. We thus conclude that over the period of the MLS 15
measurements the effect of changes in transport on N2O in this region on NOy and
hence O3dominate any increase in N2O due to changing tropospheric emissions.
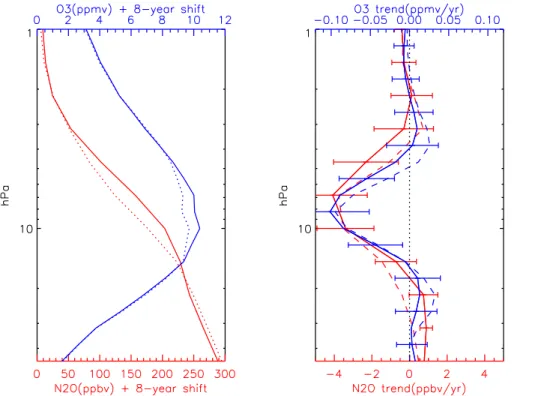
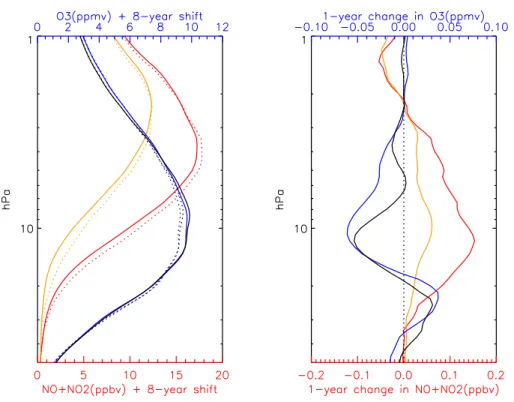
As indicated in Sect. 2.1, the MLS instrument has been operational for less than a full solar cycle; hence for tropical trend calculations we show results both with and without the inclusion of a solar cycle term. In Fig. 7 we show the calculated profiles 20
as a function of pressure as derived from eight (constant term, two annual terms, two semi-annual terms, two QBO terms, and a linear trend) and nine (including a solar cycle) parameter fits to the monthly median MLS measurements. Figure 7 shows the profiles (the constant terms from the fits) in addition to the linear trend and the net effect of 8 years of such a trend (2004/05 vs. 2012/13). The O3 trend results are in good
25
agreement with those shown by Gebhardt et al. (2013) for August 2004–April 2012, where the fastest decreasing trend in MLS O3is∼7 % decade−1. Gebhardt et al. (2013)
show that the MLS trends in O3 are not statistically different from those observed by
ACPD
15, 453–480, 2015The decrease in mid-stratospheric tropical ozone since
1991
G. E. Nedoluha et al.
Title Page
Abstract Introduction
Conclusions References
Tables Figures
◭ ◮
◭ ◮
Back Close
Full Screen / Esc
Printer-friendly Version Interactive Discussion
Discussion
P
a
per
|
Discussion
P
a
per
|
Discussion
P
a
per
|
Discussion
P
a
per
|
affect the linear trend at some levels, it does not alter the qualitative result that O3and N2O both show a statistically significant decrease over a similar range of pressures
near 10 hPa. This further reinforces the conclusion that this decrease in O3 is caused
by an increase in NOy(resulting from increased dissociation of N2O) during this period. As was shown in Fig. 2, HALOE measurements showed a decrease in O3from 1992–
5
2005 at 10 hPa from 5◦S–5◦N. While HALOE did not provide measurements of N2O,
and did not provide the full complement of NOy species that is available from ACE, it did provide measurements of two of the key odd-nitrogen species, NO and NO2.
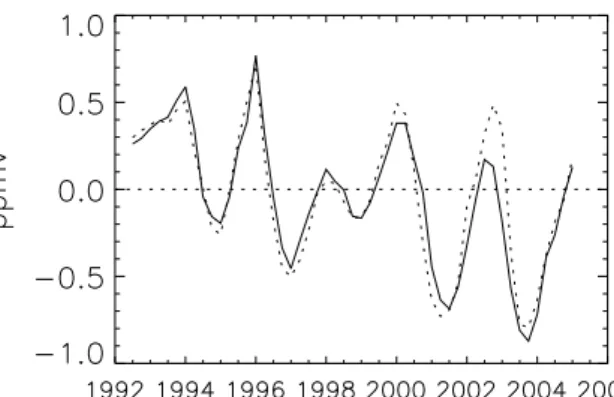
In Fig. 8 we show annual median HALOE anomalies in O3 alongside those of
NO+NO2. Because NO+NO2has a strong diurnal component (unlike the set of NOy 10
measurements provided by ACE), the anomalies for both species are calculated sepa-rately for sunrise and sunset measurements. We have multiplied the sunset NO+NO2
measurements by 0.4 so that they fit onto the same scale as the sunrise measure-ments. The average (maximum) σ/n1/2 value for sunrise NO+NO2 is 0.064 ppbv
(0.082 ppbv), while for the sunset measurements (before multiplication by 0.4) it is 15
0.122 ppbv (0.22 ppbv). For the O3 sunrise measurements the average (maximum)
σ/n1/2 value is 0.045 ppmv (0.064 ppmv), while for the sunset measurements it is 0.049 ppmv (0.081 ppmv).
Figure 8 shows that NO+NO2 generally was increasing over the course of the
HALOE measurements and that this increase tracked the ozone decrease, both on 20
a year-to-year timescale (dominated by the quasi-biennial oscillation, QBO) and over the full 1992–2005 time period. There is a slight (∼3 month) apparent phase-lag
be-tween the sunset and sunrise NO+NO2 measurements from ∼1998–2003 which is
not apparent in the O3 anomalies and for which we have no explanation. With the exception of this feature, the general consistency between the QBO driven variations 25
in O3 and NO+NO2, and the trend which is apparent in both the O3 and NO+NO2
measurements, provides added confidence that the decrease in O3 and the increase
ACPD
15, 453–480, 2015The decrease in mid-stratospheric tropical ozone since
1991
G. E. Nedoluha et al.
Title Page
Abstract Introduction
Conclusions References
Tables Figures
◭ ◮
◭ ◮
Back Close
Full Screen / Esc
Printer-friendly Version Interactive Discussion
Discussion
P
a
per
|
Discussion
P
a
per
|
Discussion
P
a
per
|
Discussion
P
a
per
|
suggests a slowdown in upward transport in this region from 1992–2005. Note, this is consistent with the results of Nedoluha et al. (1998) who interpreted the decreases in upper stratospheric CH4from 1992–1996 as linked with a simultaneous increase in
NO2at 30 km. Our results here extend that early result to encompass the entire 13 year UARS mission.
5
In Fig. 9 we show the calculated linear trends in the HALOE O3and NO+NO2
mea-surements. As in Fig. 8 we separate the HALOE sunrise and sunset measurements, and calculate trends for four separate measurements: sunrise and sunset O3and
sun-rise and sunset NO+NO2. Encouragingly, despite having very different vertical profiles,
the shape of the sunrise and sunset NO+NO2 trend profiles are very similar. The O3 10
sunrise and sunset trends also agree well, and the pressure level of the minimum of the observed decrease in these O3measurements corresponds closely with the maximum
in the observed increase in the NO+NO2measurements.
3 Model calculations
In order to better understand the changes in the observed species we have em-15
ployed the two-dimensional chemical transport model (CHEM2D) (Bacmeister et al., 1998). The model includes parameterized gravity wave and planetary wave drag and is ideal for understanding tracer transport and the response of the global middle at-mospheric circulation to external forcings. Compared with those earlier studies, the present model’s vertical resolution has been doubled to 1 km. CHEM2D’s most recent 20
applications have included simulating the solar cycle variations of polar mesospheric clouds (Siskind et al., 2005) and studying the response of stratospheric ozone to both the solar cycle and the tropical quasi-biennial oscillation (McCormack et al., 2007).
We will show results from two model runs, each of which has been integrated for 12 years to ensure stability from year-to-year. Since the goal of the model was to test 25
ACPD
15, 453–480, 2015The decrease in mid-stratospheric tropical ozone since
1991
G. E. Nedoluha et al.
Title Page
Abstract Introduction
Conclusions References
Tables Figures
◭ ◮
◭ ◮
Back Close
Full Screen / Esc
Printer-friendly Version Interactive Discussion
Discussion
P
a
per
|
Discussion
P
a
per
|
Discussion
P
a
per
|
Discussion
P
a
per
|
added a small heat source of 0.3 K day−1, centered at 18 km at the equator, similar to Experiment 7 of Bacmeister et al. (1998). In addition, we recognize that the model dif-ferences shown represent two equilibrium solutions while the calculated trends show the effects of an atmosphere changing over time. Nonetheless, a comparison of these two models can serve as an indication whether it is possible to reproduce the observed 5
changes in the measured species with a dynamical perturbation.
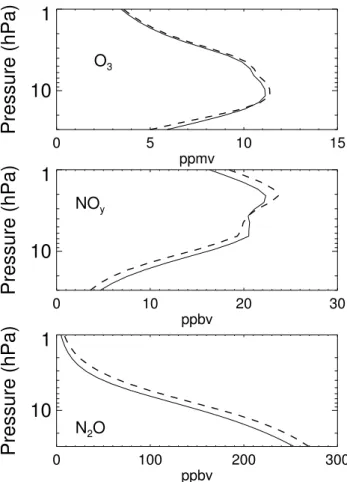
Figure 10 shows the change in N2O, NOy, and O3 at the equator resulting from
this dynamical perturbation. The N2O chemistry is relatively simple, and N2O at all
levels is lower for the case of the slower tropical ascent which offers more time for dissociation. At 10 hPa the case with the slower ascent shows ∼20 ppbv less N2O.
10
Unlike the measurements, however, the N2O in the model changes over a deep layer,
covering the entire pressure range from 50–1 hPa.
Figure 10 also shows the calculated O3 and NOy profile changes at the
equa-tor for the same two model runs. Between 5–15 hPa and including the peak of the layer, the baseline model with less heating shows ∼0.3 ppmv less O3, and the
to-15
tal NOy is higher. The increase NOy results from increased photodissociation of N2O
via N2O+O(1D)→2NO. The ratio of the O3 and N2O changes (∼20 ppbv) in the
model are qualitatively similar to the trends in the MLS observations near ∼10 hPa
(∼0.1 ppmv yr−1 for O3, ∼4 ppbv yr− 1
for N2O). Similarly, we can qualitatively
com-pare the HALOE O3and NOxdifferences in the two model runs. The largest decrease
20
in HALOE O3 is ∼0.06 ppmv yr−1, which is accompanied by a sunset NOx trend of
∼0.16 ppbv yr−1. The ratios of measured O3change relative to NOxchange is
qualita-tively similar to the ratio of the model change in O3(∼0.3 ppmv) to the model change in
NOy(∼1.9 ppbv). The qualitative agreement between models and both the HALOE and
MLS measurements supports the idea that the observed O3change can be caused by
25
a dynamical perturbation.
While the model runs do support the suggestion that the changes in O3 and N2O observed near the equator at ∼10 hPa can be caused by a dynamical perturbation,
ACPD
15, 453–480, 2015The decrease in mid-stratospheric tropical ozone since
1991
G. E. Nedoluha et al.
Title Page
Abstract Introduction
Conclusions References
Tables Figures
◭ ◮
◭ ◮
Back Close
Full Screen / Esc
Printer-friendly Version Interactive Discussion
Discussion
P
a
per
|
Discussion
P
a
per
|
Discussion
P
a
per
|
Discussion
P
a
per
|
other regions where the measured trends are small and/or vary in a temporally different manner than do the tropical 10 hPa measurements. No doubt a number of dynamical changes affected N2O over the period 1991–2013, and these variations drove changes
in NOxand in turn O3. What we conclude here is that, because of changes in transport, the N2O which arrived in this region experienced significantly more dissociation in 2013
5
than in 2004, and, based on inferences from the HALOE O3and NOx measurements,
that this trend was also present throughout much of the HALOE measurement period.
4 Summary
Ozone measurements from HALOE and MLS show a long-term decrease in O3in the
tropical mid-stratosphere near the peak of the O3mixing ratio. O3in this region is very 10
sensitive to variations in NOy, and the observed decrease in O3can be understood in
terms of the effects of increasing NOy. From MLS and ACE measurements we
con-clude that the NOy variations are the result of a decrease in N2O from 1992–2012 resulting from changes in the dynamics over this period. Using a 2-D model, we show that a perturbation of the dynamics results in changes in N2O, NOy, and O3which are
15
qualitatively consistent with the observed trends.
A feature of particular interest for future work is the increase in O3 observed in the
Southern Hemisphere mid-stratosphere by MLS. Both the overall increase in O3in this
region as well as the short-timescale variations are well correlated with changes in N2O, suggesting that this O3variation is also dynamically controlled.
20
Acknowledgements. This project was funded by NASA under the Upper Atmosphere
Re-search Program, by the Naval ReRe-search Laboratory, and by the Office of Naval Research. Work at the Jet Propulsion Laboratory, California Institute of Technology, was carried out un-der a contract with the National Aeronautics and Space Administration. MLS and HALOE data are available from the NASA Goddard Earth Science Data Information and Services Center
25
ACPD
15, 453–480, 2015The decrease in mid-stratospheric tropical ozone since
1991
G. E. Nedoluha et al.
Title Page
Abstract Introduction
Conclusions References
Tables Figures
◭ ◮
◭ ◮
Back Close
Full Screen / Esc
Printer-friendly Version Interactive Discussion
Discussion
P
a
per
|
Discussion
P
a
per
|
Discussion
P
a
per
|
Discussion
P
a
per
|
References
Aquila, V., Oman, L. D., Stolarski, R., Douglass, A. R., and Newman, P. A.: The response of ozone and nitrogen dioxide to the eruption of Mt. Pinatubo at southern and northern midlati-tudes, J. Atmos. Sci., 70, 894–900, 2013.
Bacmeister, J. T., Siskind, D. E., Summers, M. E., and Eckermann, S. D.: Age of air in a zonally
5
averaged two-dimensional model, J. Geophys. Res., 103, 11263–11288, 1998.
Brasseur, G. P. and Solomon, S.: Aeronomy of the Middle Atmosphere, D. Reidel press, 1986. Dupuy, E., Walker, K. A., Kar, J., Boone, C. D., McElroy, C. T., Bernath, P. F., Drummond, J. R.,
Skelton, R., McLeod, S. D., Hughes, R. C., Nowlan, C. R., Dufour, D. G., Zou, J., Nichitiu, F., Strong, K., Baron, P., Bevilacqua, R. M., Blumenstock, T., Bodeker, G. E., Borsdorff, T.,
10
Bourassa, A. E., Bovensmann, H., Boyd, I. S., Bracher, A., Brogniez, C., Burrows, J. P., Catoire, V., Ceccherini, S., Chabrillat, S., Christensen, T., Coffey, M. T., Cortesi, U., Davies, J., De Clercq, C., Degenstein, D. A., De Mazière, M., Demoulin, P., Dodion, J., Firanski, B., Fis-cher, H., Forbes, G., Froidevaux, L., Fussen, D., Gerard, P., Godin-Beekmann, S., Goutail, F., Granville, J., Griffith, D., Haley, C. S., Hannigan, J. W., Höpfner, M., Jin, J. J., Jones, A.,
15
Jones, N. B., Jucks, K., Kagawa, A., Kasai, Y., Kerzenmacher, T. E., Kleinböhl, A., Kleko-ciuk, A. R., Kramer, I., Küllmann, H., Kuttippurath, J., Kyrölä, E., Lambert, J.-C., Livesey, N. J., Llewellyn, E. J., Lloyd, N. D., Mahieu, E., Manney, G. L., Marshall, B. T., McConnell, J. C., Mc-Cormick, M. P., McDermid, I. S., McHugh, M., McLinden, C. A., Mellqvist, J., Mizutani, K., Mu-rayama, Y., Murtagh, D. P., Oelhaf, H., Parrish, A., Petelina, S. V., Piccolo, C., Pommereau,
J.-20
P., Randall, C. E., Robert, C., Roth, C., Schneider, M., Senten, C., Steck, T., Strandberg, A., Strawbridge, K. B., Sussmann, R., Swart, D. P. J., Tarasick, D. W., Taylor, J. R., Tétard, C., Thomason, L. W., Thompson, A. M., Tully, M. B., Urban, J., Vanhellemont, F., Vigouroux, C., von Clarmann, T., von der Gathen, P., von Savigny, C., Waters, J. W., Witte, J. C., Wolff, M., and Zawodny, J. M.: Validation of ozone measurements from the Atmospheric Chemistry
25
Experiment (ACE), Atmos. Chem. Phys., 9, 287–343, doi:10.5194/acp-9-287-2009, 2009. Eckert, E., von Clarmann, T., Kiefer, M., Stiller, G. P., Lossow, S., Glatthor, N., Degenstein, D. A.,
Froidevaux, L., Godin-Beekmann, S., Leblanc, T., McDermid, S., Pastel, M., Steinbrecht, W., Swart, D. P. J., Walker, K. A., and Bernath, P. F.: Drift-corrected trends and periodic vari-ations in MIPAS IMK/IAA ozone measurements, Atmos. Chem. Phys., 14, 2571–2589,
30
ACPD
15, 453–480, 2015The decrease in mid-stratospheric tropical ozone since
1991
G. E. Nedoluha et al.
Title Page
Abstract Introduction
Conclusions References
Tables Figures
◭ ◮
◭ ◮
Back Close
Full Screen / Esc
Printer-friendly Version Interactive Discussion
Discussion
P
a
per
|
Discussion
P
a
per
|
Discussion
P
a
per
|
Discussion
P
a
per
|
Egorova, T., Rozanov, E., Zubov, V., Schmutz, W., and Peter, Th.: Influence of solar 11-year variability on chemical composition of the stratosphere and mesosphere simulated with a chemistry–climate model, Adv. Space Res., 35, 451–457, 2005.
Froidevaux, L., Jiang, Y. B., Lambert, A., Livesey, N. J., Read, W. G., Waters, J. W., Browell, E. V., Hair, J. W., Avery, M. A., McGee, T. J., Twigg, L. W., Sumnicht, G. K., Jucks, K. W.,
5
Margitan, J. J., Sen, B., Stachnik, R. A., Toon, G. C., Bernath, P. F., Boone, C. D., Walker, K. A., Filipiak, M. J., Harwood, R. S., Fuller, R. A., Manney, G. L., Schwartz, M. J., Daf-fer, W. H., Drouin, B. J., Cofield, R. E., Cuddy, D. T., Jarnot, R. F., Knosp, B. W., Perun, V. S., Snyder, W. V., Stek, P. C., Thurstans, R. P., and Wagner, P. A.: Validation of Aura Mi-crowave Limb Sounder stratospheric ozone measurements, J. Geophys. Res., 113, D15S20,
10
doi:10.1029/2007JD008771, 2008.
Gebhardt, C., Rozanov, A., Hommel, R., Weber, M., Bovensmann, H., Burrows, J. P., De-genstein, D., Froidevaux, L., and Thompson, A. M.: Stratospheric ozone trends and vari-ability as seen by SCIAMACHY from 2002 to 2012, Atmos. Chem. Phys., 14, 831–846, doi:10.5194/acp-14-831-2014, 2014.
15
Jones, A., Urban, J., Murtagh, D. P., Eriksson, P., Brohede, S., Haley, C., Degenstein, D., Bourassa, A., von Savigny, C., Sonkaew, T., Rozanov, A., Bovensmann, H., and Burrows, J.: Evolution of stratospheric ozone and water vapour time series studied with satellite measure-ments, Atmos. Chem. Phys., 9, 6055–6075, doi:10.5194/acp-9-6055-2009, 2009.
Kerzenmacher, T., Wolff, M. A., Strong, K., Dupuy, E., Walker, K. A., Amekudzi, L. K.,
Batch-20
elor, R. L., Bernath, P. F., Berthet, G., Blumenstock, T., Boone, C. D., Bramstedt, K., Brog-niez, C., Brohede, S., Burrows, J. P., Catoire, V., Dodion, J., Drummond, J. R., Dufour, D. G., Funke, B., Fussen, D., Goutail, F., Griffith, D. W. T., Haley, C. S., Hendrick, F., Höpfner, M., Huret, N., Jones, N., Kar, J., Kramer, I., Llewellyn, E. J., López-Puertas, M., Manney, G., McElroy, C. T., McLinden, C. A., Melo, S., Mikuteit, S., Murtagh, D., Nichitiu, F., Notholt, J.,
25
Nowlan, C., Piccolo, C., Pommereau, J.-P., Randall, C., Raspollini, P., Ridolfi, M., Richter, A., Schneider, M., Schrems, O., Silicani, M., Stiller, G. P., Taylor, J., Tétard, C., Toohey, M., Vanhellemont, F., Warneke, T., Zawodny, J. M., and Zou, J.: Validation of NO2 and NO from the Atmospheric Chemistry Experiment (ACE), Atmos. Chem. Phys., 8, 5801–5841, doi:10.5194/acp-8-5801-2008, 2008.
30
ACPD
15, 453–480, 2015The decrease in mid-stratospheric tropical ozone since
1991
G. E. Nedoluha et al.
Title Page
Abstract Introduction
Conclusions References
Tables Figures
◭ ◮
◭ ◮
Back Close
Full Screen / Esc
Printer-friendly Version Interactive Discussion
Discussion
P
a
per
|
Discussion
P
a
per
|
Discussion
P
a
per
|
Discussion
P
a
per
|
trend analysis of the vertical distribution of ozone, Atmos. Chem. Phys., 13, 10645–10658, doi:10.5194/acp-13-10645-2013, 2013.
Lambert, A., Read, W. G., Livesey, N. J., Santee, M. L., Manney, G. L., Froidevaux, L., Wu, D. L., Schwartz, M. J., Pumphrey, H. C., Jimenez, C. G., Nedoluha, E., Cofield, R. E., Cuddy, D. T., Daffer, W. H., Drouin, B. J., Fuller, R. A., Jarnot, R. F., Knosp, B. W., Pickett, H. M.,
5
Perun, V. S., Snyder, W. V., Stek, P. C., Thurstans, R. P., Wagner, P. A., Waters, J. W., Jucks, K. W., Toon, G. C., Stachnik, R. A., Bernath, P. F.,Boone, C. D., Walker, K. A., Urban, J. D., Murtagh, J., Elkins, W., and Atlas, E.: Validation of the Aura Microwave Limb Sounder middle atmosphere water vapor and nitrous oxide measurements, J. Geophys. Res., 112, D24S36, doi:10.1029/2007JD008724, 2007.
10
McCormack, J. P., Siskind, D. E., and Hood, L. L.: Solar-QBO interaction and its impact on stratospheric ozone in a zonally averaged photochemical transport model of the middle at-mosphere, J. Geophys. Res., 112, D16109, doi:10.1029/2006JD008369, 2007.
Nazaryan, H., McCormick, M. P., and Russell III, J. M.: New studies of SAGE II and HALOE ozone profile and long-term change comparisons, J. Geophys. Res., 110, D09305,
15
doi:10.1029/2004JD005425, 2005.
Nedoluha, G. E., Siskind, D. E., Bacmeister, J. T., Bevilacqua, R. M., and Russell III, J. M.: Changes in upper stratospheric CH4and NO2as measured by HALOE and implications for changes in transport, Geophys. Res. Lett., 25, 987–990, 1998.
Newchurch, M. J., Yang, E.-S., Cunnold, D. M., Reinsel, G. C., Zawodny, J. M., and Russell
20
III, J. M.: Evidence for slowdown in stratospheric ozone loss: first stage of ozone recovery, J. Geophys. Res., 108, 4507, doi:10.1029/2003JD003471, 2003.
Olsen, S. C., McLinden, C. A., and Prather, M. J.: Stratospheric N2O–NOy system: testing uncertainties in a three-dimensional framework, J. Geophys. Res., 106, 28771–28784, 2001. Plummer, D. A., Scinocca, J. F., Shepherd, T. G., Reader, M. C., and Jonsson, A. I.:
Quantify-25
ing the contributions to stratospheric ozone changes from ozone depleting substances and greenhouse gases, Atmos. Chem. Phys., 10, 8803–8820, doi:10.5194/acp-10-8803-2010, 2010.
Portmann, R. W., Daniel, J. S., and Ravishankara, A. R.: Stratospheric ozone depletion due to nitrous oxide: influences of other gases, Philos. T. R. Soc. B, 367, 1256–1264,
30
doi:10.1098/rstb.2011.0377, 2012.
ACPD
15, 453–480, 2015The decrease in mid-stratospheric tropical ozone since
1991
G. E. Nedoluha et al.
Title Page
Abstract Introduction
Conclusions References
Tables Figures
◭ ◮
◭ ◮
Back Close
Full Screen / Esc
Printer-friendly Version Interactive Discussion
Discussion
P
a
per
|
Discussion
P
a
per
|
Discussion
P
a
per
|
Discussion
P
a
per
|
Science Across the Stratopause, Geophys. Monogr. Ser., vol. 123, American Geophysical Union, Washington DC, 271–285, 2000.
Ravishankara, A. R., Daniel, J. S., and Portmann, R. W.: Nitrous oxide (N2O): the dominant ozone-depleting substance emitted in the 21st century, Science, 326, 123, doi:10.1126/science.1176985, 2009.
5
Remsberg, E. and Lingenfelser, G.: Analysis of SAGE II ozone of the middle and upper strato-sphere for its response to a decadal-scale forcing, Atmos. Chem. Phys., 10, 11779–11790, doi:10.5194/acp-10-11779-2010, 2010.
Schmidt, H., Brasseur, G. P., and Giorgetta, M. A.: Solar cycle signal in a general circulation and chemistry model with internally generated quasi-biennial oscillation, J. Geophys. Res.,
10
115, D00I14, doi:10.1029/2009JD012542, 2010.
Siskind, D. E., Stevens, M. H., and Englert, C. R.: A model study of global variability in meso-spheric cloudiness, J. Atmos. Sol.-Terr. Phy., 67, 501–513, 2005.
Yang, E.-S., Cunnold, D. M., Salawitch, R. J., McCormick, M. P., Russell III, J. M., Za-wodny, J. M., Oltmans, S., and Newchurch, M. J.: Attribution of recovery in lower stratospheric
15
ACPD
15, 453–480, 2015The decrease in mid-stratospheric tropical ozone since
1991
G. E. Nedoluha et al.
Title Page
Abstract Introduction
Conclusions References
Tables Figures
◭ ◮
◭ ◮
Back Close
Full Screen / Esc
Printer-friendly Version Interactive Discussion
Discussion
P
a
per
|
Discussion
P
a
per
|
Discussion
P
a
per
|
Discussion
P
a
per
|
Figure 2.The calculated linear trend in HALOE ozone for 1991–2005. The HALOE data has been sorted into eleven 10◦latitude bins from 55◦S to 55◦N. Regions where the magnitude of the trend is<0.01 ppmv yr−1
ACPD
15, 453–480, 2015The decrease in mid-stratospheric tropical ozone since
1991
G. E. Nedoluha et al.
Title Page
Abstract Introduction
Conclusions References
Tables Figures
◭ ◮
◭ ◮
Back Close
Full Screen / Esc
Printer-friendly Version Interactive Discussion
Discussion
P
a
per
|
Discussion
P
a
per
|
Discussion
P
a
per
|
Discussion
P
a
per
|
Pressure(hPa)
Figure 3.The O3linear trend calculated from MLS data from August 2004–May 2013. Contour lines are shown at±0.01, 0.02, 0.03, 0.04, 0.06, 0.08 ppmv yr−1. The MLS data has been sorted into twelve 10◦ latitude bins from 60◦S to 60◦N. Regions where the magnitude of the trend is
<0.01 ppmv yr−1
ACPD
15, 453–480, 2015The decrease in mid-stratospheric tropical ozone since
1991
G. E. Nedoluha et al.
Title Page
Abstract Introduction
Conclusions References
Tables Figures
◭ ◮
◭ ◮
Back Close
Full Screen / Esc
Printer-friendly Version Interactive Discussion
Discussion
P
a
per
|
Discussion
P
a
per
|
Discussion
P
a
per
|
Discussion
P
a
per
|
5S-5N 10.00hPa
2004 2006 2008 2010 2012 2014
140 160 180 200 220
N2O(ppbv)
9 10 11 12
O3(ppmv)
ACPD
15, 453–480, 2015The decrease in mid-stratospheric tropical ozone since
1991
G. E. Nedoluha et al.
Title Page
Abstract Introduction
Conclusions References
Tables Figures
◭ ◮
◭ ◮
Back Close
Full Screen / Esc
Printer-friendly Version Interactive Discussion
Discussion
P
a
per
|
Discussion
P
a
per
|
Discussion
P
a
per
|
Discussion
P
a
per
|
Figure 6.ACE measurements of O3, N2O, and the key members of the NOyfamily, NO+NO2+
ACPD
15, 453–480, 2015The decrease in mid-stratospheric tropical ozone since
1991
G. E. Nedoluha et al.
Title Page
Abstract Introduction
Conclusions References
Tables Figures
◭ ◮
◭ ◮
Back Close
Full Screen / Esc
Printer-friendly Version Interactive Discussion
Discussion
P
a
per
|
Discussion
P
a
per
|
Discussion
P
a
per
|
Discussion
P
a
per
|
0 100 200 300
ppbv
10
1
Pressure (hPa)
N2O
0 10 20 30
ppbv
10
1
Pressure (hPa)
NOy
0 5 10 15
ppmv
10
1
Pressure (hPa)
O3