High Affinity Binding of Indium and
Ruthenium Ions by Gastrins
Graham S. Baldwin1*, Graham N. George2, M. Jake Pushie2
1The University of Melbourne Department of Surgery, Austin Health, Heidelberg, Victoria 3084, Australia,
2Molecular and Environmental Science Research Group Department of Geological Sciences, 114 Science Place, University of Saskatchewan, Saskatoon, S7N 5E2, Canada
Abstract
The peptide hormone gastrin binds two ferric ions with high affinity, and iron binding is essential for the biological activity of non-amidated forms of the hormone. Since gastrins act as growth factors in gastrointestinal cancers, and as peptides labelled with Ga and In iso-topes are increasingly used for cancer diagnosis, the ability of gastrins to bind other metal ions was investigated systematically by absorption spectroscopy. The coordination struc-tures of the complexes were characterized by extended X-ray absorption fine structure (EXAFS) spectroscopy. Changes in the absorption of gastrin in the presence of increasing
concentrations of Ga3+were fitted by a 2 site model with dissociation constants (K
d) of 3.3 x
10−7and 1.1 x 10⁻⁶M. Although the absorption of gastrin did not change upon the addition
of In3+ions, the changes in absorbance on Fe3+ion binding in the presence of indium ions
were fitted by a 2 site model with Kdvalues for In3+of 6.5 x 10⁻¹⁵and 1.7 x 10⁻⁷M. Similar
results were obtained with Ru3+ions, although the K
dvalues for Ru3+of 2.6 x 10⁻¹³and
1.2 x 10⁻⁵M were slightly larger than observed for In3+. The structures determined by
EXAFS all had metal:gastrin stoichiometries of 2:1 but, while the metal ions in the Fe, Ga and In complexes were bridged by a carboxylate and an oxygen with a metal-metal
separa-tion of 3.0–3.3Å, the Ru complex clearly demonstrated a short range Ru—Ru separation,
which was significantly shorter, at 2.4Å, indicative of a metal-metal bond. We conclude that
gastrin selectively binds two In3+or Ru3+ions, and that the affinity of the first site for In3+or
Ru3+ions is higher than for ferric ions. Some of the metal ion-gastrin complexes may be
useful for cancer diagnosis and therapy.
Introduction
The peptide hormone gastrin (ZGPWLEEEEEAYGWMDFamide, Gamide) stimulates gastric
acid secretion, and is an important growth factor for the gastric mucosa.[1] The biological
effects of Gamide are mediated by the cholecystokinin2 receptor (CCK2R), which is a member of the G-protein-coupled receptor superfamily. Several different tumor types often express the CCK2R. In particular Reubi and coworkers have demonstrated that more than 90% of medul-lary thyroid carcinomas and ovarian stromal carcinomas, and more than 50% of astrocytomas
OPEN ACCESS
Citation:Baldwin GS, George GN, Pushie MJ (2015) High Affinity Binding of Indium and Ruthenium Ions by Gastrins. PLoS ONE 10(10): e0140126. doi:10.1371/journal.pone.0140126
Editor:Dariush Hinderberger, Martin-Luther-Universität Halle-Wittenberg, GERMANY
Received:June 16, 2015
Accepted:September 21, 2015
Published:October 12, 2015
Copyright:© 2015 Baldwin et al. This is an open access article distributed under the terms of the Creative Commons Attribution License, which permits unrestricted use, distribution, and reproduction in any medium, provided the original author and source are credited.
Data Availability Statement:All relevant data are within the paper and its Supporting Information files.
and small cell lung carcinomas, are CCK2R-positive.[2] In contrast, non-amidated forms such as glycine-extended gastrin (Ggly), which are not recognised by the CCK2R, stimulate prolifer-ation in the normal colorectal mucosa. Ggly and the gastrin precursor progastrin also
acceler-ate the development of colorectal cancer.[3,4]
There has already been considerable interest in the use of metal chelate-conjugated gastrin
derivatives for the diagnosis of CCK2R-positive tumors.[5] For example, the chelating group
1,4,7,10-tetraazacyclodecane-1,4,7,10-tetraacetic acid (DOTA) has been coupled to
minigas-trin11(d-Glu-Ala-Tyr-Gly-Trp-Met-Asp-Phe-NH2) and radiolabelled with111In or68Ga.[6]
One disadvantage of this approach is that incorporation of the metal ion requires harsh condi-tions (pH 4.5, 98°C, 15 min), which may result in some oxidative damage or modification to
the peptide.[7]
Gastrins bind two ferric ions,[8] the first to Glu7 and the second to Glu8 and Glu9.[9] Ferric
ions are essential for the biological activity of non-amidated forms of the peptide as a stimulant
of cell proliferation and migration.[9] Thus, the biological activity of Ggly can be completely
blocked, either by mutation of Glu7!Ala, or treatment with the iron chelator desferrioxamine.
Bi3+ions, on the other hand, by competing for the ferric ion binding site of Ggly, block
biologi-cal activityin vitro[10] and in the normal colorectal mucosa in both mice and ratsin vivo.[11]
In contrast, ferric ions were not required for the biological activity of Gamide.[12] In the
pres-ent study the binding of several other metal ions to Gamide and Ggly was investigated either via changes in absorption on addition of the metal ion itself, or by alterations in the absorption of the ferric ion-gastrin complex in the presence of the metal ion. The structures of several of the complexes were also characterized by extended X-ray absorption fine structure (EXAFS) spectroscopy. The metal ions structurally characterized in this study were chosen because each
has radioisotopes which are advantageous for biomedical imaging (67Ga,68Ga,97Ru,109In, and
111In) or radiotherapy (i.e.106Ru), and which may be exploited in future studies.
Materials and Methods
Peptides and metal ions
Gamide and Ggly (88 and 93% pure, respectively) were purchased from Auspep (Clayton, Aus-tralia). The impurities consisted of water and salts. Solutions of metal ions (Aldrich, St. Louis, MO) were prepared in 10 mM HCl, and their concentrations determined by inductively cou-pled plasma-atomic emission spectroscopy at the National Measurement Institute (Pymble, Australia).
Absorption spectroscopy
The 280 nm absorption of peptides (10μM in 10 mM sodium acetate, pH 4.0, containing 100
mM NaCl and 0.005% Tween 20) in the presence of increasing concentrations of metal ions was measured against a buffer blank, in 1 ml quartz cuvettes thermostatted at 298 K, with a Cary 5 spectrophotometer (Varian, Mulgrave, Australia). This wavelength was chosen because the absorption maxima of the Ggly and Gamide peptides are at 280 nm, and because there is a
peak in the difference absorption spectrum (Ggly–GglyFe) at the same wavelength.
Curve fitting and statistics
Data (expressed as means ± S.E.M.) were fitted to one-site or two-site ordered models with the
program BioEqs.[13,14] Because of the large number of parameters and the limited number of
data points, the experimentally determined equilibrium constants and absorbance ratios given inTable 1for the interaction of Gamide or Ggly with ferric ions were held constant while Canadian Centre for Nuclear Innovation. The
Stanford Synchrotron Radiation Lightsource, SLAC National Accelerator Laboratory, is supported by the U.S. Department of Energy, Office of Science, Office of Basic Energy Sciences, under Contract No. DE-AC02-76SF00515. The SSRL Structural Molecular Biology Program is supported by the DOE Office of Biological and Environmental Research, and by the National Institutes of Health, National Institute of General Medical Sciences (including P41GM103393).
Competing Interests:The authors have declared that no competing interests exist.
fitting the data for the interaction of other metal ions with Gamide or Ggly in the presence of ferric ions.
X-ray absorption sample preparation, spectroscopy, and analysis
Samples for X-ray absorption spectroscopy (XAS) were prepared with 1 mM peptide, 50 mM MOPS, 10% DMSO and 20% glycerol as a cryoprotectant. Metal stock solutions were preparedfrom the corresponding nitrate salt, or RuIIICl
3in the case of ruthenium, and titrated to a final
concentration of 2 mM. Following data collection, samples containing 2 mM Ru or In were
fur-ther titrated with 1 mM Fe for comparison. All samples were frozen in liquid N2within 5
min-utes of mixing, prior to data collection. XAS measurements were conducted at the Stanford Synchrotron Radiation Laboratory with the SPEAR storage ring containing roughly 450 mA at
3.0 GeV, using the data acquisition program XAS Collect.[15] Iron, gallium, indium, and
ruthenium K-edge data were collected on the structural molecular biology XAS beamline 7–3,
operating with a 20-pole 2 Tesla wiggler source, and employing a Si(220) double-crystal mono-chromator. For Fe and Ga spectroscopy a downstream vertically collimating Rh-coated mirror was employed for harmonic rejection, such that the harmonic fell above the cutoff. Incident X-ray intensity was monitored using a nitrogen-filled ionization chamber and X-X-ray absorption
was measured as the X-ray Kαfluorescence excitation spectrum using an array of 30
germa-nium detectors (Canberra Industries, Meriden, CT, USA).[16] X-ray fluorescence was collected
through a Soller slit assembly, and scattered X-rays were preferentially removed using filters of 6 or 9 absorption unit thickness (Mn for Fe, Zn for Ga, Ag for In and Mo for Ru) in order to maintain the count rates registered by the detector in the linear regime. During data collection, samples were maintained at a temperature of approximately 10 K using a liquid helium flow cryostat (Oxford Instruments, Abingdon, UK). For each data set, 6 scans for each sample were accumulated (14 scans for the Ru data), and the energy was calibrated by reference to the absorption of a reference foil of the same element, measured simultaneously with each scan (assuming a lowest energy inflection point of 7,111.3 eV for Fe, 10,368.2 eV for Ga, 27,940.0 eV for In and 22,118 eV for Ru). XAS data was collected using a multiple region strategy in order to optimize data processing and statistical significance across the numerous regions of the EXAFS experiment. Initially data was collected in 10 eV steps to provide an accurate measure of the background, then in 0.2 eV steps across the absorption edge (from 40 eV below the edge
up to the threshold energy,k= 0 Å-1) for Fe and Ga, and 0.5 eV steps for the broader
absorp-tion edges of In and Ru. After the threshold energy, steps of 0.045 Å-1were used for the
remain-der of the spectrum. Data collection used a count time of 3s per data point up to the threshold
energy, then a count time weighted byk2was employed, ranging from 3s at the threshold
energy up to a maximum of 12s at the end of the collectedk-range. Average data collection
time per scan was 40 minutes for each element.
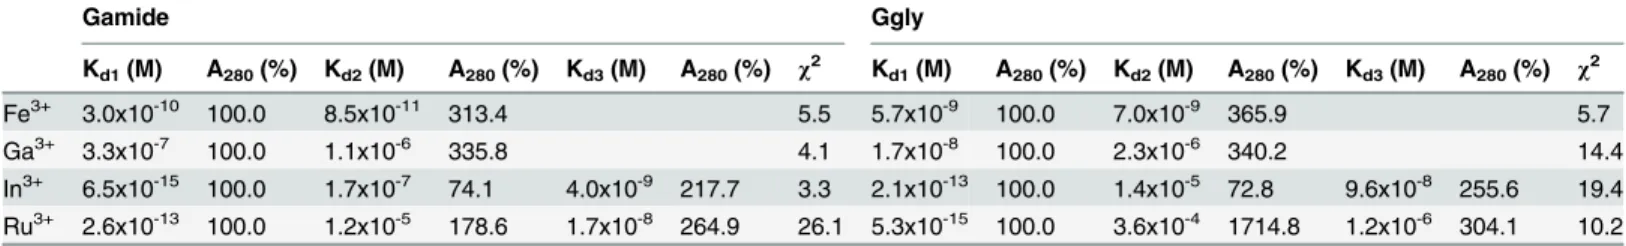
Table 1. Binding of metal ions by Gamide and Ggly. The affinity of, and the percentage absorbance change at 280 nm on, ferric or gallium ion binding to Gamide or Ggly were determined by fitting the mean data obtained in the absorbance experiments, described in theFig 2legend, to the models shown inFig 1with the program BioEqs. In the case of indium or ruthenium ions the corresponding values were obtained from fitting ferric ion titrations in the presence of various concentrations of indium or ruthenium ions, as described in the legends to Figs3and4, respectively.
Gamide Ggly
Kd1(M) A280(%) Kd2(M) A280(%) Kd3(M) A280(%) χ2 Kd1(M) A280(%) Kd2(M) A280(%) Kd3(M) A280(%) χ2
Fe3+ 3.0x10⁻¹⁰ 100.0 8.5x10⁻¹¹ 313.4 5.5 5.7x10⁻⁹ 100.0 7.0x10⁻⁹ 365.9 5.7
Ga3+ 3.3x10⁻⁷ 100.0 1.1x10⁻⁶ 335.8 4.1 1.7x10⁻⁸ 100.0 2.3x10⁻⁶ 340.2 14.4
In3+ 6.5x10⁻¹⁵ 100.0 1.7x10⁻⁷ 74.1 4.0x10⁻⁹ 217.7 3.3 2.1x10⁻¹³ 100.0 1.4x10⁻⁵ 72.8 9.6x10⁻⁸ 255.6 19.4 Ru3+ 2.6x10⁻¹³ 100.0 1.2x10⁻⁵ 178.6 1.7x10⁻⁸ 264.9 26.1 5.3x10⁻¹⁵ 100.0 3.6x10⁻⁴ 1714.8 1.2x10⁻⁶ 304.1 10.2
The EXAFS oscillationsχ(k) were quantitatively analyzed by curve-fitting using the
EXAF-SPAK suite of computer programs (http://www-ssrl.slac.stanford.edu/exafspak.html) as
described by Georgeet al.,[17] usingab initiotheoretical phase and amplitude functions
calcu-lated with FEFF v8.20x5.[18] The energy thresholds of the EXAFS oscillations (k= 0 Å-1) were
assumed to be 7,130 for Fe, 10,385 for Ga, 27,960 eV for In and 22,135 eV for Ru. Iron data was
collected to ak-range of 14.2 Å-1, Ga tokof 14.0 Å-1, In tokof 16.2 Å-1and Ru tokof 18 Å-1.
Results
Binding of ferric ions to gastrins
The effect of addition of Fe3+ions on the absorption spectrum and fluorescence of Gamide and
Ggly at pH 4.0 has been reported previously.[8] The changes in absorption indicated a
stoichi-ometry of binding of 2 mol Fe3+/mol of peptide, and fitting of a linear transformation of the
fluorescence data was consistent with 2 binding sites withμM affinities. Because of the lapse in
time since the previous experiments, new spectra (S1 Fig) and absorption data sets were
obtained, and fitted to the 2 site model shown inFig 1with the program Bioeqs as described in
the Materials and Methods section. Reasonable fits were obtained with affinities of 3.0 x 10⁻¹⁰
and 8.5 x 10⁻¹¹M for Gamide and 5.7 x 10⁻⁹and 7.0 x 10⁻⁹M for Ggly (Fig 2,Table 1).
Binding of gallium ions to gastrins
Similar to the results with Fe3+, the addition of Ga3+ions also caused a general increase in
absorbance in the visible region, and in the peak centred at 280 nm in the UV region of the
spectrum (S1 Fig). Fitting of the increase in absorption at 280 nm for both Gamide and Ggly at
pH 4.0 (Fig 2) with the program Bioeqs yielded affinities for Ga3+of 3.3 x 10⁻⁷and 1.1 x 10⁻⁶
M for Gamide and 1.7 x 10⁻⁸and 2.3 x 10⁻⁶M for Ggly (Table 1).
Binding of indium and ruthenium ions to gastrins
The addition of In3+ions caused little if any change in the absorption spectrum of Ggly at pH
4.0 (S1 Fig). However, in the presence of 39.85μM In3+ions, the absorbance at 280 nm for
both Gamide and Ggly on addition of Fe3+ions increased more rapidly and approximated to
the curve expected for single site binding, with the maximum absorbance reached near a molar
ratio of 1 (Fig 3). These observations suggest that an In3+ion can bind to the first Fe3+ion
binding site with greater affinity than a Fe3+ion, but without causing any change in
absor-bance. Indeed In3+ions appear to compete for both Fe3+ion binding sites, since the family of
curves obtained at increasing concentrations of In3+ions could be fitted with the program
Bioeqs to the competitive two site model presented inFig 1. The best fit affinities of ions for the
first metal binding site were substantially higher than for Fe3+ions, with K
dvalues for In3+of
6.5 x 10⁻¹⁵and 2.1 x 10⁻¹³M for Gamide and Ggly, respectively (Table 1).
Similar families of curves were obtained when the experiments were repeated with Ru3+
ions instead of In3+ions (Fig 4). The major difference observed was that addition of Ru3+ions
itself caused a noticeable increase in absorbance at 280 nm for both Gamide and Ggly at pH 4.0 (S1 Fig). Nevertheless, the family of curves obtained at increasing concentrations of Ru3+ions was reasonably well fitted with the program Bioeqs to the competitive two site model presented inFig 1. The best fit affinities of Ru3+ions for the first metal binding site were again
substan-tially higher than for Fe3+ions, with K
dvalues for Ru3+of 2.6 x 10⁻¹³and 5.3 x 10⁻¹⁵M for
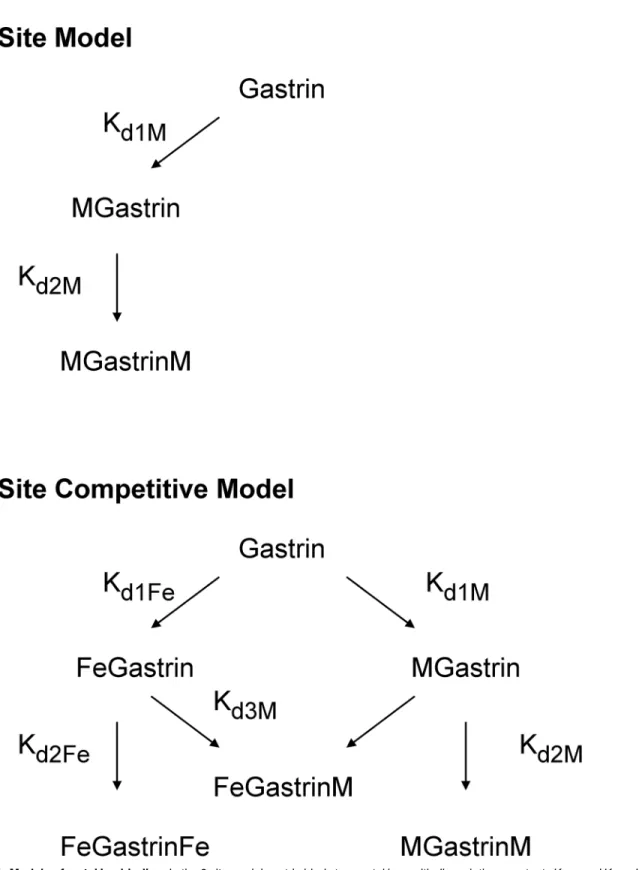
Fig 1. Models of metal ion binding.In the 2 site model gastrin binds two metal ions with dissociation constants Kd1Mand Kd2M. In the 2 site competitive
model gastrin binds two ferric ions with dissociation constants Kd1Feand Kd2Fe, and two metal ions (M) to the same two sites with dissociation constants Kd1M
and Kd2M. The dissociation constant Kd3Mdescribes the formation of the mixed FeGastrinM complex.
EXAFS characterization of Fe
2Ggly
The XAS K-edge near-edge spectrum of FeIII2Ggly (S2 Fig) demonstrates pre-edge peaks
cen-tred at 7,114 eV arising from 1s!3d(t2g) and 1s!3d(eg) transitions (see inset plot). The
rela-tively large separation between these peaks (Δ= 1.2 eV) arises from an elevation of the eglevels,
relative to the lower t2glevels, and is indicative of low spin ferric iron. This large splitting also
agrees with the expectation that the ferric ions are coordinated predominantly by hard ligands (i.e. the carboxylate donors of the Glu side chains). The observation that the near-edge spec-trum does not display any apparent contributions from reduced ferrous forms of iron indicates that there was no appreciable photoreduction of the iron centres over the course of data collection.
The FeIII
2Ggly EXAFS data (Fig 5B) is dominated by Fe-O backscattering interactions just
below 2 Å, and an outer shell backscattering FeFe interaction at ~3.3 Å (Fig 5B). The best fit
to the data was obtained using single scattering paths, including 2 short Fe-O backscattering interactions at 1.90 Å, 4 Fe-O interactions at 2.03 Å, 1 FeC interaction at 2.57 Å, 2 FeC
interactions at 2.96 Å and a single FeFe interaction at 3.33 Å (Table 2). The structural
param-eters are reminiscent of the diferric non-heme iron-binding proteins, such as methane mono-oxygenase and similar di-iron complexes, where the iron atoms are relatively close together and are bound by multiple carboxylates, including bridging carboxylates between the metal
centres.[19–21] Based on the number of coordinating ligands and longer range FeC
scatter-ing interactions, which appear prominent in the EXAFS data, the two ferric ions are predomi-nantly bound by carboxylate donors with at least one bridging carboxylate. There is also a clear preference for inclusion of shorter Fe-O bond lengths (1.90 Å) in the fit, which may be
indica-tive of bridging oxygen atoms, possibly as O2-or OH-, although the internuclear separation is
not particularly diagnostic in this case as mono-dentate carboxylate donors to Fe3+can also fall
close to this range of interatomic distances in similar complexes. In a search of the Cambridge
Structural Database[22,23] for compatible candidate small molecule structures that are in
agreement with the EXAFS fit parameters and that fulfill the requirement for coordination pri-marily by carboxylate donors, the best candidate structure identified (FEMTEX) contains a
di-iron(II) site with bridging water molecules.[24] If one or two bridging oxygen atoms derived
from water are present in the FeIII2Ggly coordination environment they are more likely to exist
in a deprotonated state, such as OH-, which would provide sufficient charge compensation
with 4–5 carboxylate donors to make the overall charge zero or minus 1.
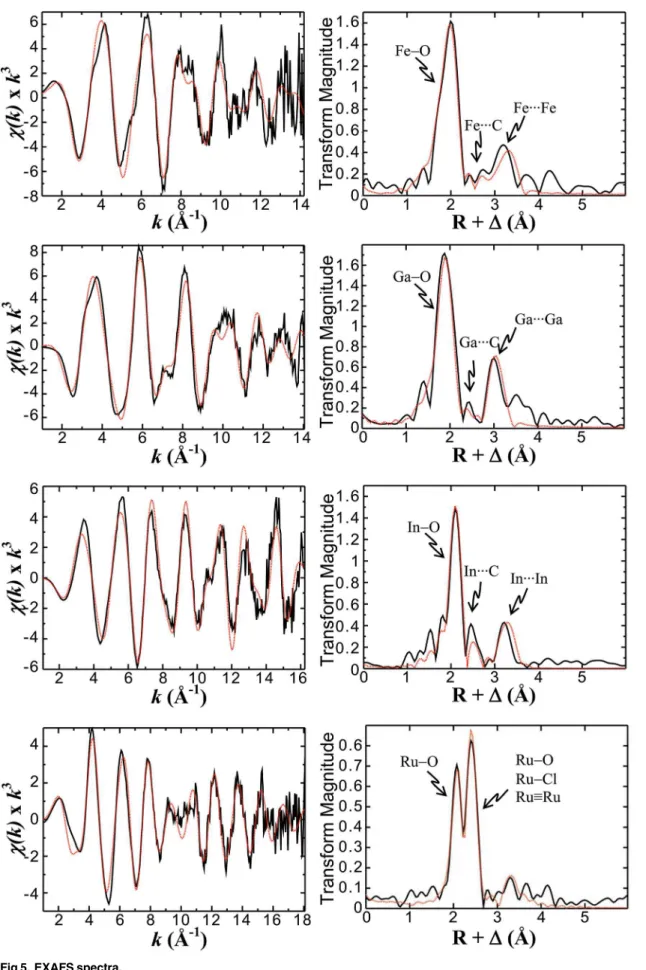
The K-edge EXAFS spectra (A, C, E, G, solid black lines) and their corresponding Fourier
transforms (B, D, F, H) for the complexes of Ggly with Fe3+ions (A, B), Ga3+ions (C, D), In3+
ions (E, F), or Ru3+ions (G, H) are shown together with the best fits (red dashed lines)
calcu-lated using the single scattering path parameters listed inTable 2.
The EXAFS data was best fit by a single FeFe scattering interaction. This observation
indi-cates that Ggly binds Fe3+in a di-iron coordination environment, without apparent
recruit-ment of any additional ferric ions, as is otherwise often encountered in multinuclear small molecule crystal structures of iron-carboxylate complexes. A best fit could also be obtained by including one or two short Fe-O scattering interactions at ~1.9 Å, which may be attributable to one or more bridging oxygen atoms, although this relatively short separation is also compatible with coordination by a bridging carboxylate. The FeC scattering interactions suggest that Fig 2. Ferric or gallium ions enhance gastrin absorbance.At pH 4.0 addition of aliquots of ferric chloride (red▲) or gallium nitrate (black▼) to 10μM Gamide or Ggly in 10 mM Na+acetate, 100 mM NaCl, 0.005% Tween 20 at 298 K resulted in an increase in the absorption at 280 nm. Points are means of at
least three separate experiments; bars represent the SEM. Lines represent the best fit to the two site model shown inFig 1with the program BioEqs; the appropriate Kdand maximum absorbance values are given inTable 1.
each iron centre interacts with one to two bridging carboxylates as well as at least one addi-tional carboxylate that is not involved in a bridging interaction.
EXAFS characterization of Ga
2Ggly
Although the primary backscattering peak in the GaIII
2Ggly EXAFS Fourier transform (Fig
5D) appears more symmetric than in the analogous FeIII
2Ggly complex, significantly improved
fits were obtained with the inclusion of two separate Ga-O backscattering interactions: two at 1.88 Å and three at 1.99 Å. The fact that inclusion of a third Ga-O backscatterer at 1.88 Å did
not significantly change the fit suggested that the Ga3+centres could be either 5- or
6-coordi-nate, although mixtures cannot be ruled out either. The EXAFS data also clearly demonstrate a GaGa backscattering interaction at 3.05 Å, and the results from the single scattering path
model used for the GaIII
2Ggly data (Table 2) are in agreement with the di-iron EXAFS model,
albeit with shorter internuclear separations overall. The structural implication is that Ga3+,
when coordinating to Ggly, appears to substitute for Fe3+with minimal structural change in
the local coordination environment of the di-nuclear coordination site.
EXAFS characterization of In
2Ggly
The EXAFS Fourier transform (Fig 5F) for InIII2Ggly shows a shoulder on the shorter distance
side of the primary backscattering peak centred at 2.1 Å, and the inclusion of a short In-O
backscattering interaction significantly improved fitting of the data. Truncating thek-range of
the EXAFS data (Fig 5E) to 14 Å-1confirmed that this apparent peak in the Fourier transform
was reasonably well represented in the lowk-range data, as would otherwise be expected for
backscattering interactions with light atoms, such as oxygen, and was not attributable to noise or other artifacts. Overall the best fit to the EXAFS data was obtained by including a single short metal-O atom path at 1.98 Å as well as five equivalent In-O backscattering interactions at 2.13 Å. The InIn backscattering interaction was observed at 3.26 Å, and such short internu-clear separations have been previously reported for In complexes with bridging light atoms.
[25] The fact that the fit parameters for InIII2Ggly agreed reasonably well with those used for
the parent FeIII
2Ggly complex suggested that, like Ga3+, In3+coordinates to Ggly within a
di-indium binding environment similar in structure to the Fe3+complex.
EXAFS characterization of Ru
2Ggly
The EXAFS Fourier transform of the di-Ru3+complex (Fig 5H) is significantly different from
those of the other complexes investigated and displays two intense primary backscattering
peaks centred at ~2.1 Å and ~2.4 Å. The magnitude of the Fourier transform peaks inFig 5His
greatly diminished compared to those of the other complexes shown inFig 5B, 5D and 5Fand
is the result of significant cancellation between individual Ru scattering paths. The best fit to
the data was obtained using a dinuclear Ru3+complex, containing a Ru
–Ru core, a bridging
carboxylate and the remaining coordination completed with O-atoms and a single chloride bound to one of the Ru centres. While the bond-length of the Ru-Ru coordination is similar to that observed for other backscatterers, such as Ru-Cl, confusion of the EXAFS with these Fig 3. Indium ions compete with ferric ions for the gastrin binding sites.Addition of aliquots of indium nitrate (black▼) to 10μM Gamide or Ggly in the buffer described in theFig 2legend resulted in little change in absorbance at 280 nm when compared to the changes seen on addition of aliquots of ferric chloride (red▲). However in the presence of 3.99 (green■) or 39.85μM (blue•) indium nitrate the changes in absorbance seen on addition of aliquots of ferric chloride were considerably different from the changes seen in the absence of indium nitrate. The points are means from three separate experiments; bars represent the SEM. The lines were constructed with the dissociation constants and maximum absorbance values (Table 1) obtained by fitting the data to the 2 site competitive model shown inFig 1with the program BioEqs.
alternatives is not possible because the Ru–Ru and Ru–Cl EXAFS differ in phase by
approxi-mately 180 degrees. Because the EXAFS experiment gives the superposition of all coordination
environments about the Ru centres simultaneously, the fit parameters (Table 2) required
frac-tional occupancy of Cl as well as fracfrac-tional occupancy of an O-atom at ~2.4 Å in order to repre-sent the contributions from the two non-equivalent Ru coordination environments. This mixed dinuclear coordination environment also gave the maximal EXAFS cancellation repre-sented by the experimental data. The short internuclear separation (2.4 Å) between the Ru
cen-tres is indicative of a direct metal-metal bond.[26]
Discussion
We have previously reported that gastrins bind two ferric ions with affinities in theμM range.
[8,9] The discrepancy between these values and the values reported inTable 1is probably due
to the fact that the previous estimates were obtained by least squares fitting of a linear transfor-mation of the fluorescence data, assuming binding sites with identical affinity. The present val-ues were obtained by fitting the untransformed absorption data with the program BioEqs, which makes no such assumptions. We also reported previously that bismuth ions inhibit ferric ion binding, and analysis of the binding data with the program BioEqs was consistent with mixed inhibition, in which the gastrin-bismuth complex was still able to bind two ferric ions.
[11] In the present study the binding of a range of other trivalent metal ions to gastrins was
investigated by ultraviolet absorption spectroscopy. Both Gamide and Ggly bound Ga3+, In3+
or Ru3+; no binding of other trivalent metal ions from group 8/9 (Os3+, Rh3+), group 13 (Al3+,
Tl3+), or group 15 (As3+, Sb3+) was detected (data not shown).
The binding of Ru3+ions to gastrins was not unexpected, as ruthenium is in the same
col-umn of the periodic table as iron and therefore shares some chemical similarity. Analysis of the
binding data (Fig 4) was consistent with competitive inhibition, in which ruthenium and ferric
ions competed for the two metal ion binding sites on gastrin. The dissociation constants (Table 1) indicated that the affinity of gastrins for ruthenium ions was substantially higher
than for ferric ions. In fact, the curve for ferric ion binding in the presence of 26.5μM Ru3+
ions indicated that both Gamide and Ggly were able to bind only one Fe3+ion under these
conditions.
Some group 13 ions also bound to gastrins, likely due to their similar charge and atomic
radius. Binding of Ga3+ions resulted in an increase in the absorption of both Gamide and Ggly
(Fig 2), and analysis of the binding data was consistent with the binding of two Ga3+ions, with
affinities substantially weaker than for ferric ions (Table 1). Addition of In3+ions did not
change the absorption of either Gamide or Ggly (Fig 3), but did modify the changes in the
absorption of both Gamide and Ggly on subsequent addition of Fe3+ions. The binding data for
In3+ions was reasonably well fitted by a competitive inhibition model, in which the indium
and ferric ions competed for the two metal ion binding sites on gastrin. The dissociation
con-stants (Table 1) indicated that the affinity of gastrins for indium ions was substantially higher
than for ferric ions and similar to the values for ruthenium ions. Binding of the other group 13
ions, aluminium or thallium (Al3+, Tl3+), by gastrins was not detected by absorption
spectros-copy (data not shown).
Fig 4. Ruthenium ions compete with ferric ions for the gastrin binding sites.Addition of aliquots of ruthenium chloride (black▼) to 10μM Gamide or Gly in the buffer described in theFig 2legend resulted in an increase in absorbance at 280 nm which was significantly less than the changes seen on addition of aliquots of ferric chloride (red▲). However in the presence of 5.30 (green■) or 26.48μM (blue•) ruthenium chloride the changes in absorbance seen on addition of aliquots of ferric chloride were considerably different from the changes seen in the absence of ruthenium chloride. The points are means from three separate experiments; bars represent the SEM. The lines were constructed with the dissociation constants and maximum absorbance values (Table 1) obtained by fitting the data to the 2 site competitive model shown inFig 1with the program BioEqs.
Evidence for the binding of the group 15 ion bismuth to gastrins has been presented
previ-ously.[10,11] The fact that the binding data was better fitted by a mixed inhibition model than
a competitive model suggested that the gastrin-bismuth complex was still able to bind two fer-ric ions, and thus that the binding sites for the first bismuth and ferfer-ric ions were subtly
differ-ent. Binding of the other group 15 ions, arsenic or antimony (As3+, Sb3+), by gastrins was not
detected by absorption spectroscopy (data not shown). In previous studies no evidence was
obtained for high affinity binding of a wide range of divalent metal ions to either Ggly[8] or the
gastrin precursor, progastrin.[27] Hence the metal binding sites of gastrins appear thus far to
be selective for trivalent metal ions of groups 8, 13 and 15.
The selectivity of the metal binding sites of transferrin has been investigated previously.
Transferrin binds two ferric ions with high affinity, with bicarbonate-independent logK1and
logK2values of 21.4 and 20.3, respectively.[28] Spectroscopic evidence has also been presented
for the formation of complexes of transferrin with divalent (copper, nickel, zinc, etc.) and
triva-lent (aluminium, gallium, indium, etc.) metal ions (see review by Harris[29]). Although the
variation in experimental conditions often renders comparisons of the data obtained by
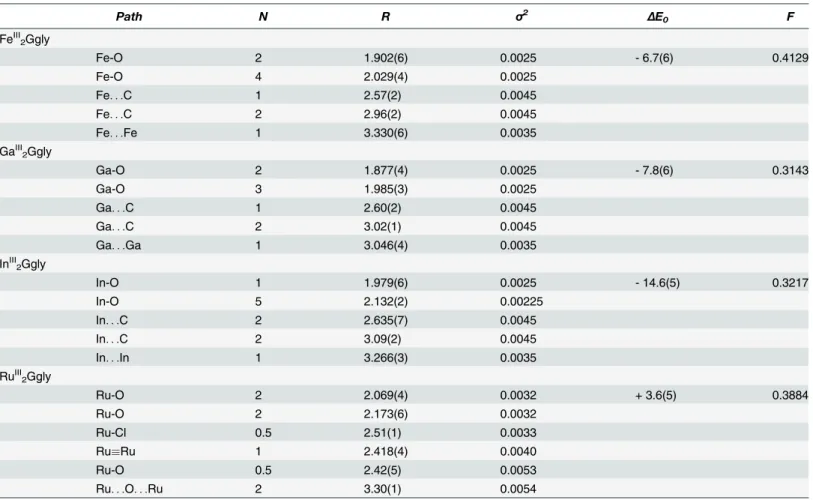
Table 2. EXAFS curve fitting results.a
Path N R σ2 ΔE0 F
FeIII 2Ggly
Fe-O 2 1.902(6) 0.0025 - 6.7(6) 0.4129
Fe-O 4 2.029(4) 0.0025
Fe. . .C 1 2.57(2) 0.0045
Fe. . .C 2 2.96(2) 0.0045
Fe. . .Fe 1 3.330(6) 0.0035
GaIII 2Ggly
Ga-O 2 1.877(4) 0.0025 - 7.8(6) 0.3143
Ga-O 3 1.985(3) 0.0025
Ga. . .C 1 2.60(2) 0.0045
Ga. . .C 2 3.02(1) 0.0045
Ga. . .Ga 1 3.046(4) 0.0035
InIII 2Ggly
In-O 1 1.979(6) 0.0025 - 14.6(5) 0.3217
In-O 5 2.132(2) 0.00225
In. . .C 2 2.635(7) 0.0045
In. . .C 2 3.09(2) 0.0045
In. . .In 1 3.266(3) 0.0035
RuIII 2Ggly
Ru-O 2 2.069(4) 0.0032 + 3.6(5) 0.3884
Ru-O 2 2.173(6) 0.0032
Ru-Cl 0.5 2.51(1) 0.0033
RuRu 1 2.418(4) 0.0040
Ru-O 0.5 2.42(5) 0.0053
Ru. . .O. . .Ru 2 3.30(1) 0.0054
a Coordination numbers,N, interatomic distancesR(Å), Debye-Waller factorsσ2(Å2), and threshold energy shiftΔE0(eV), were derived from EXAFS
curve-fitting. Thefit error parameterFis defined asF¼ ffiffiffiffiffiffiffiffiffiffiffiffiffiffiffiffiffiffiffiffiffiffiffiffiffiffiffiffiffiffiffiffiffiffiffiffiffiffiffiffiffiffiffiffiffiffiffiffiffiffiffiffiffiffiffiffiffiffiffiffiffiffiffiffiffiffiffiffiffiffiffiffiffiffiffiffiffiffiffiffiffiXk6 ðwðkÞcalc wðkÞexptÞ
2 =Xk6
wðkÞ
2 expt q
, with the summation being over data points included in
thefit. Values in parentheses are the estimated standard deviations obtained from the diagonal elements of the covariance matrix; these are precisions and are distinct from the accuracies which are expected to be larger (ca±0.02ÅforR, and±20% forNandσ2), although relative accuracies (e.g. comparing two different Fe—O bond-lengths) will be more similar to the precisions.
different groups invalid, the data of Harris and coworkers indicates that the order of decreasing
affinity for logK1is: iron, 21.4>gallium, 19.8>indium, 18.3>aluminium, 13.7.[28] In every
case the value is considerably higher than the corresponding affinity for gastrin, so that the
mechanism previously proposed for catalysis of iron loading of apo-transferrin by gastrin[30]
may also be valid for the other metal ions studied herein.
The structures of the complexes of glycine-extended gastrin17with trivalent metal ions have
been determined by EXAFS spectroscopy. Although the best fit Fe3+and Ga3+structures
included shorter metal-O-atom donors (1.92 and 1.88 Å, respectively), these shorter distances are not necessarily indicative of bridging ligands and the structural parameters from the fit
pro-cedure, including the In3+data, are also compatible with coordination solely by carboxylate
donor ligands. Further evidence for this structure is provided by the preference for inclusion of longer-range metalC scattering interactions, corresponding to the central carbon atom of a coordinating carboxylate. Construction of a hypothetical model of the di-ferric form of Ggly, guided by parameters from the EXAFS curve fitting which requires 6-coordinate iron centres
with at least one bridging carboxylate, is shown inFig 6. Although the structural model
includes recruitment of all five glutamates from the polyglutamate sequence in order to pre-serve the symmetry of the fit parameters between iron centres, the precise number of coordi-nating glutamates cannot be determined by EXAFS spectroscopic methods alone. Recruitment
of glutamates in the coordination of Fe3+to Ggly has been examined previously by1H NMR
and, although the resonances from Glu 7, 8 and 9 were the most significantly attenuated upon
coordination of two Fe3+ions, the amide protons of the other two glutamates were also
affected.[9] The remainder of the coordinating light atoms at each iron centre inFig 6may be
comprised of water-derived ligands and possibly amide carbonyls from the peptide backbone.
Surprisingly, the structure of the Ru3+-glycine-extended gastrin17complex differed from the
complexes with Fe3+, Ga3+and In3+. A RuRu bond was observed, whereas in the other three
structures the metal ions were separated by bridging oxygen atoms (Fig 6). A search of the
Cambridge Structural Database for Ru complexes containing primarily O-atom donors and a
Ru–Cl bond demonstrates a preponderance of dinuclear RuRu complexes, which are
typi-cally bridged by carboxylate-type donor ligands. Although only one bridging carboxylate
donor was used for EXAFS curve fitting the remaining O-atom donors of the Ru26+core are
also likely comprised of anionic carboxylate donors from the polyglutamate region of the pep-tide, as opposed to coordination by water or DMSO, in order to balance the charge of the cat-ionic centre. The fact that an EXAFS investigation of di-ruthenium complexes containing bridging oxygen ligands (but using bipyridine to coordinate Ru) reported significantly different
EXAFS spectra from those herein[31] further supports the conclusion that bridging O-atoms
are not present in RuIII2Ggly.
Gastrin derivatives conjugated to metal chelates such as DOTA and radiolabelled with111In
or68Ga have already been used for the diagnosis of CCK2R-positive tumors.[5,6] The data
pre-sented herein suggest that radioactive isotopes of Ga, Ru or In could be directly complexed
with amidated gastrin17itself for use as CCK2R probes in single-photon emission computed
tomography (SPECT,67Ga,97Ru,111In) and positron emission tomography (PET,68Ga,109In).
The recent development of a portable generator for68Ga makes the latter approach more
feasi-ble than previously.[32] One advantage of this approach would be that oxidative damage to the
peptide[7] would also be avoided, since complex formation proceeds rapidly at room
temperature.
In contrast to the abundant structure–function information available for the CCK2R, the
identities of the receptors for non-amidated gastrins such as progastrin and Ggly are still
con-troversial. The CCK2R does not bind either recombinant human progastrin[33] or synthetic
Fig 6. Proposed structural models of FeIII2Ggly and RuIII2Ggly.The model for FeIII2Ggly (A) is based on the EXAFS data presented inFig 5B, and is
consistent with previous NMR and visible spectroscopic studies of Ggly and mutant peptides.[8,9,12] The two FeIIIions are coordinated by the carboxylate
side chains likely from glutamates 6, 7, 8, 9 and 10, with glutamate 7 acting as a ligand to both FeIIIions. One or more oxygens also act as bridging ligands
between the two FeIIIions. The peptide backbone and non-coordinating side chains have been omitted for simplicity. The model for RuIII
2Ggly (B) is based on
the rat pancreatic cell line AR4-2J clearly differentiated the Ggly binding site from either of the
known receptors.[34] A recent report has identified the F1-ATPase as a candidate Ggly
recep-tor.[35] The identification of annexin II as the progastrin receptor[36], however, has been
dis-puted.[37] The availability of novel Ggly derivatives radioactively labelled with In and Ru
isotopes may assist in resolving the current controversy over the identity of the receptors for non-amidated gastrins. Since progastrin and Ggly stimulate proliferation in the normal
colo-rectal mucosa and accelerate the development of colocolo-rectal cancer[3,4], identification of such
receptors may lead to improvements in cancer diagnosis and therapy.
Supporting Information
S1 Fig. Absorption spectra of Ggly with and without metal ions.The full UV-visible spectra
of Ggly (9.42μM) in the absence of added metal ions (solid black lines), or in the presence of
approximately 1 (dashed and dotted blue lines) or 2 (dashed red lines) mol/mol Fe3+, Ga3+,
In3+, or Ru3+ions, are shown. As reported previously,[8] the UV-visible spectrum of the
Ggly-Fe complex is characterised by a peak centred on 280 nm, and a general increase in absorption throughout the visible range. The full UV-visible spectra of the 1:2 Ggly-Ga and 1:1 and 1:2 Ggly-Ru complexes are similar in shape, although the magnitude of the 280 nm peak differs in
each case. No change in absorption was seen on addition of 1 mol/mol Ga3+ions, or on the
addition of 1 or 2 mol/mol In3+ions. The exact molar ratios were: Fe, 0.98, 1.95; Ga, 0.95, 1.91:
In, 0.97, 1.95; Ru, 0.97, 1.94. Data are the average of 3 separate experiments. (TIF)
S2 Fig. Fe K-edge near edge spectrum of FeIII2Ggly.The XAS K-edge near edge spectrum of FeIII
2Ggly was collected as described in Materials and Methods. The pre-edge peaks centred at
7,114 eV (see inset) arise from 1s!3d(t2g) and 1s!3d(eg) transitions. The relatively large
separation between these peaks (Δ= 1.2 eV) results from an elevation of the eglevels, relative to
the lower t2glevels, and is indicative of low spin ferric iron in an octahedral-type coordination
environment. (TIF)
Acknowledgments
We thank Dr. Mal Eutick (Phebra, Lane Cove, Australia) for his enthusiastic support of this project and for many stimulating discussions.
Author Contributions
Conceived and designed the experiments: GSB GNG MJP. Performed the experiments: GSB MJP. Analyzed the data: GSB MJP. Contributed reagents/materials/analysis tools: GSB GNG MJP. Wrote the paper: GSB GNG MJP.
References
1. Dockray GJ, Varro A, Dimaline R, Wang T. The gastrins: their production and biological activities. Annu Rev Physiol 2001; 63: 119–139. PMID:11181951
2. Reubi JC, Schaer JC, Waser B. Cholecystokinin(CCK)-A and CCK-B/gastrin receptors in human tumors. Cancer Res 1997; 57: 1377–1386. PMID:9102227
3. Aly A, Shulkes A, Baldwin GS. Gastrins, cholecystokinins and gastrointestinal cancer. Biochim Biophys Acta 2004; 1704: 1–10. PMID:15238241
4. Ferrand A, Wang TC. Gastrin and cancer: a review. Cancer Lett 2006; 238: 15–29. PMID:16054292
6. von Guggenberg E, Rangger C, Sosabowski J, Laverman P, Reubi JC, Virgolini IJ, et al. Preclinical evaluation of radiolabeled DOTA-derivatized cyclic minigastrin analogs for targeting cholecystokinin receptor expressing malignancies. Mol Imaging Biol 14: 366–375. doi:10.1007/s11307-011-0506-2 PMID:21732165
7. Naqvi SA, Khan ZA, Nagra SA, Yar M, Sherazi TA, Shahzad SS, et al. Novel indium-111 labeled gastrin peptide analogues (MG-CL1-4): synthesis and quality control. Pak J Pharm Sci 2013; 26: 299–305. PMID:23455200
8. Baldwin GS, Curtain CC, Sawyer WH. Selective, high-affinity binding of ferric ions by glycine-extended gastrin(17). Biochemistry 2001; 40: 10741–10746. PMID:11535048
9. Pannequin J, Barnham KJ, Hollande F, Shulkes A, Norton RS, Baldwin GS. Ferric ions are essential for the biological activity of the hormone glycine-extended gastrin. J Biol Chem 2002; 277: 48602–48609. PMID:12270941
10. Pannequin J, Kovac S, Tantiongco JP, Norton RS, Shulkes A, Barnham KJ, et al. A novel effect of bis-muth ions: selective inhibition of the biological activity of glycine-extended gastrin. J Biol Chem 2004; 279: 2453–2460. PMID:14530269
11. Kovac S, Loh SW, Lachal S, Shulkes A, Baldwin GS. Bismuth ions inhibit the biological activity of non-amidated gastrins in vivo. Biochem Pharmacol 2012; 83: 524–530. doi:10.1016/j.bcp.2011.11.030 PMID:22172990
12. Pannequin J, Tantiongco JP, Kovac S, Shulkes A, Baldwin GS. Divergent roles for ferric ions in the bio-logical activity of amidated and non-amidated gastrins. J Endocrinol 2004; 181: 315–325. PMID: 15128280
13. Royer CA, Smith WR, Beechem JM. Analysis of binding in macromolecular complexes: a generalized numerical approach. Anal Biochem 1990; 191: 287–294. PMID:2085174
14. Royer CA. Improvements in the numerical analysis of thermodynamic data from biomolecular com-plexes. Anal Biochem 1993; 210: 91–97. PMID:8489028
15. George MJ. XAS-Collect: a computer program for X-ray absorption spectroscopic data acquisition. J Synchrotron Radiat 2000; 7: 283–286. PMID:16609209
16. Cramer S, Tench O, Yocum M, George GN. A 13-element Ge detector for fluorescence EXAFS. Nuclear Instruments and Methods in Physics Research Section A: Accelerators, Spectrometers, Detec-tors and Associated Equipment 1988; 266: 586–591.
17. George G, Garrett RM, Prince RC, Rajagopalan KV. The Molybdenum Site of Sulfite Oxidase: A Com-parison of Wild-Type and the Cysteine 207 to Serine Mutant Using X-ray Absorption Spectroscopy. Journal of the American Chemical Society 1996; 118: 8588–8592.
18. Rehr J, Mustre de Leon J, Zabinsky SI, Albers RC. Theoretical x-ray absorption fine structure stan-dards. Journal of the American Chemical Society 1991; 113: 5135–5140.
19. Rosenzweig AC, Frederick CA, Lippard SJ, Nordlund P. Crystal structure of a bacterial non-haem iron hydroxylase that catalyses the biological oxidation of methane. Nature 1993; 366: 537–543. PMID: 8255292
20. DeWitt J, Rosenzweig AC, Salifoglou A, Hedman B, Lippard SJ, Hodgson KO. X-ray Absorption Spec-troscopic Studies of the Diiron Center in Methane Monooxygenase in the Presence of Substrate and the Coupling Protein of the Enzyme System. Inorganic Chemistry 1995; 34: 2505–2515.
21. Westre T, Kennepohl P, DeWitt JG, Hedman B, Hodgson KO, Solomon EI. A Multiplet Analysis of Fe K-Edge 1s!3d Pre-Edge Features of Iron Complexes. Journal of the American Chemical Society 1997; 119: 6297–6314.
22. Allen F, Kennard O, Watson DG. Crystallographic Databases: search and retrieval of information from the Cambridge Structural Database. In: Burgi H-B, Dunitz J.D., editor. Structure Correlations. Wein-heim: VCH; 1994. pp. 71–110.
23. Allen FH. The Cambridge Structural Database: a quarter of a million crystal structures and rising. Acta Crystallogr B 2002; 58: 380–388. PMID:12037359
24. Yoon S, Lippard SJ. Water-dependent reactions of diiron(II) carboxylate complexes. J Am Chem Soc 2004; 126: 16692–16693. PMID:15612685
25. Lin ZZ, Jiang FL, Yuan DQ, Chen L, Zhou YF, Hong MC. The 3D channel framework based on indium (III)-btec, and its ion exchange properties (btec = 1,2,4,5-benzenetetracarboxylate). Eur J Inorg Chem 2005; 2005: 1927–1931.
26. Cotton F, Murillo CA, Walton RA. Multiple Bonds between Metal Atoms. Berlin: Springer. 2005.
28. Harris WR, Chen Y, Wein K. Equilibrium constants for the binding of indium(III) to human serum trans-ferrin. Inorg Chem 1994; 33: 4991–4998.
29. Harris WR. Binding and transport of nonferrous metals by serum transferrin. Structure and Bonding 1998; 92: 121–162.
30. Kovac S, Anderson GJ, Baldwin GS. Gastrins, iron homeostasis and colorectal cancer. Biochim Bio-phys Acta 2011; 1813: 889–895. doi:10.1016/j.bbamcr.2011.02.007PMID:21320535
31. Okamoto K, Miyawaki J, Nagai K, Matsumura D, Nojima A, Yokoyama T, et al. Structural Study on Highly Oxidized States of a Water Oxidation Complex [RuIII(bpy)
2(H2O)]2(µ-O)4+by Ruthenium K-Edge
X-ray Absorption Fine Structure Spectroscopy. Inorganic Chemistry 2003; 42: 8682–8689. PMID: 14686845
32. Urdaneta M, Stepanov P, Beylin D, Probst R, Weinberg I. Rapid Ge-68 breakthrough testing for 68Ge/ 68Ga portable generators. Journal of Nuclear Medicine 2013; 54: 1195.
33. Baldwin GS, Hollande F, Yang Z, Karelina Y, Paterson A, Strang R, et al. Biologically active recombi-nant human progastrin(6–80) contains a tightly bound calcium ion. J Biol Chem 2001; 276: 7791–7796. PMID:11113148
34. Seva C, Dickinson CJ, Yamada T. Growth-promoting effects of glycine-extended progastrin. Science 1994; 265: 410–412. PMID:8023165
35. Kowalski-Chauvel A, Najib S, Tikhonova IG, Huc L, Lopez F, Martinez LO, et al. Identification of the F1-ATPase at the cell surface of colonic epithelial cells: role in mediating cell proliferation. J Biol Chem 287: 41458–41468. doi:10.1074/jbc.M112.382465PMID:23055519
36. Singh P, Wu H, Clark C, Owlia A. Annexin II binds progastrin and gastrin-like peptides, and mediates growth factor effects of autocrine and exogenous gastrins on colon cancer and intestinal epithelial cells. Oncogene 2007; 26: 425–440. PMID:16832341
![Fig 6. Proposed structural models of FeIII2Ggly and RuIII2Ggly. The model for Fe III 2 Ggly (A) is based on the EXAFS data presented in Fig 5B, and is consistent with previous NMR and visible spectroscopic studies of Ggly and mutant peptides.[8,9,12] The t](https://thumb-eu.123doks.com/thumbv2/123dok_br/17103264.237577/15.918.65.640.107.992/proposed-structural-presented-consistent-previous-visible-spectroscopic-peptides.webp)
