Printed in Brazil - ©2007 Sociedade Brasileira de Química 0103 - 5053 $6.00+0.00
A
r
ti
c
le
*e-mail: [email protected]
Ammonium Ion Sensor Based on SiO
2/ZrO
2/phosphate-NH
4+Composite
for Quantification of Ammonium Ions in Natural Waters
Cláudia F. B. Coutinho,a Alfredo A. Muxel,a Crystian G. Rocha,a Débora A. de Jesus,a Rení V. S. Alfaya,a Flaveli A. S. Almeida,a Yoshitaka Gushikemb and Antonio A. S. Alfaya*,a
a
Departamento de Química, Universidade Estadual de Londrina, CP 6001, 86051-990 Londrina-PR, Brazil b
Instituto de Química, Universidade Estadual de Campinas, CP 6154, 13083-970 Campinas-SP, Brazil
Um eletrodo íon seletivo foi construído e avaliado para determinação de íons amônio em águas naturais. O eletrodo consiste de uma pasta de carbono com o compósito SiO2/ZrO2/
fosfato-NH4+ obtido pelo processo de sol-gel. O eletrodo exibe uma resposta sub-Nenstiana
para concentrações entre 7,7×10⁻⁷ e 4,0×10⁻² mol L-1 e um limite de detecção de 1,58×10⁻⁷ mol
L-1 (8,5×10⁻³ ppm). A resposta do eletrodo foi rápida (1 minuto). Os coeficientes de seletividade
Kpot
A,B para os diversos íons geralmente presentes em águas naturais foram determinados pela
aplicação do matched potential method. O método potenciométrico com o eletrodo íon seletivo foi validado pelo método de Berthelot (método padrão) pela determinação de íons amônio em águas naturais. O eletrodo íon seletivo provou ser satisfatório para o controle de qualidade de águas naturais.
Ion selective-electrode was constructed and evaluated for determination of ammonium ions in natural waters. The electrode consists of paste carbon with the composite SiO2/ZrO2 /phosphate-NH4+ obtained through sol-gel process. The electrode exhibits a sub-Nernstian response for ammonium
concentrations between 7.7×10⁻⁷ and 4.0×10⁻² mol L-1 and a detection limit of 1.58×10⁻⁷ mol L-1
(8.5×10⁻³ ppm). The electrode response for ammonium was fast (1 minute). The selectivity coefficients
Kpot
A,B for several ions usually present in natural waters were determined applying the matched
potential method. The potentiometric method with the ion selective electrode was validated by the Berthelot method (standard method), through the determination of ammonium ions in natural waters. The ion selective-electrode proved suitable for routine quality control of natural waters by potentiometry.
Keywords: ammonium ion sensor, potentiometric sensor, natural waters
Introduction
The presence of ammonium ions in rivers and lakes can be associated in most cases to pollution caused by livestock, intensive agriculture and mainly, nowadays, to liberation of domestic sewage in courses of superficial waters in an indiscriminate way and in larger and larger amounts.
Ammonium ion sensor is a useful tool in environmental pollution control,1 food and clinical analysis2-4 and other
industrial applications.5 Among the ion sensors,
ammonium sensor is also used more frequently as potentiometric biosensor in which enzymes or microbial cells are immobilized on the surface of the sensor.6,7 Due
to the many applications of the ammonium ion sensors,
design of solid-state sensor for ammonium and its fabrication through simple procedure are desirable.8
Inorganic ion exchangers are characterized by high thermal stability and resistivity towards strong oxidizing agents and mineral acids. Recently the SiO2/ZrO2/ phosphate composite was prepared by the sol-gel process,9
which allies the good properties of ionic exchange of the zirconium(IV) phosphate 10,11 in a matrix of mixed oxide,
SiO2/ZrO2 high and homogeneously dispersed. This composite presents high superficial area, phosphate groups on the surface of the same species and determinated as H2PO4–, a high thermal stability, a high proton exchange
capacity and a great affinity for ammonia gas with the formation of NH4+ ions on the solid’s surface.9
of a novel solid state ammonium ion sensor. This sensor offers the advantages of thermal stability, simplicity, sensitivity, reliability, low cost, fast response time and long life.
Experimental
Preparation of the SiO2/ZrO2/phosphate, SZP
The SiO2/ZrO2/phosphate composite was prepared by the sol-gel method according to the following procedure: 15.5 mL of 3.0 mol L-1 HCl solution were added to 250
mL of TEOS-ethanol solution in 1:1 (v/v) proportion (solution A), and the mixture was refluxed for 2.5 h. About 80 mL of 1.77 mol L-1 zirconium(IV) butoxide-ethanol
solution were slowly added to solution A, and the mixture was stirred for 3 h at room temperature. Finally, a solution containing a mixture of 75 mL of ethanol and 7.8 mL of 3.0 mol L-1 HCl solution was added, and the resulting
mixture was stirred for two hours at room temperature. The temperature of reaction flask was raised to 333 K to promote the complete gelation of the mixture. The solvent was evaporated by heating the resulting xerogel at 383 K for 24 h, and the solid was ground and sieved in order to obtain particles of a size between 0.15 and 0.25 mm. In 50 mL of 0.4 mol L-1 phosphoric acid solution 4 g xerogel
was dispersed. The mixture was shaken for 24 h, and the solid was filtered, washed, and dried at 353 K. The resulting solid was designated as SiO2/ZrO2/phosphate composite, SZP.
Preparation of the SiO2/ZrO2/phosphate-NH4+
About 500 mg of SZP was dispersed in 0.50 mol L-1
NH4Cl solution and left for 3 h in room temperature. The solid was filtered, washed with water and let dry in room temperature, obtaining the SiO2/ZrO2/phosphate-NH4+,
SZPA.
Chemical analyses
The SiO2/ZrO2/phosphate-NH4+ was treated with 40 wt.%
HF solution until complete dissolution of the sample. The resulting solution was diluted with 100 mL of water, and concentrated NH4OH was added until the hydrous zirconium oxide precipitated. The precipitate was allowed to stand for 3 h, filtered and washed with water. The solid phase was heated at 1073 K for 8 h and weighed as ZrO2. The solution phase was acidified with sulfuric acid, and the volume was adjusted. The quantity of phosphorus was determined spectrophotometrically using the molybdenum blue method.
Specific surface area and average pore volume
The specific surface area, SBET, was determined by the BET multipoint technique on a Micromeritcs Flowsorb II 2300 connected to a flow controller. The average pore volumes, Vp, were determined by the mercury intrusion technique on a Micromeritcs Pore Size 9320 equipment.
Scanning Electron Microscopy
The scanning electron microscopy (SEM) images of the samples were obtained by dispersing the powders on a double face conducting tape fixed on a brass support. The sample was coated with graphite by using the sputtering technique on a LVC 76 of Plasma Science Inc. equipment. The microscope used was a JEOL JSM T-300 connected to a secondary electron detector and an X-ray dispersive energy analyzer from Northern.
High power decoupling-magic angle spinning 31P NMR
The high power decoupling magic angle spinning (HPDEC-MAS) NMR spectra of the solids were obtained at room temperature on a Bruker AC300P spectrometer operating at 121 MHz. The conditions used were a sequential pulse with contact time of 5 ms and intervals between the pulses of 30 s. Phosphoric acid (85 wt.%) was used as reference.
Potentiometric measurements
All reagents used were of analytical grade. The water used was Milli-Qplus quality with resistivity higher than 18 MΩ cm-1.
The carbon paste electrode was prepared by intimately mixing 50 mg of graphite powder with 50 mg of SiO2/ ZrO2/phosphate-NH4+,SZPA, and a drop of mineral oil.
This paste was then put into a cavity consisting of a platinum disk sealed into the extremity of a glass tube. The cavity’s depth was 1 mm and it is important to reproduce the quality of the paste and the platinum disk to provide a good electrical contact.
The interference on the electrode response for most common components found in natural waters was evaluated by determining the potentiometric selectivity coefficient Kpot
A,B of the membrane using the matched
potential method which is independent of the Nicolsky-Eisenman equation and is recommended by IUPAC.12-14
prepared by appropriate dilution of the stock solution with water at pH 6.6.
For the evaluation of interferents normally found along with ammonium in natural waters (Fe3+, Mg2+, Mn2+, Ca2+,
Na+, Li+ and K+), were prepared solutions of interferents
and ammonium chloride at concentrations in the range of 9.0×10⁻² to 9.0×10⁻³ mol L-1 in water at pH 6.6.
In the study on the effects of [H+] on the electrode
response the solution pH was adjusted by adding H2SO4 or KOH.
The potentiometric measurements were carried out on a Hanna Instruments HI 9321 microprocessor pHmeter (sensitivity of 0.1 mV), using a reference saturated calomel electrode (SCE) with a saturated KNO3 salt bridge. All measurements were made in a thermostated cell at 298±1 K.
Natural waters samples
Samples of natural waters were collected in points of the river Tibagi next to water treatment station and in the lakes Igapó I, II and III of the Londrina city in Brazil.
All samples were filtered in quantitative filters and buffered to pH = 6.6. The determinations of the quantity of ammonium ions in the samples were accomplished immediately after the collection by the standard method (Berthelot)15 and for the potentiometric method. When
necessary, dilutions of the samples were accomplished with water buffered at pH = 6.6.
Results and Discussion
SiO2/ZrO2/phosphate-NH4+, SZPA, with the following
characteristics were obtained: Zr = 32.4 wt.%, P = 4.5 wt.%, NH4+ = 5.2 wt.%, specific surface area S
BET = 432
m2 g-1 and average pore volume of 0.29 mL g-1.
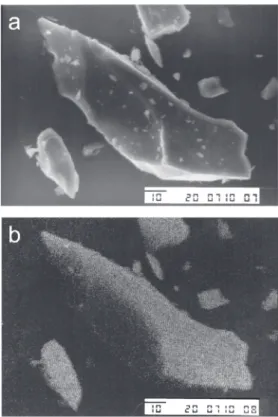
Figure 1a shows the SEM image of a SZPA particle, and Figure 1b shows the corresponding EDS image. The white points in Figure 1b are emission lines of ZrKα at 2.05 keV.16 Within the magnification used (× 1000), it is
very clear that the oxide particles are highly dispersed and no evidence of metal oxide island formation is detected.
Important information for the phosphate structures is given by the 31P NMR spectra for SZP as show in Figure
2. The main peak at -22.1 ppm is assigned to the H2PO4–
species and the other two with weak intensities at -13.7 and -27.8 ppm to the same species in different environments.17
The potential E generated at the electrode surface is the result of the summation of the potentials 18
E = Em + ΣEj+ ΔE, (1)
where Em is the potential due to the matrix resistance, ΣEj
is the summation of the liquid junction potentials, and ΔE is the potential difference between the internal and external membrane. In the present case E
m and ΣEj are constant during the measurements, so the above equation is reduced to,
E = E’ + ΔE, (2)
where E’ = Em + ΣE
j.
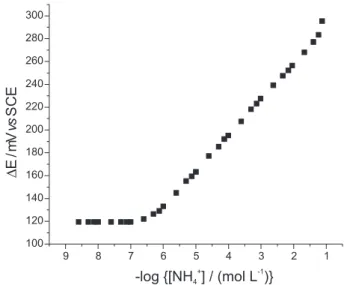
For the development of the potentiometric method using ion-selective electrode SZPA some analytical parameters, such as stability of the electrode membrane, response time, life time, dependence of the potential as a function of the ammonium concentration and pH of the medium were studied. The selectivity and the detection limit of the electrode were evaluated.
The effect of the hydrogen ion concentration, in the pH range of 1.0 to 10.0, on the electrode response for ammonium concentrations of 1.0×10⁻³, 1.0×10⁻⁴ and
1.0×10⁻⁵ was also evaluated. The results obtained are
potential was observed, which could be explained by total proton exchange of the phosphate groups of SZP composite. For solutions with pH in range from 3.0 to 6.0 a decrease of the potential was observed. In acid solutions the proton ions compete with the adsorbed NH4+ ions by
an ion exchange reaction and the latter can be leached off from the surface and released to the solution phase. For solutions with pH over 7.0, a decrease of the potential was also observed. In alkaline solutions the hydroxyl anion reacts with the acid proton of the group phosphate present in the surface of the composite SZPA. The proton exchange of SZP for ammonium ions in aqueous solution happens in a fast way. However, due to the pH 6.2 of the solution 5.0×10⁻¹ mol L-1 NH
4Cl, the total exchange of the acid
protons by ammonium ions is not expected, but it is expected that this happens in a partial way, as it can be observed in the Figure 4. Between pH 6.0 and 7.0, the potentiometric measurements can be done with buffering the solutions. In samples the pH correction is necessary. The electrode response time, for ammonium solutions in concentrations range of 7.7×10⁻⁷ to 4.0×10⁻² mol L-1 was
of about one minute. No potential changes were obtained after 10-14 hours of continuous sampling of an ammonium solution. Also, no memory effect was observed for ten determinations of ammonium solutions alternating the concentrations between 1.0×10⁻⁶ and 1.0×10⁻² mol L-1. The
electrode showed a life-time of six months with 1000 determinations for each sensor membrane, with a decrease in potential of only 10% in relation to the initial response. The analytical curve (Figure 5) shows a linear relationship between the electrode potential and the logarithmic concentration of ammonium in the range of 7.7×10⁻⁷ and
4.0×10⁻² mol L-1 with a sub-Nernstian response of 31.3 mV
decade-1 and a correlation coefficient of 0.9999. The detection
limit was calculated as 1.58×10⁻⁷ mol L-1 (8.5×10⁻³ ppm),
which is a detection limit value smaller in comparison with other potentiometric sensors reported.19-21
The interference of ions which are normally found in natural waters such as Fe3+, Mg2+, Mn2+, Ca2+, Na+, Li+
and K+, which could interfere on the electrode response,
was verified by determining the Kpot
A,B of the membrane
Figure 2. HPDEC MAS 31P NMR spectrum of SZP. Peaks marked (*)
indicates the spinning sidebands.
Figure 3. Effect of the solution pH on the response of the SZPA ion se-lective electrode. Ammonium concentrations: () 1.0×10⁻³ mol L-1, ({)
1.0×10⁻⁴ mol L-1 and (S) 1.0×10⁻⁵ mol L-1.
Figure 4. Schematic representation of the SZPA surface in the solution pH 6.6.
by applying the matched potential method which is independent of the Nicolsky-Eisenman (N-E) equation.12
To determine the selectivity coefficient the change in potential was measured upon changing the primary ion concentration. The interfering ion was then added to an identical reference solution until the same potential change was obtained. The change in potential must be produced in a constant initial background of the primary ion and must be the same in both cases.12,13 Table 1 shows the
average calculated values, from five determinations for each sample, by using this methodology. The Fe3+ ion
presents a great affinity for the composite SZPA, although this is not very preoccupying because in samples of natural waters Fe3+ is usually found insoluble or metal-complex.
The selectivity order obtained for the interferents of unitary charge was Na+ > Li+ > K+. This unexpected
behavior was already observed in the literature22 for the
zirconium(IV) phosphate. The selectivity coefficient values compared favorably not only with the commercial NH4+ ion glass electrode,23 but also with others of
literature.20,24
Validation
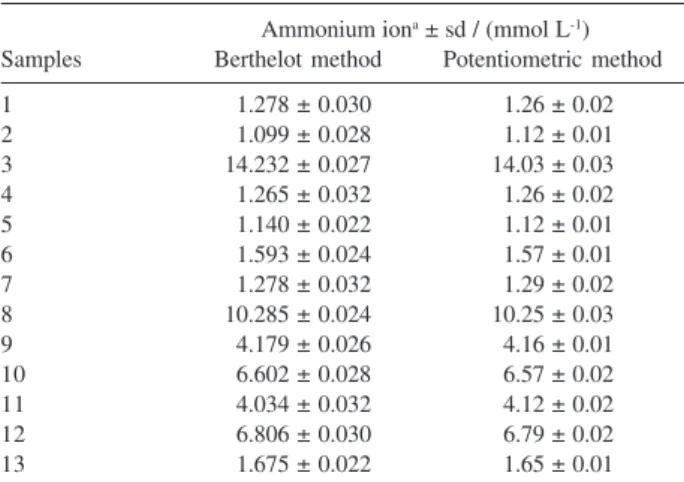
The potentiometric method with the ammonium ion selective electrode developed was validated by comparison with the Berthelot method in the quantification of ammonium, in thirteen natural water samples.
The natural water samples were used in both methods (Berthelot and potentiometric) without previous treatment. The analytical curve in the Berthelot method15 was
linear in the concentration range of 4 to 40 µmol L-1 of
ammonium ions (y= 0.00497 + 0.03641x, where x is the concentration of ammonium ion in µmol L-1 and y is the
absorbance). The correlation coefficient of the regression equation was 0.9998.
The analytical curve in the potentiometric method was linear in the logarithmic concentration of ammonium
range of 7.7×10⁻⁷ and 4.0×10⁻² mol L-1 (y = 320.9824
-31.3469 log[NH4+]) and a correlation coefficient of 0.9999.
The results obtained for ammonium determination in natural water samples by potentiometry and standard method are shown in Table 2. The mean values obtained (Table 2) by the two methodologies do not differ significantly.
Conclusions
The ion-selective electrode described in this paper, presents the following advantages: it can easily prepared, presents high chemical stability, it is highly selective to ammonium and has low fabrication cost. The response time was relatively short, approximately one minute, and the detection limit was 1.58×10⁻⁷ mol L-1 (8.5×10⁻³ ppm).
Detection of relatively high ammonium ion concentrations (4.0×10⁻² mol L-1) may be attributed to the high capacity
of ion exchanger composite. The high stability of the SZPA and high affinity of the ammonium ion by the solid graphite/SZPA phase makes the electrode potentially useful in determining ammonium ion in natural waters. The potential electrode application in the determination of ammonium ion in natural waters is possible.
Acknowledgment
The authors are indebted to UEL for financial support.
References
1. Alexander, P. W.; Dikitrakopoloulos, T.; Hibbert, D. B.;
Electroanalysis 1997, 9, 1331.
Table 2. Comparative results for ammonium ions content in natural wa-ters by Berthelot and potentiometric methods
Ammonium iona ± sd / (mmol L-1)
Samples Berthelot method Potentiometric method
1 01.278 ± 0.030 01.26 ± 0.02
2 01.099 ± 0.028 01.12 ± 0.01
3 14.232 ± 0.027 14.03 ± 0.03
4 01.265 ± 0.032 01.26 ± 0.02
5 01.140 ± 0.022 01.12 ± 0.01
6 01.593 ± 0.024 01.57 ± 0.01
7 01.278 ± 0.032 01.29 ± 0.02
8 10.285 ± 0.024 10.25 ± 0.03
9 04.179 ± 0.026 04.16 ± 0.01
10 06.602 ± 0.028 06.57 ± 0.02
11 04.034 ± 0.032 04.12 ± 0.02
12 06.806 ± 0.030 06.79 ± 0.02
13 01.675 ± 0.022 01.65 ± 0.01
aAssay values represent average of ten (n=10) determinations; sd:
stan-dard deviation of the mean value (10 determinations) of the concentra-tion of the ammonium ion.
Table 1. Potentiometric selectivity coefficients for the ammonium ion-selective electrode Kpot
A,B determined by method recommended by
IUPAC16
Interferent ion (B) Selectivity coefficients (Kpot
A,B)
Fe3+ 0.58
Mg2+ 0.12
Fe2+ 0.11
Mn2+ 0.10
Ca2+ 0.09
Na+ 0.08
Li+ 0.07
2. Magalhaes, J. M. C. S.; Machado, A. A. S. C.; Analyst 2002, 127, 1069.
3. Palleschi, G.; Mascini, M.; Martinez-Fabregas, E.; Alegret, S.; Anal. Lett. 1988, 21 ,1115.
4. Lima, J. F. C. C.; Delerue-Matos, C.; Cristina, C. V. M.; Anal. Chim. Acta 1999, 385 , 437.
5. Suzuki, T.; Yasuda, T.; Yamane, T.; Shimizu, S.; J. Ferment. Technol. 1986, 64,63.
6. Ikeda, M.; Hichaya, H.; Ito, S.; Asanao, Y.; Imato, T.; Biosensor Bioelectr.1998, 13,531.
7. Okada, T.; Karube, I.; Suzuki, S.; Anal. Chim. Acta 1982, 135, 159.
8. Heng, L. Y.; Alva, S.; Ahmad, M.; Sens. Actuators, B 2004, 98, 160.
9. Alfaya, A. A. S.; Gushikem, Y.; de Castro, S. S.; Microporous Mesoporous Mater. 2000, 39, 57.
10. Clearfield, A.; Inorganic Ion Exchange Materials; CRC Press: Boca Raton, FL, 1982, pp. 16-20.
11. Dyer, A.; Shaheen, T.; Zamin, M.; J. Mater. Chem. 1997,7, 1895.
12. Umezawa, Y.; Umezawa, K.; Sato, H.; Pure Appl. Chem. 1995, 67, 507.
13. Gadzekpo, V. P. Y.; Christian, G. D.; Anal. Chim. Acta 1984, 164, 279.
14. Alfaya, R. V. S.; Alfaya, A. A. S.; Gushikem, Y.; Rath, S.; Reyes, F. G. R.; Anal. Lett. 2000,33, 2859.
15. Patton, C. J.; Crouch, S. R.; Anal. Chem. 1977,49, 464. 16. Goodhew, P. J.; Humphreys, F. J.; Electron Microscopy and
Analysis, 2nd ed., Taylor and Francis: London, 1992.
17. Segawa, K. -I.; Nakajima, Y.; Nakata, S. -I.; Asaoka, S.; Takahashi, H.; J. Catal. 1986 , 101, 81.
18. Lorencetti, L. L.; Gushikem, Y.; Kubota, L. T.; Oliveira Neto, G.; Fernandes, J. R.; Mikrochim. Acta 1995, 117, 239. 19. Reichert, W. J.; Sellien, W.; Ache, H. J.; Sens. Actuators, A
1991,26, 481.
20. Hassan, S. M.; Marei, S. A.; Badr, I. H.; Arida, H. A.; Anal.
Chim. Acta2001, 427, 21.
21. Handbook of Fine Chemicals and Laboratory Equipment; Aldrich, 2000-2001, p. T507.
22. Clearfield, A.; Inorganic Ion Exchange Materials;CRC press: Boca Raton, Florida, 1982, p. 18.
23. Guilbault, G. G.; Smith, R. K.; Montalvo D.; Anal. Chem. 1969,
41, 600.
24. Longhi P.; Mussini, T.; Nardi, F. M.; Rondinini, S.; Nouv. J.
Chim. – New J. Chem. 1979, 3, 649.
Received: August 10, 2006
Web Release Date: January 24, 2007