M
U
L
T
ID
IM
E
N
S
ION
A
L
IN
D
IC
A
T
OR
S
T
O
E
V
A
L
U
A
T
E
S
C
H
O
OL
IN
F
R
A
S
T
R
UC
T
U
R
E
: E
L
E
M
E
N
T
A
R
Y
S
C
H
O
OL
S
7
0
8
C
A
D
E
R
N
O
S D
E P
E
S
Q
U
IS
A
v
.4
8 n
.1
6
9 p
.7
0
8
-7
4
7 j
u
l.
/s
e
t. 2
0
18
I Universidade Federal de Minas Gerais (UFMG), Belo Horizonte (MG), Brazil; [email protected]
II Universidade Federal de Minas Gerais (UFMG), Belo Horizonte (MG), Brazil; [email protected]
III Viamundi Idiomas
e Traduções
MULTIDIMENSIONAL INDICATORS
TO EVALUATE SCHOOL
INFRASTRUCTURE: ELEMENTARY
SCHOOLS
MARIA TERESA GONZAGA ALVESI
FLAVIA PEREIRA XAVIERII
TRANSLATED BY PETER LASPINAIII
ABSTRACT
This article provides a set of indicators to evaluate the infrastructure of public elementary schools which provide primary and lower secondary education in Brazil. It assumes that infrastructure is a complex construct, which justifies its evaluation on multiple dimensions. It uses data of The School Census on basic education and the National Assessment System for Basic Education, from 2013 to 2015. The results show that the infrastructure improved during this period, but the patterns of inequality known in the literature remained. Rural, small, municipal schools in the North and Northeast regions have lower means for all indicators. There are positive associations between indicators of infrastructure and socioeconomic level and the Index of Development of Basic Education. SCHOOL INFRASTRUCTURE • EDUCATIONAL INDICATORS •
SCHOOL INEQUALITY • BASIC EDUCATION
INDICADORES MULTIDIMENSIONAIS
PARA AVALIAÇÃO DA INFRAESTRUTURA
ESCOLAR: O ENSINO FUNDAMENTAL
RESUMO
Apresentamos um conjunto de indicadores para avaliar a infraestrutura das escolas públicas de ensino fundamental brasileiras. Partimos do pressuposto que a infraestrutura é um construto complexo, o que justifica a sua avaliação por múltiplas dimensões. Utilizamos os dados do Censo Escolar da Educação Básica e do Sistema de Avaliação da Educação Básica (Saeb), de 2013 e 2015. Os resultados apontam para melhora da infraestrutura no período, mas os padrões de desigualdade conhecidos da literatura se repetem. As escolas rurais, pequenas, municipais, do Norte e Nordeste têm médias mais baixas em todos os indicadores. Também verificamos associação de mesmo sentido dos indicadores de infraestrutura com o nível socioeconômico e o Índice de Desenvolvimento da Educação Básica (Ideb).
INFRAESTRUTURA ESCOLAR • INDICADORES EDUCACIONAIS •
DESIGUALDADES ESCOLARES • ENSINO FUNDAMENTAL
M
a
ri
a T
e
re
s
a G
o
n
z
a
g
a A
lv
e
s a
n
d F
la
v
ia P
e
re
ir
a X
a
v
ie
r
C
A
D
E
R
N
O
S D
E P
E
S
Q
U
IS
A
v
.4
8 n
.1
6
9 p
.7
0
8
-7
4
7 j
u
l./
se
t. 2
0
18
70
9
https://doi.org/10.1590/198053145455
INDICATEURS MULTIDIMENSIONNELS POUR
L’ÉVALUATION DE L’INFRASTRUCTURE
SCOLAIRE À L’ÉDUCATION DE BASE
RÉSUMÉ Cet article présente une série d’indicateurs pour évaluer l’infrastructure des établissements scolaires publics brésiliens. Nous partons de l’hypothèse que l’infrastructure est une construction complexe, ce qui justifie une évaluation multidimensionnelle. Nous avons utilisé les
données du Censo Escolar da Educação Básica [Rencensement de l’Éducation
de Base] et du Sistema de Avaliação da Educação Básica (Saeb [Système
d’Évaluation de l’Éducation de Base]), de 2013 et de 2015. Les résultats ont montré que l’infrastructure s’est améliorée au cours de cette période, bien que les degrés d´inégalité recensés par la littérature persistent Les petites écoles des communes rurales des régions Nord et Nord-Est enregistrent des moyennes plus basses pour tous les indicateurs. Nous avons également vérifié qu’il existait des associations positives entre
les indicateurs d’infrastructure, le niveau socio-économique et l’Índice
de Desenvolvimento da Educação Básica (Ideb [Indice de Développement de
l’Éducation de Base]).
INFRASTRUCTURE SCOLAIRE • INDICATEURS DE L’ÉDUCATION •
INÉGALITÉS SCOLAIRES • EDUCATION DE BASE
INDICADORES MULTIDIMENSIONALES PARA
EVALUACIÓN DE LA INFRAESTRUCTURA
ESCOLAR: LA EDUCACIÓN BÁSICA
RESUMEN
Presentamos un conjunto de indicadores para evaluar la infraestructura de las escuelas públicas brasileñas de educación básica. Partimos del supuesto de que la infraestructura es un constructo complejo, lo que justifica su evaluación por múltiples dimensiones. Utilizamos los datos del Censo Escolar da Educação Básica [Censo de la Educación Básica] y del Sistema de Avaliação da Educação Básica (Saeb [Sistema de Evaluación de la Educación Básica]), de 2013 y 2015. Los resultados muestran que la infraestructura mejoró en el periodo, pero los estándares de desigualdades mencionados en la literatura se repiten. Las escuelas rurales, pequeñas, municipales, del Norte y Noreste presentan promedios más bajos para todos los indicadores. También verificamos asociaciones positivas entre los indicadores de infraestructura con el nivel socioeconómico y el Índice de Desenvolvimento da Educação Básica (Ideb [Índice de Desarrollo de la Educación Básica]).
INFRAESTRUCTURA ESCOLAR • INDICADORES EDUCACIONALES •
M
U
L
T
ID
IM
E
N
S
ION
A
L
IN
D
IC
A
T
OR
S
T
O
E
V
A
L
U
A
T
E
S
C
H
O
OL
IN
F
R
A
S
T
R
UC
T
U
R
E
: E
L
E
M
E
N
T
A
R
Y
S
C
H
O
OL
S
7
10
C
A
D
E
R
N
O
S D
E P
E
S
Q
U
IS
A
v
.4
8 n
.1
6
9 p
.7
0
8
-7
4
7 j
u
l.
/s
e
t. 2
0
18
CHOOL INFRASTRUCTURE IS AN ISSUE OF GREAT INTEREST IN BRAZIL DUE TO THE heterogeneity of the educational provision in the country and the
relationship of this issue with educational outcomes (CERQUEIRA;
SAWER, 2007; SÁTYRO; SOARES, 2007; SOARES; ALVES, 2013; SOARES
NETO et al., 2013a). Studies on this theme contain an abundance of
public data produced by the National Institute for Educational Studies and Research “Anísio Teixeira” (local acronym is INEP) , which provides
systematic information on the material conditions of schools in Brazil.1
The importance of infrastructure is recognized by The Law of Guidelines and Bases of National Education (local acronym LDB) and in the national education plans. Although the LDB does not refer directly to infrastructure, it establishes minimum quality standards for educational provision and defines supplementary and redistributive actions between the federal and state levels to ensure the financing of these standards (BRASIL, 1996).
The 2001 National Education Plan (local acronym is PNE) established the minimum infrastructure standards for elementary schools which provide primary and lower secondary education and
set deadlines for schools to meet them (BRASIL, 2001)2. However, these
goals were not fully achieved in the decade. The 2014 PNE maintained the provision of appropriate infrastructure as strategic for quality of education, not only for elementary school but for all stages of basic
education and educational modalities (BRASIL, 2014c).3
S
1 INEP is a research agency linked to the Ministry of Education in Brazil. It is responsible for assessing basic education and higher education nationally. It also provides educational statistics that help formulate, implement, monitor, and evaluate educational policies at the federal, state and local government levels. Information available at: <http://portal.inep.gov.br/web/guest/about-inep>. Access: August 28,
M
a
ri
a T
e
re
s
a G
o
n
z
a
g
a A
lv
e
s a
n
d F
la
v
ia P
e
re
ir
a X
a
v
ie
r
C
A
D
E
R
N
O
S D
E P
E
S
Q
U
IS
A
v
.4
8 n
.1
6
9 p
.7
0
8
-7
4
7 j
u
l./
se
t. 2
0
18
7
11
The 2014 PNE provides for the development of institutional evaluation indicators to follow up and contextualize its goals and strategies (BRASIL, 2014c, art. 11, paragraph 1, item II). Therefore, this article aims to contribute to this effort by presenting a set of indicators to evaluate the infrastructure of elementary school, which, according to the International Standard Classification of Education (ISCED), provide primary education and lower secondary education, or ISCED 1 and ISCED 2 (BRASIL, 2016a).
From a review of the literature on the topic, we defined infrastructure dimensions and indicators based on data from the Census on Basic Education – better known as School Census – and from the National Assessment System for Basic Education (local acronym is SAEB), both produced by INEP. Aiming to describe types of schools, we constructed twelve indicators − eleven to measure specific aspects of school infrastructure and a general indicator to synthesize those eleven.
We focused on elementary schools, since the other stages and modalities of education have particularities regarding infrastructure and their relationship with the pedagogical work. Therefore, it would be arbitrary to deal with them in the same theoretical and empirical scope. Nevertheless, we kept in the analyses the elementary schools which, in addition to primary and lower secondary education, also provide early childhood or upper secondary education.
This study is organized in five sections. After this introduction, we present the review of the literature that guided the definition of indicators. In the methodology, we describe the data used, the treatment of variables, and the statistical procedures employed. Then, we present the results of the indicators. In the final considerations, we discuss contributions, limitations and possible uses of the indicators.
LITERATURE REVIEW
The concept of infrastructure in education is multifaceted. The term includes the architectural design of the schools, educational and administrative environments, equipment and educational resources, practices, curriculum, teaching and learning processes, as well as teacher training to use available resources. In order to understand these concepts, we reviewed the literature on quantitative empirical research on infrastructure and school resources or related features since 2000.
The Brazilian literature includes many studies that use Brazilian School Census data to characterize infrastructure (ALMEIDA et al., 2011; CERQUEIRA; SAWER, 2007; GOMES; DUARTE, 2017; MATOS; RODRIGUES, 2016; PASSADOR; CALHADO, 2012; PIERI; SANTOS, 2014; PONTILI; KASSOUF, 2007; RIANI; RIOS-NETO, 2008; SOARES; ALVES; XAVIER, 2016; SÁTYRO; SOARES, 2007; SOARES NETO et al.,
2 (cont.)
children from 0 to 3 years of age (nursery schools) and from 4 to 5 (pre-school); (ii) elementary schools, divided into ISCED 1 or primary education, for children aged from 6 to 10 years of age, and ISCED 2 or lower secondary education, for children aged approximately 11 to 14 years; and (iii) ISCED 3 or upper secondary education, with a minimum of three years’ attendance, from 15 to 17 years of age (BRASIL, 2016a). 3
M
U
L
T
ID
IM
E
N
S
ION
A
L
IN
D
IC
A
T
OR
S
T
O
E
V
A
L
U
A
T
E
S
C
H
O
OL
IN
F
R
A
S
T
R
UC
T
U
R
E
: E
L
E
M
E
N
T
A
R
Y
S
C
H
O
OL
S
7
12
C
A
D
E
R
N
O
S D
E P
E
S
Q
U
IS
A
v
.4
8 n
.1
6
9 p
.7
0
8
-7
4
7 j
u
l.
/s
e
t. 2
0
18
2013a; 2013b). Among them, we draw attention to those that describe the methodological solutions employed to summarize the data into understandable measures on infrastructure.
Cerqueira and Sawer (2007), based on the 2000 Brazilian School Census, built a typology of schools considering the social context, infrastructure (available resources and facilities) and functional features. The method employed was the Grade of Membership (GoM), which led them to identify three major groups of schools. The first group, which included 58.4% of the units, consisted of poorly-equipped schools, mostly small elementary schools, located in rural areas in the north and northeast regions. In the second group, which included 24.7% of the schools, schools were medium or large sized, and offered equipment and basic facilities, but were not computerized. The third group, including 14.7% of the schools, was composed of well-equipped computerized schools, which had good facilities, usually in urban areas located in the south, southeast and mid-west regions. In addition to these, Cerqueira and Sawer identified a small number of schools with hybrid profiles.
Based on the 1997 to 2005 Brazilian School Census data, Sátyro and Soares (2007) observed an improvement in elementary schools during this period. The percentage of schools that did not have access to energy fell from 41% in 1997 to 16% in 2005. In 1997, only 26% of the schools had positive values for the school facilities infrastructure index and, at the end of the period, there were 42% of them. This index was calculated using factor analysis. The percentage of schools with a library or reading room increased from 57% in 1997 to 64% in 2005. However, rural and municipal schools remained far behind at the end of the period.
M
a
ri
a T
e
re
s
a G
o
n
z
a
g
a A
lv
e
s a
n
d F
la
v
ia P
e
re
ir
a X
a
v
ie
r
C
A
D
E
R
N
O
S D
E P
E
S
Q
U
IS
A
v
.4
8 n
.1
6
9 p
.7
0
8
-7
4
7 j
u
l./
se
t. 2
0
18
7
13
education, sports court, playground, and additional equipment like photocopiers and internet access. Only 0.6% of the schools reached the advanced level of infrastructure. Such schools usually had, in addition to the previous items, science labs and appropriate facilities to cater to special needs students. The schools of these last two groups were above all federal and private, located in urban areas in the south, southeast and mid-west regions.
In another publication deriving from this same survey, Soares Neto et al. (2013b) focused on small schools, those with 10 to 200 students. This segment was composed mostly by rural schools, located in the states of the North and Northeast of Brazil, and most of them provided simple infrastructure (51.8%).
Based on the 2013 Brazilian School Census data, but limiting the analysis to public elementary schools, Gomes and Duarte (2017) described a much better situation in comparison to previous studies. They created four profiles of schools using a Latent Class Model (LCM) which summarized 26 items regarding basic facilities and resources, as well as equipment and teaching facilities. The higher profile, with better infrastructure, included most elementary schools (42%), comprising 81.2% of primary and lower secondary education enrollment. These schools had virtually all items considered in the analysis, except a science lab and resource room, which were not consistent with any of the profiles. The middle-upper profile included 23.7% of the schools and 14.7% of the enrollment. These had no teaching facilities, and only limited basic facilities and teaching resources. 22.7% of the schools were classified in the medium-low profile, which accounted for 3% of the enrollment. These schools lacked equipment and teaching facilities, and offered limited services and basic facilities. Finally, only 11% of the schools were included in the low infrastructure profile, with only 1.1% of students. They were schools that had barely any facilities, just the building and water. In addition to these profiles, 0.1% of the schools were classified as having an ambiguous profile.
It should be noted that the studies reviewed so far converge strongly on the Brazilian School Census items used to describe infrastructure. However, there are differences in the interpretation of the distribution of the quality of this attribute. After all, do we really have very few schools with good infrastructure (SOARES NETO et al, 2013a; CERQUEIRA; SAWER, 2007)? Or, is it that most public schools have a higher quality profile (GOMES; DUARTE, 2017)? Although school infrastructure is still unsatisfactory, has it been improving (SÁTYRO; SOARES, 2007)?
M
U
L
T
ID
IM
E
N
S
ION
A
L
IN
D
IC
A
T
OR
S
T
O
E
V
A
L
U
A
T
E
S
C
H
O
OL
IN
F
R
A
S
T
R
UC
T
U
R
E
: E
L
E
M
E
N
T
A
R
Y
S
C
H
O
OL
S
7
14
C
A
D
E
R
N
O
S D
E P
E
S
Q
U
IS
A
v
.4
8 n
.1
6
9 p
.7
0
8
-7
4
7 j
u
l.
/s
e
t. 2
0
18
they considered data from one or more editions of the Brazilian School Census data. The methodologies can also contribute to different results: for example, if continuous scales or infrastructure categories (groups) were estimated. Another influencing factor can be the type of item of the Brazilian School Census data. Most of them measure the presence or absence of an attribute (dichotomous scale), a metric that does not quite highlight the subtle differences among schools.
SAEB data’s advantage lies in this last aspect. The questionnaires of this evaluation consist of ordinal variables that measure the existence and conditions of use of school facilities and resources. In general, researchers reduce these variables to an infrastructure factor using multivariate statistical techniques. The estimated ranges, given the ordinal metrics for items, have more points for measuring the differences among schools. However, SAEB’s coverage is much lower compared to the Brazilian School Census data, although it is
representative of the school profiles eligible for this assessment.4 It
is worth mentioning that, in studies of educational evaluation, the focus is not on the infrastructure but on the association of this factor with school performance, which is always positive in Brazil (ALVES; FRANCO, 2008; ALVES; SOARES, 2013; BARBOSA; FERNANDES, 2001; SOARES; CÉSAR; MAMBRINI, 2001; SOARES; ALVES; XAVIER, 2015; SOARES et al., 2012).
We also reviewed international research. Part of this literature, as in Brazilian studies, focuses on the basic operating conditions of schools, including special needs students (DUARTE; JAUREGUIBERRY; RACIMO, 2017; GIBBERD, 2007; VALDÉS et al., 2008). However, especially in developed countries, researchers are interested in understanding how learning environments, technologies and external spaces create the necessary conditions and environments to promote the well-being
of students, to mediate the relationship betweenteachers and students
and to promote academic achievement (BLACKMORE et al., 2011; CUYVERS et al, 2011; SCHNEIDER, 2002; YOUNG et al., 2003).
The review of the literature showed that the definition of school infrastructure is closely linked to the available empirical data. In general, the studies consider the existence of basic items for the building’s operation (access to services, bathrooms), educational spaces (libraries, teachers' lounges, laboratories) and support spaces (administrative rooms, dining areas), teaching resources (computers, books, TVs) and accessibility. Less evident in Brazilian empirical studies, but no less important, are issues related to favorable environments for teaching and learning, such as thermal and acoustic comfort and safety, in addition to respect for gender differences and the requirements for special needs education.
4 SAEB is composed of the
M
a
ri
a T
e
re
s
a G
o
n
z
a
g
a A
lv
e
s a
n
d F
la
v
ia P
e
re
ir
a X
a
v
ie
r
C
A
D
E
R
N
O
S D
E P
E
S
Q
U
IS
A
v
.4
8 n
.1
6
9 p
.7
0
8
-7
4
7 j
u
l./
se
t. 2
0
18
7
15
Moving from concept to measurement constitutes a major challenge to social research. Many concepts present definitions with subtle nuances, and it is difficult to identify their limits exactly. When trying to operationalize concepts, a loss of detail, foreseen by the researcher, is expected. In the absence of a clear agreement on how to measure a particular concept, it is recommended to measure it in different ways and, if it has multiple dimensions, to try to measure them all (BABBIE, 2010). This was the path taken in this research.
Initially, we proposed a set of theoretical constructs related to infrastructure. Then, we translated them into empirical indicators using public Brazilian data, as we shall explain in the next section. The testing process was complex, with several rounds of tests. Therefore, in this article we present only the final solution.
METHODOLOGY: DATA AND PROCEDURES
DATA
We used data from the Brazilian School Census and SAEB databases, both from 2013 and 2015. The choice of these editions is justified because, whenever possible, we reconciled the Brazilian School Census data, which is an annual survey, with the SAEB data, which are biennial and whose latest version, at the time of the study, was from 2015. From the Brazilian School Census database, we used the questionnaires about schools and classes, from which we obtained information about school location, operating conditions, characteristics of the facilities, existence of pedagogical resources,
accessibility, and more. From the SAEBdatabase, we used information
from the questionnaires regarding the schools, as well as those filled
out by the principals.5
Although our main objective is to evaluate the infrastructure of public schools, during the estimating processes we included private schools both from the Brazilian School Census and the SAEB database, to diversify the profiles of educational establishments. Table 1 summarizes the data used. In total, 143,170 public and private elementary schools that provide primary and lower secondary education, exclusively or not, are analyzed.
5
M
U
L
T
ID
IM
E
N
S
ION
A
L
IN
D
IC
A
T
OR
S
T
O
E
V
A
L
U
A
T
E
S
C
H
O
OL
IN
F
R
A
S
T
R
UC
T
U
R
E
: E
L
E
M
E
N
T
A
R
Y
S
C
H
O
OL
S
7
16
C
A
D
E
R
N
O
S D
E P
E
S
Q
U
IS
A
v
.4
8 n
.1
6
9 p
.7
0
8
-7
4
7 j
u
l.
/s
e
t. 2
0
18
TABLE 1
NUMBER OF SCHOOLS ACCORDING TO EDITION AND RESEARCH
Year Census* SAEB**
2013 143,170 54,835
2015 135,939 53,470
Source: Based on microdata from the School Census data and from SAEB data, 2013 and 2015. Notes: *The number of schools analyzed will always match the total number of schools from the School Census, as SAEB schools are also part of the School Census, and the inverse is not true;
** SAEB combines Prova Brasil (public schools) and ANEB in the same database − the sub-sample of schools not eligible for Prova Brasil, representing private and public schools with fewer than 20 students.
As the focus of the present study is standard elementary schools, which provide primary and lower secondary education, we excluded establishments which provide only early childhood, upper secondary or adult education. However, elementary schools that provide primary or lower secondary education, as well as other stages and modalities, were kept in the analysis. In 2015, they represented 72.9% of the schools in the Brazilian School Census and received 57.2% of enrollment in early
childhood, primary, and secondary education.6
Initially, we selected all variables in the questionnaires that could characterize school infrastructure. Thus, we identified 158 variables which measured the theoretical constructs related to infrastructure, and other variables that would be used later just as discriminants (for example, school location, stage, etc.). However, some variables were excluded after each phase of analysis. These decisions are described below.
In the Brazilian School Census questionnaire of schools, the variables selected are identical in the two editions, except for one, related to their having multifunction printers, which was absent in 2013. This did not prevent the use of this information, due to the model used for the estimation of indicators.
The classroom variables of the Brazilian School Census questionnaire were aggregated to obtain a single measure per school. The number of classrooms that had infrastructure items was counted. Then, the counting variables were added to the database of the schools.
At the database of the Brazilian School Census, interval level variables were recodified as ordinal, such as: (1) all variables from the database of the classrooms that were obtained from counting one item within each school; and (2) all the original variables from the database of schools that reported the number of a particular item in the school (for example, number of TV sets).
From the SAEB database, we used the information from the questionnaires of schools and principals but, in this case, it was more difficult to reconcile data from 2013 and 2015. Some variables were not present in the two editions, or the items of the questionnaires were
M
a
ri
a T
e
re
s
a G
o
n
z
a
g
a A
lv
e
s a
n
d F
la
v
ia P
e
re
ir
a X
a
v
ie
r
C
A
D
E
R
N
O
S D
E P
E
S
Q
U
IS
A
v
.4
8 n
.1
6
9 p
.7
0
8
-7
4
7 j
u
l./
se
t. 2
0
18
7
17
different from one year to the following one, even when addressing the same topic. We reconciled the information as best we could. Solutions were analyzed on a case-by-case basis, using the most recent scale as reference (2015).
Finally, we merged in the same database information from the Brazilian School Census and the SAEB data.
CONSTRUCTION OF INDICATORS
The methodology for estimating the infrastructure indicators consisted of adjusting models of Item Response Theory (IRT), appropriate for variables with binary or graded response data (HAMBLETON, 1993; SAMEJIMA, 1969). The models assume unidimensionality, that is, the existence of a single, latent, dominant construct in the data set. To test this assumption, we used Principal Components Analysis (PCA) and
Polychoriccorrelation. PCA is an exploratory method for synthesizing
a matrix of data to express its structure in a smaller number of dimensions, frequently used as the first step in modeling. Polychoric correlation is indicated because the tested variables are ordinal or dichotomous. Additionally, we analyzed the Item Characteristic Curves (ICC) and the Item Information Curves (IIC). The ICC reflects the different probabilities of an individual choosing a response category, given the score in the latent dimension (indicator), and IIC reflects the contribution of each item to the construct to be estimated.
Our analyses showed that the indicators fit our theoretical assumptions, with some exceptions. A few variables presented negative correlation with others and were excluded. We also excluded some SAEB variables that had a correspondent in the Brazilian School Census data and whose categories, although on an ordinal scale, have a dichotomous distribution. As the information from the Brazilian School Census data is always much more representative, it did not make sense to keep SAEB
variables that did not provide additional information.Finally, from the
Brazilian School Census data, we combined variables that measure the same construct, creating new variables with an ordinal scale that fit the model better.
M
U
L
T
ID
IM
E
N
S
ION
A
L
IN
D
IC
A
T
OR
S
T
O
E
V
A
L
U
A
T
E
S
C
H
O
OL
IN
F
R
A
S
T
R
UC
T
U
R
E
: E
L
E
M
E
N
T
A
R
Y
S
C
H
O
OL
S
7
18
C
A
D
E
R
N
O
S D
E P
E
S
Q
U
IS
A
v
.4
8 n
.1
6
9 p
.7
0
8
-7
4
7 j
u
l.
/s
e
t. 2
0
18
system, but without ignoring the schools that did not have this service for reasons outside of educational policy. The same was done with similar items. These solutions allowed the categories of the items to be distinguished appropriately, improving their capacity to provide information about the respective indicators.
In the end, we used 61 items to estimate eleven indicators: basic services, building facilities, damage prevention, maintenance, comfort, pleasant environment, pedagogic spaces, equipment for administrative support, equipment for pedagogic support, accessibility, special needs education. To synthesize these eleven indicators, a general infrastructure indicator was also calculated that allowed identifying the relative weight of the 61 items and to describe school typologies. Descriptive statistics for the items are shown in Table A1 in the Appendix. We also show, in the Appendix, an example of an analysis of the items to test their adjustment to the assumptions of the IRT (Table A2 and Figures
A1 and A2).7
The original scores of the indicators obtained by the IRT models are expressed in standard deviations. To make them more interpretable, they were transformed into a scale from 0 (zero) to 10 (ten) points. It is important to emphasize that a value of zero does not mean lack of infrastructure, neither does a value of 10 mean the entirety of what could exist in a school. They measure the gradual growth from a worse situation (expressed in the value of zero) to the best situation (expressed in the value of ten) in relation to the items analyzed in the present study.
As mentioned above, we selected a set of discriminant variables in the databases. In this article, we used the following: school sector,
location, region, states, educational stages, grade levels, and number
of students. In addition to these, we brought the following indicators, developed by INEP, to the analyses: level of management complexity, Index of Socioeconomic Status (SES), Index of Development of Basic Education (IDEB) of the primary education and lower secondary
education.8 The descriptive statistics for these variables are shown in
Table A3, in the Appendix.
RESULTS
DIMENSIONS, INDICATORS AND VARIABLES OF SCHOOL INFRASTRUCTURE
The indicators and discriminant variables were organized into five dimensions of school infrastructure: school conditions, teaching and learning conditions, equity conditions, space conditions, and school organization types.
7 Due to issues of space, we
do not show the analyses of all indicators. They can be sent to interested parties upon request.
M
a
ri
a T
e
re
s
a G
o
n
z
a
g
a A
lv
e
s a
n
d F
la
v
ia P
e
re
ir
a X
a
v
ie
r
C
A
D
E
R
N
O
S D
E P
E
S
Q
U
IS
A
v
.4
8 n
.1
6
9 p
.7
0
8
-7
4
7 j
u
l./
se
t. 2
0
18
7
19
The school conditions dimension measures the quality of the
building and the spaces in which the school functions, including the indicators of basic services, building facilities, damage prevention, building maintenance, comfort of the facilities, and pleasant
environment. The dimension teaching and learning conditions refers to
the aspects most closely linked to the pedagogic work of the school and includes the pedagogic spaces, equipment for administrative
support and equipment for pedagogical support. The equity conditions
dimension encompasses indicators that measure accessibility and the provision of a special needs education. Ideally, this dimension should contain more indicators of inclusion and respect for differences such as gender, ethnicity and age, but the available data do not permit us to measure them.
The discriminant variables are distributed into two dimensions.
The space conditions dimension comprises variables intended to
characterize important enclaves of Brazilian education, such as the school location in either an urban or a rural area, the regions and
the states. The school organization types dimension shows variables that
measure the educational stages, grade levels and school size. Other discriminant variables were systematized (e.g., capital or countryside, school schedules, modalities of instruction), but were not analyzed in the present study.
CORRELATION AMONG INFRASTRUCTURE INDICATORS
M
U
L
T
ID
IM
E
N
S
ION
A
L
IN
D
IC
A
T
OR
S
T
O
E
V
A
L
U
A
T
E
S
C
H
O
OL
IN
F
R
A
S
T
R
UC
T
U
R
E
: E
L
E
M
E
N
T
A
R
Y
S
C
H
O
OL
S
720
C
A
D
E
R
N
O
S D
E P
E
S
Q
U
IS
A
v
.4
8 n
.1
6
9 p
.7
0
8
-7
4
7 j
u
l.
/s
e
t. 2
0
18
TABLE 2
LINEAR CORRELATION MATRIX OF THE INDICATORS OF SCHOOL INFRASTRUCTURE QUALITY
Indicators Linear correlation coefficients
1. Basic services (1) (2) (3) (4) (5) (6) (7) (8) (9) (10) (11)
2. Building facilities 0,73
3. Damage prevention 0.33 0.34
4. Maintenance 0.18 0.25 0.56
5. Comfort 0.19 0.26 0.48 0.62
6. Pleasant atmosphere 0.59 0.67 0.27 0.20 0.20
7. Pedagogical spaces 0.63 0.72 0.30 0.17 0.22 0.56
8. Equipment for administrative
support 0.76 0.78 0.35 0.18 0.23 0.62 0.80
9. Equipment for pedagogical
support 0.68 0.71 0.26 0.14 0.16 0.58 0.69 0.82
10. Accessibility 0.42 0.50 0.20 0.22 0.17 0.44 0.49 0.49 0.44
11. Special needs education 0.20 0.28 0.08 0.04 0.04 0.18 0.29 0.28 0.26 0.28
12. General infrastructure 0.83 0.87 0.68 0.81 0.64 0.69 0.80 0.89 0.85 0.54 0.27
Source: Based on microdata from the School Census data and from SAEB data, 2013 and 2015. Note: All the coefficients are statistically significant at 1%.
DESCRIPTIVE ANALYSIS OF INFRASTRUCTURE INDICATORS
Ma ria T ere sa G on za ga A lv es a nd F la via P ere ira X av ie r CA
DE RN OS D E PE SQ UIS A v.4 8 n.1 69 p .7 08 -74 7 ju l./ se t. 2 018 721 TABLE 3
MEANS OF SCHOOL INFRASTRUCTURE INDICATORS (*) FOR BRAZIL AND BY SECTOR, LOCATION AND REGIONS, 2013 AND 2015
Year Brazil Sector Location Region
Federal State Municipal Private Urban Rural North Northeast Southeast South Midwest
Basic services
2013 6.9 9.7 8.3 6.0 9.3 8.8 4.5 4.4 6.1 8.9 8.1 7.8
2015 7.1 9.7 8.3 6.2 9.3 8.8 4.6 4.5 6.4 9.0 8.2 7.9
Building facilities 2013 6.0 8.6 7.5 5.3 7.1 7.7 4.2 4.4 5.1 7.5 7.3 6.9
2015 6.3 9.0 7.6 5.6 7.4 7.8 4.4 4.6 5.4 7.7 7.6 7.2
Damage prevention
2013 6.4 8.4 6.6 6.1 9.1 6.6 4.8 5.2 5.3 7.2 7.2 6.6
2015 6.6 8.8 6.6 6.4 9.2 6.7 5.1 5.4 5.6 7.2 7.3 6.6
Maintenance
2013 6.5 8.5 6.5 6.4 9.0 6.6 5.7 5.9 5.9 7.1 6.6 6.4
2015 6.5 8.5 6.4 6.5 9.1 6.6 5.9 6.0 6.0 7.0 6.7 6.2
Comfort
2013 6.8 9.0 7.2 6.4 9.2 6.9 5.5 5.7 5.6 7.7 7.4 6.6
2015 6.8 8.7 7.0 6.5 9.2 6.9 5.6 5.6 5.7 7.6 7.4 6.4
Pleasant atmosphere
2013 3.3 6.4 4.0 2.5 5.6 4.3 1.5 1.6 2.2 4.8 5.3 4.2
2015 3.8 7.1 4.3 3.0 6.2 4.7 2.0 2.0 2.9 5.1 5.9 4.8
Pedagogical spaces 2013 3.1 8.0 5.0 2.3 4.0 4.8 1.3 1.7 2.1 4.4 4.9 4.5
2015 3.1 7.6 5.0 2.4 3.9 4.7 1.3 1.7 2.1 4.4 4.9 4.4
Equipment for administrative
support
2013 3.6 8.2 5.6 2.6 5.4 5.5 1.4 2.0 2.5 5.3 5.3 5.3
2015 3.8 7.2 5.6 2.9 5.3 5.4 1.7 2.1 2.8 5.3 5.3 5.2
Equipment for pedagogical support
2013 3.9 7.4 5.6 3.1 4.9 5.6 2.0 2.1 3.0 5.2 5.5 5.1
2015 4.3 7.0 5.7 3.7 5.4 5.8 2.5 2.4 3.6 5.5 5.9 5.5
Accessibility
2013 3.3 5.1 4.3 2.7 4.4 4.7 1.7 2.3 2.7 3.8 4.5 5.5
2015 3.8 5.2 4.8 3.2 4.8 5.2 2.1 2.6 3.2 4.2 5.5 5.9
Special needs education
2013 0.7 0.3 1.2 0.7 0.1 1.6 0.2 0.5 0.3 0.8 1.5 1.3
2015 0.9 1.2 1.5 0.9 0.1 1.9 0.3 0.7 0.5 1.1 1.7 1.6
General infrastructure
2013 5.2 7.7 6.3 4.6 6.5 6.4 3.7 3.7 4.6 6.3 6.3 6.1
2015 5.4 7.7 6.3 4.9 6.6 6.5 4.0 3.9 4.9 6.4 6.5 6.2
Source: Based on microdata from the School Census data and from SAEB data, 2013 and 2015.
M
U
L
T
ID
IM
E
N
S
ION
A
L
IN
D
IC
A
T
OR
S
T
O
E
V
A
L
U
A
T
E
S
C
H
O
OL
IN
F
R
A
S
T
R
UC
T
U
R
E
: E
L
E
M
E
N
T
A
R
Y
S
C
H
O
OL
S
7
2
2
C
A
D
E
R
N
O
S D
E P
E
S
Q
U
IS
A
v
.4
8 n
.1
6
9 p
.7
0
8
-7
4
7 j
u
l.
/s
e
t. 2
0
18
The second group of means in the table refers to the school sector (federal, state, municipal, and private schools). Educational segregation, according to sector, is a fact known in the literature, and the differences in the conditions of school infrastructure are evidence of this phenomenon (SÁTYRO; SOARES, 2007; SOARES
NETO et al, 2013a). This pattern is repeated in this study. Federal and
private schools systematically present higher averages than do state and municipal schools. The federal schools stand out in the general indicator and especially in the indicators for basic services, building facilities, pleasant environment, pedagogic spaces, equipment for administrative support, equipment for pedagogical support, and accessibility. For three indicators − damage prevention, maintenance and comfort −, the highest means pertain to private schools. However, those schools present the lowest mean for special needs education, for which the highest means are in the state schools. This may indicate that regular classrooms in the private sector have not incorporated the principle of equity in education.
Regarding the evolution of the indicators, two stand out: pleasant environment and accessibility. For the latter, the most notable growth occurs in state and municipal schools, reflecting the investment in this area. On the other hand, the indicators referring to maintenance, comfort, pedagogic spaces, and equipment for administrative support showed a slight drop in at least two sectors. These results show that the indicators that suffer most over time and that require constant maintenance are the ones that improve the least.
The differences in infrastructure between urban and rural schools are highlighted both in the Brazilian (CERQUEIRA; SAWYER; 2007; GOMES; DUARTE; 2017; SÁTYRO; SOARES, 2007; SOARES NETO et al., 2013a; 2013b) and in the international literature (DUARTE; JAUREGUIBERRY; RACIMO, 2017; GIBBERD, 2007). Table 3 shows that the means of the urban schools are higher than those of the rural schools, which corroborates the literature. Part of our results may reflect the way that the indicators were measured. The items from the Brazilian School Census and the SAEB data were not developed to describe the specificities of rural schools in a deeper way, especially
those from different locations, like indigenous and quilombola ones.9
We also know that rural areas have less access to public services which directly affect the schools (CAMPELLO, 2017). In spite of this, even items that do not reflect the territory directly show very distinct differences. For example, the indicator for pedagogic spaces in the rural area is more than three times lower than this indicator in the urban area.
However, the indicators reveal that, even among urban schools, there are aspects that deserve attention. For example, the low mean value of the special needs education indicator. In rural schools, 9
M
a
ri
a T
e
re
s
a G
o
n
z
a
g
a A
lv
e
s a
n
d F
la
v
ia P
e
re
ir
a X
a
v
ie
r
C
A
D
E
R
N
O
S D
E P
E
S
Q
U
IS
A
v
.4
8 n
.1
6
9 p
.7
0
8
-7
4
7 j
u
l./
se
t. 2
0
18
72
3
although they have lower averages than in urban schools, the growth was greater for almost all indicators except for accessibility and special needs education.
The descriptive statistic output of the indicators, by the Brazilian Federal states, forms a very extensive table; that is why only the regions are presented in Table 3. The results per state are in the Appendix (Table A4). We found that the patterns of regional inequalities are similar to those in the literature (GOMES; DUARTE, 2017; CERQUEIRA; SAYWER, 2007; SOARES NETO et al., 2013a; 2013b). Schools in the South and Southeast systematically have higher averages than schools in the North and Northeast. The Midwest appears almost always in the middle, except for the Federal District, which has several higher indicators. However, it should be noted that, in the Northeast, the state of Ceará showed the highest mean for the general indicator as well as for several indicators for the year 2015. In the North, Rondônia and Tocantins states stand out even with scores lower than those found in the South and Southeast states.
Keeping in mind that the focus of our study is on public elementary schools, private schools were excluded from the analyses which follow, in Table 4. We did the same with federal schools, since only 46 of them offer primary or lower secondary education (0.1% less than all schools).
Table 4 shows the distribution of the means of the indicators according to the educational stage, school grade levels, the number of students, the level of complexity of management, the SES Index, and the IDEB of the primary education and lower secondary education. We present only data from 2015 for this set of discriminant variables.
According to the first group of means in Table 4, public schools that provide primary, lower and upper secondary education generally have higher means than schools without upper secondary education. This result may be explained by the fact that the schools with more advanced grades have facilities and resources that were assessed in this study; for example, science laboratories. Soares Neto et al. (2013a) and Gomes & Duarte (2017) observed a different pattern of this item in the assessment of the infrastructure of elementary schools with primary and lower secondary education. Our results reinforce these findings. However, we support the inclusion of science laboratories because this is one of the educational spaces included in the minimum quality standards for this level of education (BRASIL, 2015). Elementary schools need to improve their extracurricular pedagogic spaces, not only in schools that provide advanced grades of education.
M
U
L
T
ID
IM
E
N
S
ION
A
L
IN
D
IC
A
T
OR
S
T
O
E
V
A
L
U
A
T
E
S
C
H
O
OL
IN
F
R
A
S
T
R
UC
T
U
R
E
: E
L
E
M
E
N
T
A
R
Y
S
C
H
O
OL
S
7
2
4
C
A
D
E
R
N
O
S D
E P
E
S
Q
U
IS
A
v
.4
8 n
.1
6
9 p
.7
0
8
-7
4
7 j
u
l.
/s
e
t. 2
0
18
parameters for this stage. However, it is strange that indicators for the equity dimension (accessibility and special needs education) and pleasant environment, which are essential for small children, also have low scores for schools that provide early childhood education. This infrastructure is only appropriate in the very large schools with all stages of basic education.
In the second group of means in Table 4, the schools that
provide only 1st to 5th grades have lower infrastructure scores for
nearly all indicators, except for damage prevention, maintenance and comfort. In general, the higher scores are concentrated in the schools
that provide only 6th to 9th grades. These results should be analyzed
contextually since 68.3% of the municipal schools provide only 1st to
5th grades and they are more concentrated in the rural areas of the
country (information in Table A2, Appendix). In other words, a part of this pattern is due to the location of these schools, which present the most weaknesses. Obviously, this caveat does not justify the lack of policies to match the conditions of the provision.
The total enrollment in the municipal and state schools in 2015
is a proxy to school size. In the literature reviewed, the infrastructure
Ma ria T ere sa G on za ga A lv es a nd F la via P ere ira X av ie r CA DE RN OS D E PE SQ UIS A v.4 8 n.1 69 p .7 08 -74 7 ju l./ se t. 2 018 725 TABLE 4
MEANS OF SCHOOL INFRASTRUCTURE INDICATORS BY STAGE, GRADE LEVELS, NUMBER OF STUDENTS, MANAGEMENT COMPLEXITY, SES AND IDEB 2015
D isc ri m in a n ts V a ri a bl e s Indicators* B a sic s e rv ic es B u il d in g fa c il it ies D a m a g e p re v e n ti o n M a in tena n c e C om for t P lea sa n t a tm o sp her e P e d ag o gi c a l sp a ce s E q u ip m e n t f o r a d m in is tr ati v e sup po rt E q u ip m e n t f o r ped a g o g ic al sup po rt A cce ss ib il it y S pe c ial n e ed s e d u c ati o n G ener a l in fr a str uc tu re E d uc a ti ona l s tag es
Primary and lower secondary education 7.2 6.4 6.5 6.5 6.7 3.5 3.3 3.9 4.4 4.0 1.4 5.5
Early childhood, primary and lower secondary education 5.7 5.3 6.2 6.5 6.4 2.8 2.0 2.6 3.4 2.8 0.7 4.6
Primary, lower and upper secondary education 8.7 8.1 6.7 6.4 7.1 4.6 5.7 6.1 6.2 5.3 1.5 6.6
Early childhood, primary, lower and upper secondary education. 7.4 7.7 6.8 6.5 7.5 5.3 4.9 5.3 5.7 5.2 2.1 6.4
G ra d e le v e
ls 1st to 5th grade 6.0 5.2 6.6 6.7 6.7 2.7 2.0 2.6 3.3 2.8 0.7 4.6
6th to 9th grade 8.7 8.0 6.7 6.4 6.9 4.4 5.3 5.8 6.0 5.1 1.3 6.5
1st to 9th grade 6.9 6.8 6.2 6.3 6.5 3.9 3.8 4.3 4.9 4.4 1.6 5.7
N u m b e r o f s tu d e nt
s Up to 50 4.0 3.5 4.5 6.0 6.8 1.3 0.7 0.8 1.4 1.5 0.0 3.2
More than 50 to 150 5.8 5.3 5.5 6.1 6.2 2.9 2.1 2.8 3.7 2.6 0.4 4.8
More than 150 to 400 7.8 7.1 6.2 6.3 6.4 4.3 3.8 4.6 5.3 4.5 1.5 6.2
More than 400 8.9 8.3 6.8 6.6 7.0 4.9 5.3 5.9 6.1 5.7 2.3 6.7
C o m p le x it y o f m a n a g e me n t i n d e x le v e ls
1 (lower) 4.6 4.0 6.5 6.6 6.9 1.8 1.1 1.3 1.9 1.8 0.1 3.6
2 6.8 5.9 6.5 6.6 6.7 3.3 2.5 3.4 4.1 3.2 0.9 5.2
3 7.2 6.8 6.5 6.5 6.7 4.0 3.6 4.3 4.9 4.3 1.5 5.8
4 7.5 6.9 6.6 6.4 6.9 3.8 4.2 4.6 5.0 4.4 1.3 5.8
5 7.4 6.8 6.3 6.3 6.4 3.6 3.7 4.3 4.9 4.4 1.5 5.8
MULTIDIMENSIONAL INDICATORS TO EVALUATE SCHOOL INFRASTRUCTURE: ELEMENTARY SCHOOLS 726 CADERNOS DE PESQUISA v.48 n.169 p.708-747 jul./set. 2018
D isc ri m in a n ts V a ri a bl e s Indicators* B a sic s e rv ic es B u il d in g fa c il it ies D a m a g e p re v e n ti o n M a in tena n c e C om for t P lea sa n t a tm o sp her e P e d ag o gi c a l sp a ce s E q u ip m e n t f o r a d m in is tr ati v e sup po rt E q u ip m e n t f o r ped a g o g ic al sup po rt A cce ss ib il it y S pe c ial n e ed s e d u c ati o n G ener a l in fr a str uc tu re S E S I n d e x l ev e ls
Very low 4.4 5.2 4.0 5.5 5.1 2.2 1.7 2.4 3.5 2.0 0.4 4.8
Low 6.2 6.1 4.9 5.8 5.4 3.1 2.8 3.6 4.7 3.4 0.8 5.6
Medium low 7.6 6.9 5.5 6.0 5.7 3.7 3.8 4.4 5.3 4.7 1.5 6.1
Medium 8.5 7.8 6.4 6.3 6.4 4.4 4.6 5.3 5.8 5.4 2.0 6.4
Medium high 9.2 8.4 7.3 6.9 7.5 5.3 5.3 6.1 6.3 5.5 2.2 6.8
High 9.5 8.5 7.8 7.1 7.9 5.8 5.7 6.3 6.5 5.6 2.4 7.0
Very high 9.4 8.3 8.0 7.9 8.2 6.0 5.9 6.5 6.7 5.6 1.6 7.1
ID E B o f p ri m a ry e d uc a ti on
Low 6.7 6.2 4.8 5.6 5.1 3.2 2.7 3.5 4.4 3.4 0.9 5.7
Medium low 7.6 7.0 5.5 5.9 5.6 3.9 3.5 4.2 5.1 4.7 1.6 6.1
Medium 8.4 7.7 6.4 6.4 6.5 4.7 4.4 5.2 5.8 5.4 2.3 6.5
Medium high 9.1 8.2 7.2 7.0 7.4 5.2 5.0 5.8 6.2 5.6 2.5 6.8
High 9.3 8.3 7.6 7.3 7.8 5.5 5.2 6.1 6.4 5.5 2.4 6.9
ID E B o f l o w e r s ec o n d a ry e d uc a ti on
Low 7.8 7.5 5.7 5.8 5.7 4.1 4.3 4.8 5.4 5.1 1.7 6.2
Medium low 8.4 8.0 6.4 6.3 6.6 4.6 5.1 5.5 5.9 5.6 2.2 6.5
Medium 8.8 8.2 6.9 6.8 7.3 5.0 5.5 6.0 6.3 5.9 2.6 6.8
Medium high 9.0 8.4 7.5 7.2 7.9 5.5 5.7 6.2 6.4 5.9 2.5 7.0
High 8.7 8.1 7.4 7.6 7.6 5.6 5.7 6.1 6.4 6.3 2.5 7.0
Source: Based on microdata from the School Census data and from SAEB data, 2013 and 2015.
M
a
ri
a T
e
re
s
a G
o
n
z
a
g
a A
lv
e
s a
n
d F
la
v
ia P
e
re
ir
a X
a
v
ie
r
C
A
D
E
R
N
O
S D
E P
E
S
Q
U
IS
A
v
.4
8 n
.1
6
9 p
.7
0
8
-7
4
7 j
u
l./
se
t. 2
0
18
7
2
7
The management complexity indicator from INEP synthesizes the variables already presented in the “school organization types” dimension (educational stage, school grade levels and number of students), but also includes other variables from the Brazilian School Census data, such as modalities of instruction and school schedules. The indicator is divided into six categories, where group 1 corresponds to the lowest level of complexity and group 6 to the highest level. In schools with lower levels of complexity, the scores of the twelve indicators are also lower. This result confirms previous analyses.
The management complexity indicator implicitly assumes that school management is more difficult in larger schools with more stages and greater range of grade levels. This assumption is strongly embedded in the well-known relationship between this indicator and educational results (ALVES; SOARES, 2013). But it is not the same in the case of infrastructure. More complex schools are better prepared in terms of infrastructure. For example, the existence of an auditorium or sport courts may be limited by the physical space available in schools. However, we know that most schools have lower complexity: almost 70% of them are at complexity groups 1, 2 or 3 (Table A2, Appendix). For this reason, the group of specialists designated by the Ministry of Education to study the implementation of the PNE 2014 strategies on student cost/quality recommended that schools use community infrastructure to compensate for space limitations (BRASIL, 2015).
The educational literature shows that students from less advantaged social origins attend schools with weaker infrastructure conditions (GOMES; DUARTE, 2017; SOARES NETO et al., 2013b). Our study confirms this by analyzing the SES index, whose scale was divided into seven groups: group 1 corresponds to the lowest level and group 7 to the highest level. As the SES index was calculated based on the data from educational assessments conducted by INEP, there are valid scores for the schools which participated in those assessments. Thus, only 48% of the elementary schools were analyzed. However, the sample is representative of the set of Brazilian basic education schools. Table 4 shows that the higher the SES, the higher the scores of the infrastructure indicators, with the exception of the special needs education indicator. The evidence is that schools with higher SES are less equitable in this aspect.
M
U
L
T
ID
IM
E
N
S
ION
A
L
IN
D
IC
A
T
OR
S
T
O
E
V
A
L
U
A
T
E
S
C
H
O
OL
IN
F
R
A
S
T
R
UC
T
U
R
E
: E
L
E
M
E
N
T
A
R
Y
S
C
H
O
OL
S
7
2
8
C
A
D
E
R
N
O
S D
E P
E
S
Q
U
IS
A
v
.4
8 n
.1
6
9 p
.7
0
8
-7
4
7 j
u
l.
/s
e
t. 2
0
18
in Soares & Xavier (2013). As IDEB involves data from educational assessments, when we analyzed the relationship between the index and infrastructure indicators, we were dealing only with the schools
that participated in Prova Brasil. We found that, in primary education
(1st to 5th grade), the highest scores of the infrastructure indicators are
concentrated in the highest levels of IDEB. In lower secondary education
(6th to 9th grade), the pattern is similar. However, at this stage, the means
for some indicators at the “high” level of IDEB are slightly lower than those found at the “medium high” level. This result may be showing only that, at this level, students are in schools with more resources than those for small children, among those analyzed in this study.
GENERAL INDICATOR OF INFRASTRUCTURE
The description of school infrastructure with these indicators emphasized a multiple view of this construct. However, to interpret the meaning of a school with high, medium or low scores, we need the items to be comparable. We did this with the general indicator, which synthesizes the 61 items used in the previous analyses.
To do this, all the items were placed in ascending order, according to their respective B parameters, estimated using IRT. The nature of the infrastructure scale is equivalent to the already known proficiency scale for national educational assessments. The B parameter refers to the difficulty of the item and is expressed in the same scale as the proficiency. The higher the B value, the more difficult the item and the higher the proficiency is. Thus, the B parameter informs the position of the item on the scale of the latent trace. In this study, the latent trace refers to the infrastructure quality; that is, the higher the B value is, the more the item is associated with a better infrastructure. For example, in the TV item, the category “one TV” has the B parameter equal to 3.74 points, a lower value than the “Computer Lab”, which
is 5.12 points.10 This is because, although the latter is necessary for
contemporary pedagogic work, it is still less common than TV sets and, therefore, is associated with a higher quality of infrastructure. Figure A3 of the Appendix shows the mapping with the scaling of all items.
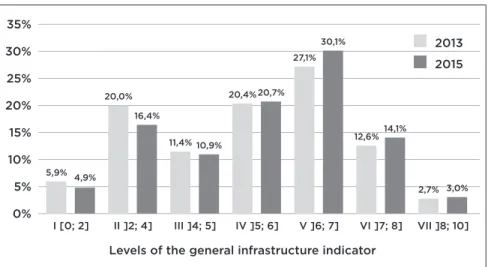
The next step was to analyze this mapping by creating quality levels for general infrastructure. There are appropriate methodologies for defining cutoff points in proficiency scales (ZIEKY; PERIE, 2006). Use of expert judgment is one of these methodologies. We chose to define the cutoff points on the infrastructure scale in this way, which allowed us to consider the specificity of the school. Following this decision, the scale was sectioned into six points according to the B parameter scores of the general infrastructure items. This created seven levels, which are: (I) up to 2 points, corresponding to the least appropriate situation; (II) more than 2, up to 4 points; (III) more than 4, up to 5 points; (IV) more
M
a
ri
a T
e
re
s
a G
o
n
z
a
g
a A
lv
e
s a
n
d F
la
v
ia P
e
re
ir
a X
a
v
ie
r
C
A
D
E
R
N
O
S D
E P
E
S
Q
U
IS
A
v
.4
8 n
.1
6
9 p
.7
0
8
-7
4
7 j
u
l./
se
t. 2
0
18
72
9
than 5, up to 6 points; (V) more than 6, up to 7 points; (VI) more than 7, up to 8 points; and (VII) more than 8 points, corresponding to the most appropriate situation. These levels reflect the gains in quality, according to the attributes measured using the variables and their respective categories.
Table 5 summarizes the interpretation of the levels of the scale of the general infrastructure. The first column shows the seven groups. The second column summarizes the characteristics of the schools described by the items placed at the same intervals as the values, according to the mapping shown in Figure A3 in the Appendix. The last column describes the typical profile of the school at that level, obtained from a descriptive analysis of the levels by discriminant variable. We emphasize that this analysis included all public and private schools.
M
U
L
T
ID
IM
E
N
S
ION
A
L
IN
D
IC
A
T
OR
S
T
O
E
V
A
L
U
A
T
E
S
C
H
O
OL
IN
F
R
A
S
T
R
UC
T
U
R
E
: E
L
E
M
E
N
T
A
R
Y
S
C
H
O
OL
S
7
3
0
C
A
D
E
R
N
O
S D
E P
E
S
Q
U
IS
A
v
.4
8 n
.1
6
9 p
.7
0
8
-7
4
7 j
u
l.
/s
e
t. 2
0
18
TABLE 5
LEVELS OF GENERAL INFRASTRUCTURE SCALE, ITS INTERPRETATION AND TYPICAL SCHOOL PROFILE
Level Interpretation Typical profile*
I (<= 2)
There are no toilets, or if there are, they are outside the building; there is no running water, or, when there is, it is from a river, a well or a natural source; there is no electricity or it uses a generator or something similar; there is no sewer, but in this group there are schools with a septic tank; there may be a kitchen and filtered water.
North region; rural; municipal sector; up to 50 pupils; elementary school or elementary and preschool (-); very low SES.
II (+ 2 a 4)
There is water from an artesian well, bathroom inside the school and electricity; 1 TV and 1 DVD player; and there is little sign of depredation.
North and Northeast regions; rural; municipal sector; up to 50 pupils or more than 50 up to 150 pupils; elementary and pre-school or only elementary school; very low and low SES.
III (+4 a 5)
There are: water and electricity from the public system and waste collection; a teachers’ lounge; a schoolyard; a sound system; a camera; a printer; a computer for administrative use; 1 to 5 computers for pupils; Internet (but not broadband). There are: physical and equipment security; classrooms, kitchen, corridors, roofs, paved floors, doors, etc. There is regular maintenance, but windows and external lighting are in bad shape; but the classrooms are lit.
Northeast region; rural; municipal sector; up to 50 pupils, or more than 50 up to 150 pupils; elementary and preschool; very low or low medium SES.
IV (+5 a 6)
In addition to the previous items, there is sewage; the maintenance of walls, windows, floors, etc. is good, without depredation; the maintenance of the schoolyard, plumbing and electrical installations and the bathrooms is regular; outdoor lighting and fire protection is bad or regular; there are: a library or reading room, a computer lab, an outdoor schoolyard, pantry and warehouse, airy and well-lit classrooms, airy and well-lit library, multimedia equipment, a photocopier, broadband internet, 2 printers, 2 TV sets, 2 sound systems, 3 DVD players, 2 to 3 computers for administrative use, 6 to 10 computers for pupils, barely adequate accessibility.
Northeast and Midwest regions; urban; state (+) and municipal sector; more than 50 to 400 pupils; all levels of basic education; very low and medium SES.
V (+6 a 7)
In addition to the previous items, there are: a science lab, 4 to 7 computers for administrative use, 11 to 20 computers for pupils, at least 3 printers, of which one is multifunctional, at least 3 TV sets, sound systems, DVD players, 2 cameras, multimedia equipment (2), 2 photocopiers, bathrooms with showers in good condition, an indoor court, a green area, children's playground, indoor and outdoor schoolyards, a cafeteria, and accessible facilities and bathrooms. Fire protection is regular or good; outdoor lighting is good; plumbing and electrical installations are good; good general state of maintenance.
Midwest, Southeast and South regions; urban; state, municipal and private sector; from 150 to 400, or more than 400 pupils; all levels of basic education; low to high medium SES.
VI (+ 7 a 8)
In addition to the previous items, there are: a reading room and library; auditorium; outdoor and indoor courts; 20 or more computers for pupils; 7 or more computers for administrative use; multimedia equipment (3 or more), photocopiers and cameras; 2 multifunction printers; infrastructure for the disabled is appropriate.
Southeast, South and Midwest (-) regions; urban; federal, state and private sector; more than 400 students; elementary school or elementary school and upper secondary education; high medium to very high SES.
VII (> 8)
In addition to all previous items, there are 3 or more multifunctional printers; accessible information technology; resources for special needs education (alternative augmentative communication, Soroban, Braille).
South and Southeast region; urban, federal sector; more than 400 pupils; all levels of basic education; high and very high SES.