ISSN: 2049-3444 © 2012 – IJET Publications UK. All rights reserved.
1753
Analysis of Sequence Based Classifier Prediction for HIV Subtypes
1
S. Santhosh Kumar,
2E. Ramaraj
1
Department of Computer Science, Government College Kumbakonam PRIST University,Thanjavur, Tamil Nadu, India
2
Alagappa University , Karaikudi, Tamil Nadu, India
ABSTRACT
Human immunodeficiency virus (HIV) is a lent virus that causes acquired immunodeficiency syndrome (AIDS). The main drawback in HIV treatment process is its sub type prediction. The sub type and group classification of HIV is based on its genetic variability and location. HIV can be divided into two major types, HIV type 1 (HIV-1) and HIV type 2 (HIV-2). Many classifier approaches have been used to classify HIV subtypes based on their group, but some of cases are having two groups in one; in such cases the classification becomes more complex. The methodology used is this paper based on the HIV sequences. For this work several classifier approaches are used to classify the HIV1 and HIV2. For implementation of the work a real time patient database is taken and the patient records are experimented and the final best classifier is identified with quick response time and least error rate.
Keywords: HIV, ID3, LDA, SVM, C4.5, Sensitivity and Specificity
1.
INTRODUCTION
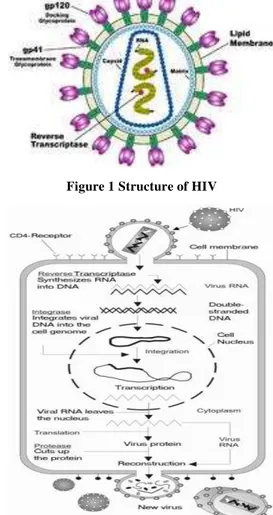
A HIV is human immunodeficiency virus causes AIDS (Acquired Immunodeficiency Virus) [1] which leads to life threatening opportunistic infections. It is one of the most serious, deadly diseases in human history. In the last two decades, over more than 60 million people have been infected with HIV. After getting into the body, the virus kills or damages cells of the body's immune system. The body tries to keep up by making new cells or trying to contain the virus, but eventually the HIV wins out and progressively destroys the body's ability to fight infections and certain cancers.HIV is of two types HIV-1 and HIV-2[1,2]. HIV is different in structure from other retroviruses. It is roughly spherical with a diameter of about 120nm, around 60 times smaller than a red blood cell, yet large for a virus. It is composed of two copies of positive single-stranded RNA enclosed by a conical
capsid comprising the viral protein p24, typical of
lentiviruses. HIV contains nine gene made of 9749 base pairs.
One of the biggest challenges facing biologists today is the structural and functional classification and characterization of protein sequences. Proteins also have structural or mechanical functions, number of computational have been developed over the years to predict the localization of proteins.
In this paper, we make a analysis of different classifiers such as ID3, LDA, SVM and C4.5 over HIV patient
records. The comparison is made in respect to accuracy rate and error rate.
Figure 1 Structure of HIV
ISSN: 2049-3444 © 2012 – IJET Publications UK. All rights reserved.
1754
2.
RELATED WORKS
In this section, we describe some Classification techniques.
2.1
Methods
Classification[5,6] is a data mining (machine learning) technique used to predict group membership for data instances. Classification analysis is the organization of data in given class. These approaches normally use a
training set where all objects are already associated with
known class labels. The classification algorithm learns from the training set and builds a model. Many classification models are used to classify new objects.
2.2
ID3
ID3[6] is a simple decision tree learning algorithm developed by Ross Quinlan. ID3 is a useful concept-learning algorithm because it can efficiently construct a decision tree that generalizes well. For non-incremental learning tasks, this algorithm is often a good choice for building a classification rule. However, for incremental learning tasks, it would be
far preferable to accept instances incrementally, without needing to build a new decision tree each time. It creates tree using information theory concepts and it also reduces expected number of comparisons. ID3 chooses split attribute with the highest information gain.
Entropy( S ) = −P (p) log 2 P (p)-P(n) log 2 P ( n )
P(p) is the proportion of positive examples in S , P(n) is the proportion of negative examples in S.
2.3
LDA
Linear Discriminant Analysis (LDA) is a supervised learning algorithm. LDA methods are used in statistics,
pattern recognition and machine learning to find a linear combination of features. The idea behind LDA is simple, for each class to be identified, calculate linear function of the attributes. The class function having highest score is treated as the predicted class. It is a statistical classification algorithm which is used to classify the values based on the linear combination among values. Linear Discriminant Analysis perfectly handles the data within class frequencies are unequal. LDA also evaluates the performances for randomly generated test data. The LDA Algorithm maximizes the ratio of between-class variance to the within-class variance in any particular data set thereby guaranteeing maximal separability. The use of Linear Discriminant Analysis for data classification is widely used to classify many biological data sets such
cancer, colon cancer, HIV analysis etc. In LDA based classification the data sets can be transformed and test vectors can be classified in two different approaches.
Transformation with class dependency: This type of
approach involves maximizing the ratio of between class variance to within class variance. The main objective is to maximize this ratio so that adequate class separability is obtained. The class-specific type approach involves using two optimizing criteria for transforming the data sets independently.
Transformation with class independency: This approach
involves maximizing the ratio of overall variance to within class variance. This approach uses only one optimizing criterion to transform the data sets and hence all data points irrespective of their class identity are transformed using this transform. In this type of LDA, each class is considered as a separate class against all other classes.
2.4
SVM
Support Vector Machine [1, 3, and 5] is a type of classification method, which estimates the classification function. SVM [1, 4, 10, 12, 15] (SVMs) is a set of related supervised learning methods that analyze data and recognize patterns, used for classification. Support Vector Machine (SVM) is a non-linear classifier method which is often reported as producing better classification results compared to other methods. The main idea of SVM is to construct a hyper plane as a decision surface in such a way that the margin of separation between positive and negative examples is maximized. This process non-linearly map the input sample data to some high dimensional space, where the data can be linearly separated, thus providing higher classification (or regression) accuracy. SVMs are rather interesting in that they enjoy both a sound theoretical basis as well as state-of-the-art success in real-world applications, especially in Bioinformatics.
2.5
C4.5
C4.5 [5, 6] algorithm is a greedy algorithm developed by Ross Quinlan, used for the induction of decision trees. C4.5 is a successor of ID3 algorithm. The decision trees generated by C4.5 adopt greedy approach in which decision trees are constructed in top-down recursive divide-and-conquer manner. C4.5 is often referred to as a
statistical classifier. Like ID3, C4.5 builds decision trees from training data set, using the concept of information entropy. The decision tree algorithm C4.5 [2] is developed from ID3 in the following ways: Handling missing data, handling continuous data, and pruning, generating rules, and splitting. For splitting purpose, C4.5 uses the Gain Ratio instead of Information Gain. C4.5 algorithm uses an attribute selection measure to select the attribute tested for each non leaf node in the tree. The 1
( ) ( )
V
i
Sv
InformationGAIN Entropy S Entropy Sv S
ISSN: 2049-3444 © 2012 – IJET Publications UK. All rights reserved.
1755
highest normalized information gain attribute is chosen to make the decision.
Gain Ratio (D, S) = Gain (D, S)/ Split INFO
2 1 log s i Di Di SplitINFO D D
3.
DATA SOURCE
To achieve our goal and analyze the classification techniques we obtained HIV dataset from AVERT’s Community database [7, 8]. There are 329 patient records taken from the data base which contains the worldwide HIV patient data within it. The obtained data consists of patient name, patient id, subtype, country, origin, sequence length and organism. Each patient record corresponds to related information about one patient. Subtype, gene sequence and organism are taken as attributes. Organism is considered as discrete attribute whereas sequential attributes are subtype and sequence.
4.
ANALYSIS OF CLASSIFIERS WITH
EXPERIMENTAL RESULTS
The basic phenomenon used to classify the HIV sub type classification using classifier is its performance and accuracy. The performance of a chosen classifier is validated based on error rate and computation time. The classification accuracy is predicted in terms of Sensitivity and Specificity. The computation time is noted for each classifier is taken in to account.
For Classification, this work constructed Confusion Matrix for HIV types. From the confusion matrix, the Specificity, Sensitivity, Accuracy Rate and Error rate have been calculated. For measuring accuracy rate and Error Rate, the following mathematical model is used.
Pr
P P pT
ecision
T
F
N N PT
Specificity
T
F
(Re
)
PP N
T
Sensitivity
call
T
F
P NP N P N
T
T
AccuracyRate
T
T
F
F
P N
P N P N
F
F
ErrorRate
T
T
F
F
The software framework of this work has been developed with Tanagra tool.
Figure 3 Sequence Variations of HIV1 and HIV2
The Figure 3 shows the gene sequence variations for HIV-1 and HIV-2. The distance variation between the HIV-HIV-1 and HIV-2 is high. Figure 4 shows the sub type group classification of HIV-1 and as well as HIV – 2. The group classification includes BC, A, B, A1C, A1, AC, AG, CH, AG + CH, BCU. Here gene sequence plays the vital role for sub type classification.
Figure 4 Group Variation in HIV Subtypes
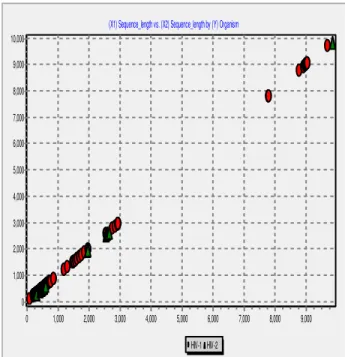
But in the case of general gene sequence classification, the results shows that, there is slight variation between HIV-1 and HIV-2
(X1) Sequence_length vs. (X2) Sequence_length
9,000 8,000 7,000 6,000 5,000 4,000 3,000 2,000 1,000 9,500 9,000 8,500 8,000 7,500 7,000 6,500 6,000 5,500 5,000 4,500 4,000 3,500 3,000 2,500 2,000 1,500 1,000 500
(X1) Sequence_length vs. (X2) Sequence_length by (Y) Sub_Type
ISSN: 2049-3444 © 2012 – IJET Publications UK. All rights reserved.
1756
Figure 5 General Variation of HIV subtypesTable 1 ID3 Classifier Performances
ID3 Classifier Performance
Values prediction Confusion matrix
Value Recall 1-precisio n
HIV1 HIV2 Sum
HIV1 0.9956 0.1493 HI V1
228 1 229
HIV2 0.6000 0.0164 HI V2
40 60 100
Su m
268 61 329
Error rate = 0.1246
Accuracy Rate = 87.538
From Table 1 ID3 classifier achieved moderate accuracy with nominal error rate. The confusion matrix shows the almost accurate classification and prediction.
Table 2 LDA Classifier Performances
LDA Classifier Performances
Values prediction Confusion matrix
Val ue
Reca ll
1-Precisi
on
HI V1
HI V2
Su m
HIV 1
1.00 00
0.3040 HI V1
229 0 229
HIV 2
0.00 00
1.0000 HI V2
100 0 100
Su m
223 0 329
Error Rate = 0.3040 Accuracy Rate = 69.605
From Table 2 LDA achieved the highest error rate with least accuracy. The confusion matrix results the poor classification because of the complexity to classify the groups in HIV sub types.
Table 3 SVM Classifier Performances
SVM Classifier Performances
Values prediction Confusion matrix
Value Recall 1-Precision
HIV1 HIV2 Sum
HIV1 1.0000 0.3040 HIV1 229 0 229
HIV2 0.0000 1.000 HIV2 100 0 100
Sum 329 0 329
Error rate = 0.3040 Accuracy Rate = 69.605
From Table 3 SVM classifier also shows the least accuracy and highest error rate. Note that the computation time takes more time and affects the performance.
Table 4 C4.5 Classifier Performances
C4.5 Classifier Performances
Values prediction Confusion matrix
Value Recall 1-Precision
HIV1 HIV2 Sum
HIV1 0.9563 0.0179 HIV1 219 10 229
HIV2 0.9600 0.943 HIV2 4 96 100
Sum 223 106 329
Error Rate = 0.0426 Accuracy Rate = 95.74
From Table 4 C4.5 classifier achieves the highest accuracy and very least error rate. The confusion matrix shows the exact classification between the HIV sub types and also gives the better prediction in group classification of each HIV subtype.
5.
PERFORMANCE EVALUATION
From the experimental results C4.5 shows better results because of its least error rate which increased accuracy
(X1) Sequence_length vs. (X2) Sequence_length by (Y) Organism
HIV-1 HIV-2
9,000 8,000 7,000 6,000 5,000 4,000 3,000 2,000 1,000 0 10,000
9,000
8,000
7,000
6,000
5,000
4,000
3,000
2,000
1,000
ISSN: 2049-3444 © 2012 – IJET Publications UK. All rights reserved.
1757
and also with time efficiency. It shows the concrete results with different HIV sub types of patient records. The error rate of the C4.5 classifier is 0.0179 (1-precision) and 0.9563(recall) whereas the computation time is only 15 milliseconds. In the case of SVM, it shows 0.3040 (precision) and 1.0000 (recall). Compare with all other classifiers SVM consumes 32 milliseconds computation time. The accuracy, precision and recall values of the attributes are obtained using confusion matrix. Therefore C4.5 classifier is suggested for HIV sub type classification to get better accuracy and performance.
Table 5 Accuracy Rate and Error Rate
Classifier Type
Error Rate
Accuracy Rate
ID3 0.1246 87.53
LDA 0.3040 69.60
SVM 0.3040 69.60
C4.5 0.0426 95.74
Table 6 Execution Time of Various Classifiers
Classifier Type
Computation Time (ms)
ID3 15
LDA 16
SVM 31
C4.5 15
Table 5 shows the Accuracy and Error rate of classifiers such as ID3, LDA, SVM and C4.5. These results are obtained from the confusion matrix.
Figure 6 Comparison of Accuracy Rate
Figure 6 and Figure 7 shows that the various execution details of different Classifiers for HIV Patterns. From these Figures, it explicits that that C4.5 provides better accuracy for HIV datasets.
Figure 7 Comparison of Error Rate
Figure 8 Execution of Various Classifiers
Table 6 shows the Execution time of different classifiers. From the Figure 8, it is observed that execution time of C4.5 and ID3 is considerably less as compared with LDA and SVM.
However from the experimental results ID3 has less accuracy rate and high error rate than C4.5. From our work, it is revealed that C4.5 giving more accuracy in terms of sensitivity, specificity, Accuracy and Error Rate as compared with other specified classifiers.
6.
CONCLUSION
ISSN: 2049-3444 © 2012 – IJET Publications UK. All rights reserved.
1758
better results. It also results sequence based classification with very least error rate and which increases the accuracy rate. The performance of C4.5 shows the high level compare with other classifiers. Hence C4.5 shows the concrete results with different HIV sub types of patient records. Therefore C4.5 classifier is suggested for HIV sequence based classification to get better results with accuracy and performance.
REFERENCES
[1] Anubha Dubey, Bhasker Pant, UshaChouhan,” SVM Model for classification of structural and regulatory
proteins of HIV1 and HIV2”, Journal of Advanced
Bioinformatic Applications and Research, Issue 1, 2011.
[2] Anubha Dubey et al, “Machine Learning Model for HIV1 and HIV2 enzyme secondary structure
classification”, Scholars Research Library, 2011.
[3] A.M. Saravanan and R.Vijaya,” Feature Selection of HIV/AIDS using Data Mining technique by applying
the concept of Theory of Evidence”, IJCSNS,
VOL.11 No.5, May 2011.
[4] A. Steven Eliuk, B. Keith Ruiter, and C. Pierre
Boulanger,” Classifying HIV1 circulating Recombinant forms”.
[5] Dynamic Optimization Algorithms to mitigate HIV escape Esteban A. Hernandez-V argas, Richard H. Middleton, Patrizio Colaneri, Franco Blanchini, December 15-17, 2010
[6] Quinlan, J.R, C4.5: Programs for Machine Learning. Morgan Kaufmann, San Francisco. 1993.
[7] Minghao Piao, Jong Burn Lee, Khalid E.k.saeed and
Keun Ho Ryu,” Discovery of Significant
classification rules from Incrementally Induced Decision Tree Ensemble for Diagnosis of
Disease”,Springer 2009.
[8] A.Dubey, B.Pant and Neeru Adlakha,”SVM Model for Amino Acid Composition basedClassification of
HIV1 Groups”. IEEE digital library published.
[9] Pant, K.Pant and K.R.Pardasani,”SVM classifier for classification of MMPs and ADAMs accepted for publication in ICMLC 2010, Banglore.
[10]www.bioafrica.com
[11]www.pdb.org